Abstract
We have developed a cost-effective genome-scale PCR-based method for high-definition DNA FISH (HD-FISH). We visualized gene loci with diffraction-limited resolution, chromosomes as spot clusters, and single genes together with transcripts by combining HD-FISH with single-molecule RNA FISH. We provide a database of over 4.3 million primer pairs targeting the human and mouse genome readily usable for rapid and flexible generation of probes, making HD-FISH invaluable for many research and diagnostic applications.
DNA fluorescence in situ hybridization (FISH) remains a widely used method with broad applications including genetic diagnostics and chromosome architecture analysis1,2. Despite continuous advancements, several aspects of this technology deserve further improvement to enable its enormous potential to be fully exploited in both research and diagnostic laboratories. For example, even though a formidable portfolio of ready-to-use probes is available from various commercial sources, the choice is usually restricted to a relatively small number (<200) of loci mostly belonging to the human genome. Probes targeting other loci or species can be developed from genomic DNA fragments cloned in bacterial artificial chromosomes (BACs) and fosmids, or using array-based technology3,4. However, implementing these methods in-house or outsourcing them to commercial parties can be challenging if not impossible for many laboratories for both logistic and economic reasons – for example when multiple loci need to be targeted in a non-human species in a research laboratory not primarily focused on FISH technology. Another important barrier is that flexible selection and control of the pool of DNA fragments constituting a FISH probe – which would enable combinatorial labeling and tailoring the probe size at user's discretion – is technically unfeasible with methods based on cloned DNA fragments methods, and not cost-effective with array technology.
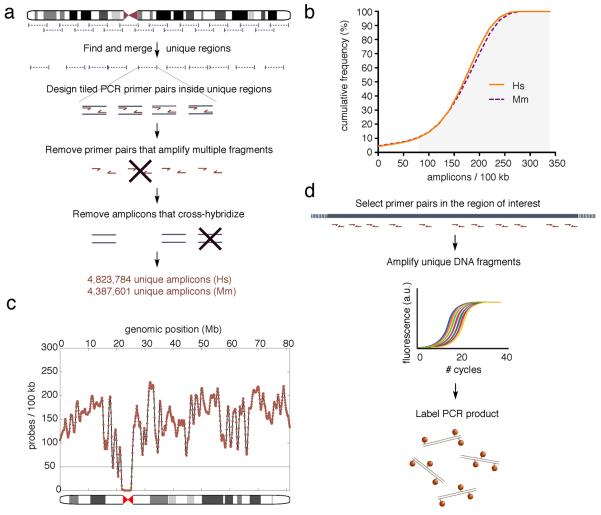
To overcome these limitations and enable a wider community of researchers to fully exploit the potential of DNA FISH, we designed human and mouse genomic libraries of polymerase chain reaction (PCR) primer pairs with optimal thermodynamic features, delimiting amplicons 200–220 nucleotides (nt) in length. After filtering out primer pairs amplifying multiple targets as well as cross-hybridizing amplicons, we obtained a database consisting of 4,823,784 and 4,387,601 unique primer pairs for the human and mouse genome, respectively (Fig. 1a, and Supplementary Database). Over 90% of both human and mouse genomes are densely covered with our primers, with more than 80 primer pairs per 100 kilobases (kb) (Fig. 1b–c, and Supplementary Fig. 1a–b). Using such primers, highly specific double-stranded probes can be rapidly generated for virtually any desired genomic locus by fluorescently labeling pooled amplicons after PCR (Fig. 1d), with a flexibility and cost-effectiveness otherwise unachievable with current methods (Supplementary Fig. 2a–b, and Supplementary Cost Analysis).
Figure 1.
HD-FISH probe design and synthesis. (a) Construction of a database of unique PCR primer pairs and amplicons in human (Hs) and mouse (Mm) genomes. (b) Cumulative frequency of amplicons along the human and mouse genome. In both cases, 90% of 100 kb tiled windows in which the genome is arbitrarily binned contain ≥ 80 amplicons (grey highlight). (c) Example of amplicon density along human chromosome 17. (d) Probe preparation pipeline from primer selection in a region of interest (blue bar) to labeling of PCR products with the desired fluorophore (red spots).
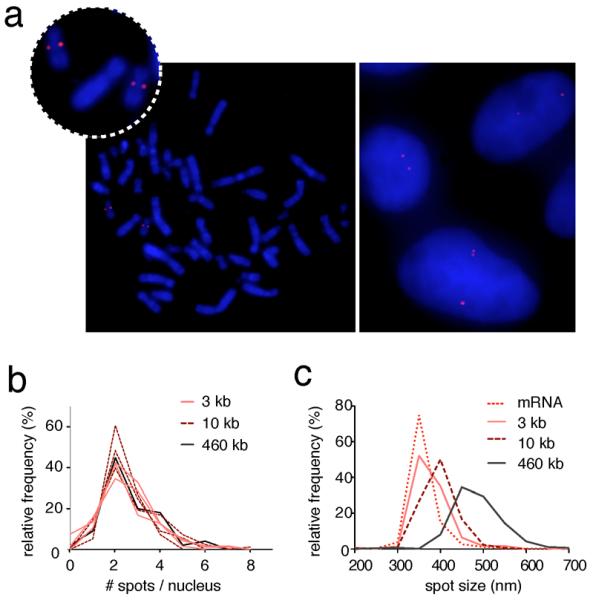
As a proof-of-principle, we constructed a probe consisting of fifty 200 nt-long unique fragments obtained by PCR and labeled with the Universal Linkage System (ULS™)5 targeting the HER2/ERBB2 locus on chromosome 17. The effective target size of this probe (ETS, i.e. the number of nucleotides effectively targeted) is 10 kb (50 amplicons × 200 nt), an order of magnitude shorter than commercially available HER2 probes used in diagnostics. Hybridization with this HER2 probe was specific on both human lymphocyte metaphase spreads as well as in human mammary epithelial cells (HME) processed to preserve their three-dimensional nuclear structure (3D FISH)6. 85% of interphase nuclei contained between two and four loci, as expected in dividing diploid cells (Fig. 2a). Remarkably similar count distributions were obtained for HER2 and other loci on chromosome 17 over a broad range of ETSs down to 3 kb, demonstrating the sensitivity of our method even with probes derived from only 15 amplicons (Fig. 2b and Supplementary Fig. 3). Notably, a probe against HER2 with 3 kb ETS yielded signals with a size (on average 362 ± 31 nm diameter) similar to the diffraction limit of the microscope used (Fig. 2c). For this reason, we named our method high-definition DNA FISH (HD-FISH).
Figure 2.

Specificity and sensitivity of HD-FISH. (a) Human HER2 locus (red) visualized in metaphase spreads (left) and HME cells (right) using a 10 kb ETS probe. Blue: DAPI. (b) Distributions of spot counts for three loci on chromosome 17 including HER2, visualized with 10 vs. 3 kb ETS probes, and with a HER2 commercial probe spanning 460 kb. (c) Distribution of spot sizes for the same HER2 probe as in (a). mRNA: diffraction-limited HER2 mRNA molecules detected by smRNA-FISH.
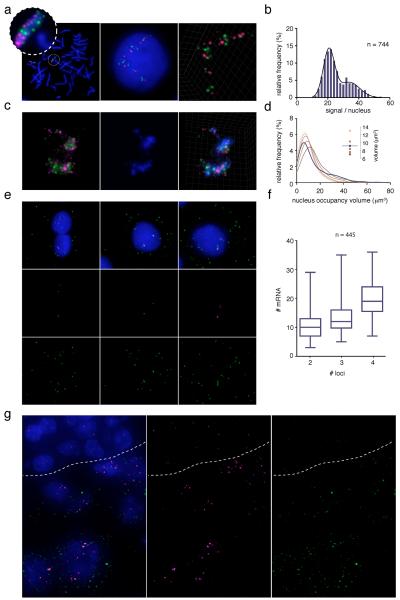
To demonstrate the scalability of our method, we simultaneously targeted multiple loci spaced evenly on different chromosomes using probes labeled with two alternating fluorophores (Supplementary Fig. 4a and Supplementary Database). Similar to single-locus probes, this “spotting” strategy was specific on both metaphase spreads as well as HME interphase nuclei after 3D HD-FISH, allowing precise enumeration of targeted chromosomes (Fig. 3a–b, Supplementary Fig. 4b, and Supplementary Movie 1). The numbers of spots detected with the first and second fluorophore in the same cell were highly concordant (Supplementary Fig. 4c–d), indicating that the type of fluorophore does not influence HD-FISH hybridization efficiency. Importantly, our chromosome spotting strategy proved to be substantially more rapid and cost-effective in comparison to alternative available methods (Supplementary Fig. 2a–b, and Supplementary Cost Analysis).
Figure 3.
Versatility of HD-FISH. (a) Chr17 spotting with ten alternatively labeled HD-FISH probes in metaphase spreads (left) and HME cells (mid panel and 3D rendering). (b) Spot quantification in HME cells exemplified in (a). (c) Chr17 spotting with sixteen HD-FISH probes (green and magenta) and paint probes (blue) (left: Z-projections; right: 3D rendering). (d) Left: Chr17 volume estimation using spotting (purple) vs. paint signals at different thresholds (brown gradient). Right: range of median values for curves on the left. Purple line: spotting signal median volume (e–f) Visualization and quantification of HER2 loci (magenta) and transcripts (green) in HME cells. (g) HER2 loci (magenta) and transcripts (green) in breast cancer stroma (above dashes) vs. tumor cells (below dashes). n: number of cells analyzed.
In interphase nuclei, HD-FISH spotting yielded clusters of variable size, shape, and density, reminiscent of chromosomal territories visualized with paint probes7. To investigate the spatial relationship between chromosome territories and HD-FISH spot clusters, we performed simultaneous hybridization with HD-FISH spotting and paint probes in HME cells. Upon visual inspection, HD-FISH spot clusters largely overlapped with chromosome territories, further emphasizing the specificity of our approach (Fig. 3c, Supplementary Fig. 4e, and Supplementary Movie 1 and 2). Taking advantage of the high optical resolution of HD-FISH signals, we next performed 3D triangulation of clustered HD-FISH spots, demonstrating that with probes spaced evenly every 5 megabases (Mb) the nucleus occupancy volume of HD-FISH clusters and corresponding chromosome territories visualized with paint probes resulted in similar volumes (Fig. 3d). In many cases, however, isolated HD-FISH spots were detected in regions with low intensity paint signal, possibly reflecting better sampling of the chromosome volume (Fig. 3c and Supplementary Fig. 4b,e and f).
To further extend the versatility of our method, we combined it with single-molecule RNA FISH (smRNA FISH)8 in HME cells, simultaneously detecting individual HER2 loci, sites of active transcription, and mature HER2 transcripts (Fig. 3e). The number of HER2 transcripts scaled proportionally to the number of HER2 loci (on average 10.4 HER2 mRNA counts for 2 DNA loci compared to 20.1 HER2 mRNA counts for 4 DNA loci, Kolmogorov-Smirnov test p-value = 3 × 10−45), in agreement with previous observations9 (Fig. 3f and Supplementary Fig. 5). Finally, HD-FISH and smRNA FISH were also used in combination on formalin-fixed paraffin-embedded breast cancer sections. In HER2-positive breast cancers, HER2 amplification coupled to high HER2 mRNA expression was observed in tumor areas, but not in intra-tumor stroma, confirming the specificity of our probes (Fig. 3g).
In summary, we have developed a PCR-based DNA FISH pipeline offering important advantages over existing methods. First, HD-FISH can reliably operate at the resolution limit of conventional optical microscopy due to the systematic design of unique probes with short span enabling visualization of virtually any human or mouse genomic locus. Importantly, diffraction-limited HD-FISH spots are treated as digital instead of analog signals, allowing a threshold-insensitive and more robust quantification than with existing methods. Second, our method is logistically simple, rapid, and cost-effective, and is therefore especially relevant for research laboratories that do not use FISH techniques routinely but wish to study loci for which no probe is commercially available. Third, our method enables a flexibility unachievable with current technologies: because unique primers are synthesized in 96-well plates and PCR reactions are performed separately, different probes consisting of subsets of unique amplicons can be easily and rapidly obtained and combinatorially labeled from the same set of primers. Flexible combinatorial labeling of HD-FISH spotting probes will enable studying chromosome organization in situ by precisely determining the relative position of reference points within spotting clusters. Finally, combination of high-definition DNA and RNA FISH methods allows systematic in situ analyses of the association between chromosome organization and gene expression, which has not been possible so far due to the lack of robust single-cell quantitative assays. In conclusion, HD-FISH is a powerful method for research and diagnostics with broad applications from the diagnosis of chromosomal aberrations to chromosome architecture studies.
Supplementary Material
ACKNOWLEDGEMENTS
We thank Philipp Junker and Stefan Semrau for helpful discussions. This work was supported by the NIH/NCI Physical Sciences Oncology Center at MIT (U54CA143874), an NIH Pioneer award (1DP1OD003936), and a NWO Vici award. M.B. and S.I. are sponsored by the Human Frontiers Science Program.
Footnotes
AUTHORS CONTRIBUTIONS N.C. and A. v. O. conceived the method. M.B and N.C. performed experiments, analyzed the data, and wrote the manuscript. L.T. generated the genome-wide primer databases, designed the probes, and wrote the manuscript. S.L.K. and S.I. developed software for image processing, provided suggestions on data analysis, and corrected the manuscript. A. v. O. guided experiments and data analysis, and wrote the manuscript.
COMPETING FINANCIAL INTERESTS The authors declare no competing financial interests.
REFERENCES
- 1.Fluorescence In Situ Hybridization (FISH) - Application Guide. Springer; 2008. [Google Scholar]
- 2.Fluorescence in situ Hybridization (FISH): Protocols and Applications (Methods in Molecular Biology) Humana Press; 2010. [Google Scholar]
- 3.Boyle S, Rodesch MJ, Halvensleben HA, Jeddeloh JA, Bickmore WA. Fluorescence in situ hybridization with high-complexity repeat-free oligonucleotide probes generated by massively parallel synthesis. Chromosome Res. 2011;19:901–909. doi: 10.1007/s10577-011-9245-0. [DOI] [PMC free article] [PubMed] [Google Scholar]
- 4.Yamada NA, et al. Visualization of fine-scale genomic structure by oligonucleotide-based high-resolution FISH. Cytogenet. Genome Res. 2011;132:248–254. doi: 10.1159/000322717. [DOI] [PubMed] [Google Scholar]
- 5.Wiegant JC, et al. ULS: a versatile method of labeling nucleic acids for FISH based on a monofunctional reaction of cisplatin derivatives with guanine moieties. Cytogenet. Cell Genet. 1999;87:47–52. doi: 10.1159/000015390. [DOI] [PubMed] [Google Scholar]
- 6.Solovei I, Cremer M. 3D-FISH on cultured cells combined with immunostaining. Methods Mol. Biol. 2010;659:117–126. doi: 10.1007/978-1-60761-789-1_8. [DOI] [PubMed] [Google Scholar]
- 7.Cremer T, Cremer M. Chromosome territories. Cold Spring Harb Perspect Biol. 2010;2:a003889. doi: 10.1101/cshperspect.a003889. [DOI] [PMC free article] [PubMed] [Google Scholar]
- 8.Raj A, van den Bogaard P, Rifkin SA, van Oudenaarden A, Tyagi S. Imaging individual mRNA molecules using multiple singly labeled probes. Nat. Methods. 2008;5:877–879. doi: 10.1038/nmeth.1253. [DOI] [PMC free article] [PubMed] [Google Scholar]
- 9.Tsafrir D, et al. Relationship of gene expression and chromosomal abnormalities in colorectal cancer. Cancer Res. 2006;66:2129–2137. doi: 10.1158/0008-5472.CAN-05-2569. [DOI] [PubMed] [Google Scholar]
- 10.Kent WJ. BLAT—the BLAST-like alignment tool. Genome Res. 2002 doi: 10.1101/gr.229202. [DOI] [PMC free article] [PubMed] [Google Scholar]
- 11.Untergasser A, et al. Primer3--new capabilities and interfaces. Nucleic Acids Research. 2012 doi: 10.1093/nar/gks596. doi:10.1093/nar/gks596. [DOI] [PMC free article] [PubMed] [Google Scholar]
- 12.Wheeler DL, et al. Database resources of the National Center for Biotechnology. Nucleic Acids Research. 2003;31:28–33. doi: 10.1093/nar/gkg033. [DOI] [PMC free article] [PubMed] [Google Scholar]
- 13.Itzkovitz S, et al. Single-molecule transcript counting of stem-cell markers in the mouse intestine. Nat. Cell Biol. 2012;14:106–114. doi: 10.1038/ncb2384. [DOI] [PMC free article] [PubMed] [Google Scholar]
Associated Data
This section collects any data citations, data availability statements, or supplementary materials included in this article.


