Abstract
Apoptosis, a programmed cell death, is an important control mechanism of cell homeostasis. Deficiency in apoptosis is one of the key features of cancer cells, allowing cells to escape from death. Activation of apoptotic signaling pathway has been a target of anti-cancer drugs in an induction of cytotoxicity. PQ1, 6-methoxy-8-[(3-aminopropyl)amino]-4-methyl-5-(3-trifluoromethylphenyloxy)quinoline, has been reported to decrease the viability of cancer cells and attenuate xenograft tumor growth. However, the mechanism of the anti-cancer effect is still unclear. To evaluate whether the cytotoxicity of PQ1 is related to induction of apoptosis, the effect of PQ1 on apoptotic pathways was investigated in T47D breast cancer cells. PQ1-treated cells had an elevation of cleaved caspase-3 compared to controls. Studies of intrinsic apoptotic pathway showed that PQ1 can activate the intrinsic checkpoint protein caspase-9, enhance the level of pro-apoptotic protein Bax, and release cytochrome c from mitochondria to cytosol; however, PQ1 has no effect on the level of anti-apoptotic protein Bcl-2. Further studies also demonstrated that PQ1 can activate the key extrinsic player, caspase-8. Pre-treatment of T47D cells with caspase-8 or caspase-9 inhibitor suppressed the cell death induced by PQ1, while pre-treatment with caspase-3 inhibitor completely counteracted the effect of PQ1 on cell viability. This report provides evidence that PQ1 induces cytotoxicity via activation of both caspase-8 and caspase-9 in T47D breast cancer cells.
Keywords: Apoptosis, Bcl-2 family, caspases, PQ1, quinoline derivative
Introduction
Quinoline is a heterocyclic aromatic nitrogen compound which is often used for the design of many synthetic compounds with diverse medical benefits [1]. Recent studies found that numerous quinoline derivatives display potent anti-cancer activity by targeting different cellular pathways, including multidrug resistance, proliferation, and apoptosis [2–4]. Apoptosis is a programmed cell death, an important control mechanism of normal cell physiology [5, 6]. Deficiency in apoptosis is one of the key features of cancer cells [7]. Restoring and activating apoptosis in cancer cells is a major target of cancer treatment [8]. By using cell- and caspase-based high-throughput screening assays, Kemnitzer et al. found a new series of apoptosis inducers, the 1-benzoyl-3-cyanopyrrolo[1,2-α]quinolines, among which the compound 1-(4-(1H-imidazol-1-yl)benzoyl)-3-cyanopyrrolo[1,2-α]quinoline displayed high cytotoxic activity in T47D human breast cancer cells, HCT116 human colon cancer cells, and SNU398 hepatocellular carcinoma cancer cells [9]. Sharma et al. reported that a quinoline derivative, 8-methoxy primido[4′,5′:4,5]thieno(2,3-b)quinolin-4(3H)-one (MPTQ), induces apoptosis in K562 myeloid leukemia cell line and inhibits tumor progression in mice bearing different types of tumors [4]. These reports indicate that quinoline derivatives are potential anti-cancer drugs, targeting the induction of apoptosis.
Caspases, a class of proteases, play an essential role in the induction and execution of apoptosis. Caspase-dependent apoptosis can be generally divided into two signaling pathways: the intrinsic pathway and the extrinsic pathway [10]. The intrinsic pathway is initiated from within the cell and depends on the balance of the pro- and anti-apoptotic members of Bcl-2 family proteins. The internal signal, like DNA damage or severe cellular stress, causes pro-apoptotic protein, Bax, to migrate to the surface of the mitochondrion, where it inhibits the protective effect of anti-apoptotic protein Bcl-2. Bax generates holes in the mitochondrial membrane, which permits the leakage of cytochrome c to the cytoplasm. Cytochrome c activates caspase-9 and subsequently results in the cleavage of caspase-3 as the cell death executioner [11]. In contrast, the extrinsic pathway is triggered by a signal outside of the cells. These signals are pro-apoptotic ligands that bind to their specific receptors on the plasma membrane and activate the checkpoint protein caspase-8 [12]. Caspase-8 signal transduction eventually activates the caspase-3 to initiate cell death [12]. Some compounds trigger only one apoptotic pathway, while others can activate both pathways. For example, the MPTQ is reported to trigger two signaling pathways by activating both caspase-8 and caspase-9 [4].
PQ1, 6-methoxy-8-[(3-aminopropyl)amino]-4-methyl-5-(3-trifluoromethylphenyloxy)quinoline, has been reported to possess anti-cancer activity in breast cancer cells. Previous studies showed that one μM of PQ1 decreased cell viability to 50% in T47D breast cancer cells and attenuated 70% of T47D xenograft tumor in nude mice [13]. In the present study, we investigated whether the cytotoxicity induced by PQ1 is mediated through apoptosis. The results of Western blotting and immunofluorescence assays showed that PQ1 activated mitochondrial intrinsic pathways by increasing Bax, releasing cytochrome c from the mitochondria to cytosol, and subsequently activating caspase-9. Furthermore, PQ1 increased the level of active caspase-8. This report demonstrates that PQ1 induces cytotoxicity in T47D cells via both caspase-8 and caspase-9 mediated apoptotic pathways.
Materials and Methods
Reagents and antibodies
PQ1, 6-methoxy-8-[(3-aminopropyl)amino]-4-methyl-5-(3-trifluoromethylphenyloxy)quinoline, was obtained as described by Shi at al. [14] and graciously provided by Dr. Duy Hua (Kansas State University). Acridine orange/propidium iodide (AO/PI) dye for viability assay was purchased from Nexcelom Bioscience (Lawrence, MA, USA). Anti-cleaved caspase-3, anti-caspase-8 p18 (H-134), anti-caspase-9 p35 (H-170), anti-Bax, and anti-Bcl-2 antibodies were all obtained from Santa Cruz Biotechnologies (Santa Cruz, CA, USA). Rabbit anti-cytochrome c, HRP-linked anti-rabbit/mouse, anti-cleaved caaspase-8 (Asp391), and anti-cleaved caspase-9 (Asp315) antibodies were purchased from Cell Signaling Technology (Danvers, MA, USA). Mouse anti-cytochrome c and rabbit anti-Cox IV antibodies were obtained from Abcam (Cambridge, MA, USA). Alexa-568-conjugated anti-rabbit IgG and Alexa-488-conjugated anti-mouse IgG antibodies were obtained from Invitrogen (Camarillo, CA, USA). Caspase-3 inhibitor (Ac-DMQD-CHO), caspase-8 inhibitor (Ac-IETD-CHO), and caspase-9 inhibitor (Ac-LEHD-CHO) were purchased from Enzo Life Sciences (Enzo Life Sciences, Farmingdale, NY, USA).
Cell line and cell culture
T47D human breast cancer cell line was purchased from American Type Cell Culture (ATCC) (Manassas, MA, USA). Cells were grown in RPMI-1640 (Sigma-Aldrich, St Louis, MO, USA) supplemented with 10% fetal bovine serum (Atlanta Biological, Lawrenceville, GA, USA), 1 mM sodium pyruvate, 10 mM hepes, 4.5 g/L glucose, 2 g/L sodium bicarbonate, and 0.2 units/ml bovine insulin. Cells were maintained in T-75 flasks at 37 °C with 5% CO2 and cultured in 6-well plates or T-25 flasks for experimental analysis.
Cell morphology
T47D cells were cultured in T-25 flasks until 80% confluent state. Cells were treated with DMSO and 100, 200, and 500 nM PQ1 for 24 and 48 hours. Cells without any treatment were used as controls. Cell morphology was captured using Nikon 80i light microscope.
Cell viability assay
Cell viability was measured using Acridine Orange/Propidium Iodide (AO/PI) staining method. T47D cells were cultured into 6-well plates until 80% confluent state. Cells were treated with DMSO and 100, 200, and 500 nM PQ1 for 24 and 48 hours. Cells without treatment were used as controls. Detached and trypsinized cells were combined to access the total cell viability after treatment. Samples were centrifuged at 2,000 rpm using a HERMLE Z300K centrifuge with rotor 221.05 V01 (Labnet, Woodbridge, NJ, USA) for 5 minutes. Media and trypsin supernatant were discarded and cell pellet was resuspended in 1 X phosphate-buffered saline (PBS). A cell suspension was mixed with AO/PI dye (5 μg/mL AO and 100 μg/mL PI in PBS) at 1:1 ratio. Viable and dead cells were visually examined by the Cellometer Auto 2000 (Nexcelom Bioscience, Lawrence, MA, USA). AO is a nuclear stain that is used to stain live cells and emits in the “green” range. PI is a fluorescent stain that only penetrates dead cells and emits in the “red” range. After taking both “green” and “red” fluorescent images, all fluorescent cells in each channel were counted and the concentration of live (green) and dead (red) cells as well as viability were determined.
Flow cytometry
Apoptotic cells were analyzed by flow cytometry using the Alexa Fluor 488 Annexin V/Dead Cell Apoptosis Kit (Invitrogen, Camarillo, CA, USA). T47D cells were treated with DMSO and various concentrations of PQ1 for 24 and 48 hours. Cells were harvested and washed with cold PBS. After centrifugation, supernatant was discarded and cell pellets were resuspended in 1 X annexin-binding buffer to the final concentration at 1 × 10⁶ cells/ml. After adding 1 μL of Alexa Fluor 488 annexin V and 1 μL of 100 μg/ml PI working solution into each 100 μL cell suspension, cells were incubated at room temperature for 15 minutes. 400 μL of 1 X annexin-binding buffer were added into the cell suspension after incubation. Stained cells were detected by flow cytometry measuring the fluorescence emission at 530 nm and 575 nm.
Mitochondria isolation
Mitochondria were isolated by using Mitochondria Isolation Kit from Thermo Scientific (Rockford, IL, USA). Followed the manufacturer’s instructions, control and treated cells were trypsinized and centrifuged at 850 x g using an Eppendorf centrifuge 5415R with rotor F-45-24-11 for 2 minutes. Cell pellets were treated with mitochondria isolation reagents. Cytosol and mitochondria fractions were isolated by two consecutive centrifugation steps (700 x g and 12,000 x g, respectively) at 4 °C. After isolation, expressions of cytochrome c in mitochondria and cytosol were examined by western blot analysis.
Western blot analysis
T47D cells were cultured in T-25 flasks until 80% confluent state and then treated with DMSO and PQ1 as indicated for 48 hours. Cells without treatment were used as controls. Cells were washed with PBS for three times and harvested in lysis buffer (Cell Signaling Technology, Danver, MA, USA). Cell lysates were sonicated using Vibra-Cell sonicator (Sonics & Materials Inc, Danbury, CT, USA) and then centrifuged at 13,000 rpm using an Eppendorf centrifuge 5415R with rotor F-45-24-11 for 30 minutes at 4 °C. Supernatants were collected and measured for its total protein concentration. Thirty μg of samples were separated by 4–20% gradient SDS-PAGE for 35 minutes at 200 Volts, and transferred to nitrocellulose membranes (Midwest Scientific, Saint Louis, MO, USA). After blocked with 5% milk for 30 minutes, membranes were immunoblotted against protein of interest. Immunoreactions using chemiluminescence were visualized by FluoChem E Imaging Instrument (ProteinSimple, Santa Clara, CA, USA). Intensities of the bands were digitized using Un-Scan-It software (Silk Scientific Inc., Orem, Utah, USA).
Immunofluorescence and confocal microscopy
T47D cells cultured on coverslips in 6-well plates were treated with DMSO and PQ1 for 48 hours. Cells were rinsed by warm PBS and fixed with 2% paraformaldehyde for 20 minutes at room temperature. Fixed cells were washed 3 times with PBS and then permeabilized with 0.1% Triton X-100 for 8 minutes. Cells were washed 3 times with PBS again, and blocked with 2.5% BSA in PBS for 1 hour at room temperature. After blocking, cells were incubated with primary antibodies overnight at 4°C and Alexa-conjugated secondary antibodies for 1 hour at room temperature. DAPI was used for nuclei stain. The slides were mounted with prolong-antifade reagent (Invitrogen, Camarillo, CA, USA), sealed and observed under a confocal microscope (Carl Zeiss LSM 700 META, Narashige, MN, USA).
Caspase inhibitor assay
T47D cells were cultured into 6-well plates until 80% confluent state. Cells were pretreated with caspase-3 inhibitor (Ac-DMQD-CHO), caspase-8 inhibitor (Ac-IETD-CHO), or caspase-9 inhibitor (Ac-LEHD-CHO) at concentration of 20 μM for 1 hour, and then treated with 500 nM PQ1 for 23 hours. Cells without any treatments or treated with 500 nM PQ1 for 24 hours were used as controls. After treatment, cell viability was assessed by trypan blue method. Cells floated in the media were collected and cells attached to the wells were trypsinized. Two parts of cells were combined together, centrifuged and resuspended. A cell suspension was mixed with trypan blue dye (0.2% in PBS) at 1:1 ratio and viable cells were examined by the Cellometer Auto 2000 (Nexcelom Bioscience, Lawrence, MA, USA).
Statistical analysis
Statistical analysis of data was performed using student’s t-test Data presented were expressed as mean ± standard deviation (S.D.) of at least three independent experiments. Significance was considered at p-value < 0.05.
Results
PQ1 changes cell morphology and induces cell death in T47D breast cancer cells
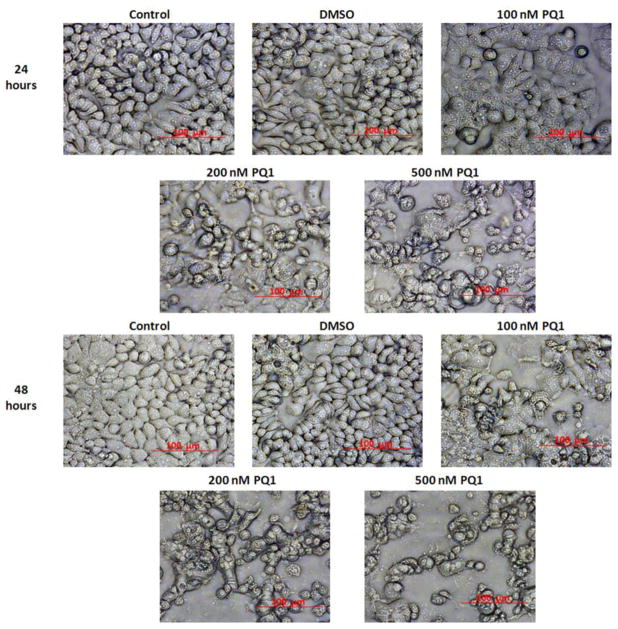
Cytotoxicity of PQ1 on T47D breast cancer cells was determined by observed morphological change and dual-fluorescence viability assay. T47D breast cancer cells were treated with DMSO and 100, 200, and 500 nM of PQ1 for 24 and 48 hours. Cells without treatment were used as controls. Differences in cell morphology were observed between PQ1-treated and control cells under 20X magnification of light microscopy. Morphological changes including cell rounding, shrinkage, and detachment were found in PQ1-treated cells in a dose-dependent manner (Fig. 1). Compared with cells treated with PQ1 for 24 hours, cells treated with the same concentration of PQ1 for 48 hours had more significant morphological changes (Fig. 1). These results suggested that PQ1 induces morphological changes in a dose- and time-dependent manner. To determine if the changes of morphology were associated with cell death, cell viability was examined using dual-fluorescence (AO/PI) viability assay. The results showed that PQ1 decreased cell viability in a dose- and time-dependent manner as well. 100 nM PQ1 did not significantly reduce cell viability with 24-hour of treatment, but significantly reduced cell viability to 85% with 48-hour of treatment (Fig. 2). 500 nM PQ1 showed a 37% and 47% reduction of cell viability at 24- and 48-hour of treatment, respectively (Fig. 2). DMSO, a PQ1 solvent, showed no changes on cell morphology and viability at any time points (Fig. 1, 2). All these results indicate that PQ1 induces morphological changes and decreases cell viability in T47D breast cancer cells.
Fig. 1. PQ1 changes cell morphology in T47D breast cancer cells.
T47D cells were treated with DMSO and various concentrations of PQ1 for 24 and 48 hours. Cells without treatments were used as controls. Cell morphology was captured using the light microscope under 20X magnification. The scale bar represents a 100 μm in size.
Fig. 2. PQ1 decreases cell viability in T47D breast cancer cells.

T47D cells were treated with DMSO and various concentrations of PQ1 for 24 and 48 hours. Cells without treatments were used as controls. Cell viability was determined by the AO/PI staining method. Data were obtained in three independent experiments and are represented as the mean ± S.D. * P-value is <0.05 compared to control. **P-value is <0.05 compared to 24 hours treatment.
PQ1 induces apoptosis in T47D breast cancer cells
Morphological features of apoptosis including cell shrinkage and detachment were observed in Figure 1. Here, the effects of PQ1 on apoptosis were further determined by flow cytometry. T47D cells were treated with various concentrations of PQ1 for 24 and 48 hours, and cell death was characterized using flow cytometry with propidium iodide (PI) and Alexa Fluor 488 annexin V staining. The Annexin V-FITC positive /PI negative cells located in the lower right quadrant of the histogram represent early apoptotic cells, and the Annexin V-FITC positive/PI positive cells in the upper right quadrant represent late apoptotic cells. Figure 3 shows that 24-hour treatment of 500 nM PQ1 increased the early apoptotic cell population from 0.44% to 9.25% and the late apoptotic cell population from 0.27% to 12.69%, compared with the control. Same concentration of PQ1 resulted in a higher increase in the percentage of early apoptotic cells (from 0.69% to 11.68%) and late apoptotic cells (from 0.57% to 20.23%) at 48-hour treatment (Fig. 3). The results of flow cytometry suggest that PQ1 induces cell death through apoptotic pathways in T47D cells.
Fig. 3. PQ1 induces apoptosis in T47D breast cancer cells.
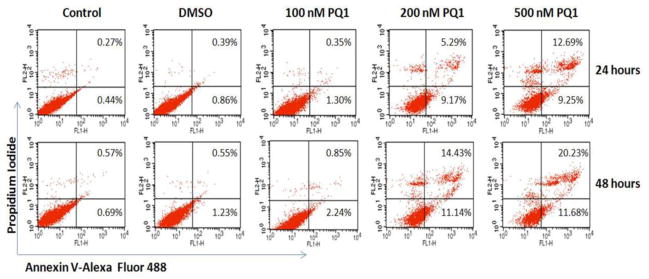
T47D cells were treated with DMSO and various concentrations of PQ1 for 24 and 48 hours. Cells without treatments were used as controls. Apoptotic cells were determined by flow cytometry using an Alexa Fluor 488 Annexin V/Dead Cell Apoptosis Kit. Percentages of apoptotic cells were showed in quadrants of the histogram. The results represent one of three independent experiments.
PQ1 activates caspase-3 in T47D breast cancer cells
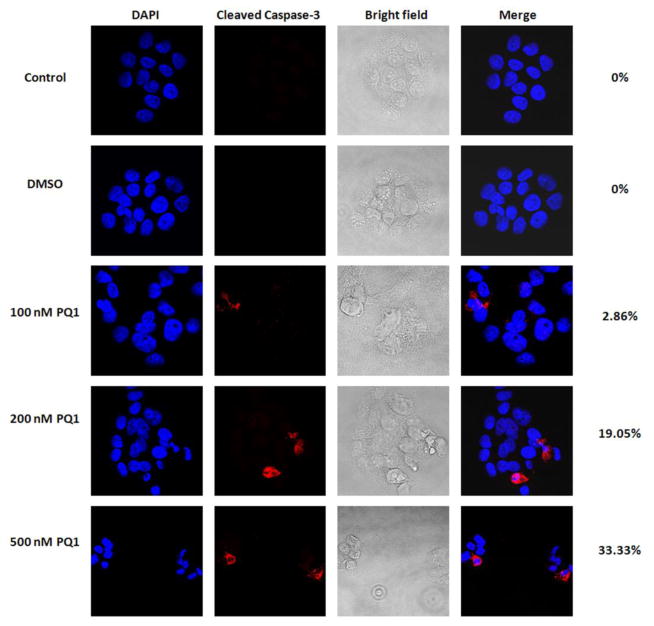
Caspase-3 is an important executioner at the convergence of multiple caspase-dependent apoptotic pathways [15]. Activation of caspase-3 is considered to be the last step of caspase-dependent apoptosis [16, 17]. To evaluate if PQ1 induces caspase-3 activation of apoptotic pathways, expression of active caspase-3 was examined by confocal immunofluorescence microscopy. No detectable staining of cleaved caspase-3 was found in cells without treatment or cells treated with DMSO (Fig. 4). Relative to control, a significant increase of cleaved caspase-3 staining was detected in the treated cells with 200 and 500 nM PQ1 for 48 hours, indicating that 200 and 500 nM PQ1 is sufficient to activate caspase-3 (Fig. 4).
Fig. 4. PQ1 activates caspase-3 in T47D breast cancer cells.
T47D cells were treated with DMSO and various concentrations of PQ1 for 48 hours. Cells without treatments were used as controls. Expression of cleaved caspase-3 was determined by confocal microscopic analysis using immunofluorescence staining. Red indicates cleaved caspase-3 and blue indicates nuclei stained by DAPI. Percentages of cells with positive staining were labeled on the right of images.
PQ1 activates caspase-9 related intrinsic apoptotic pathway
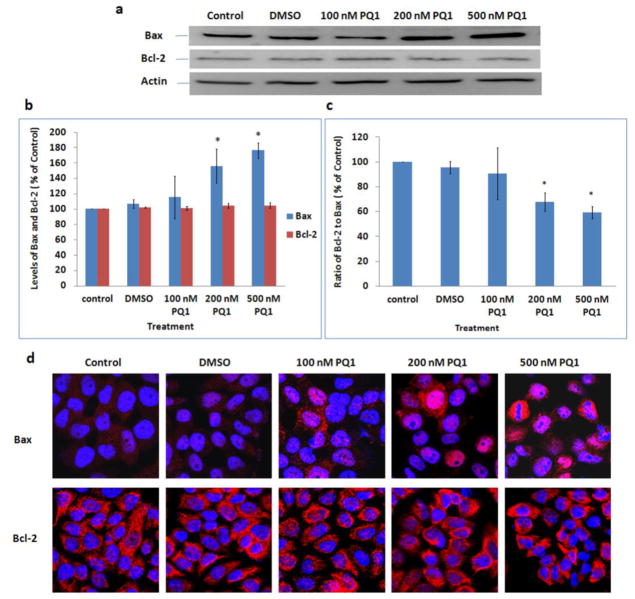
The intrinsic mitochondrial apoptotic pathway is characterized by mitochondrial membrane permeabilization, cytochrome c release, and caspase-9 activation [17]. The anti-apoptotic protein Bcl-2 and pro-apoptotic protein Bax are two important members of the Bcl-2 family involved in the mitochondrial apoptotic pathway. It has been reported that the ratio of Bcl-2 to Bax is crucial to the mitochondrial membrane permeabilization and cytochrome c release [18]. Here, expression levels of Bcl-2, Bax, cytochrome c, and active caspase-9 were studied using both Western blot analysis and confocal microscopy to examine the effect of PQ1 on the activation of intrinsic apoptotic pathway. Western blot results showed a gradual increase in Bax protein with an increase of PQ1; interestingly, there was no change in Bcl-2 level (Fig. 5a, 5b). In contrast to control, 200 and 500 nM of PQ1 significantly increased the level of Bax to 156% and 176%, respectively (Fig. 5b). The results were further confirmed by confocal images. PQ1 increased the Bax staining in a dose-dependent manner as well, but again there was no change in Bcl-2 staining (Fig. 5d). The effects of PQ1 on the levels of Bax and Bcl-2 subsequently resulted in a decrease of Bcl-2-to-Bax protein ratio. 48-hour treatment with 200 and 500 nM PQ1 decreased the ratio of Bcl-2 to Bax by 33% and 40%, respectively (Fig. 5c). These results suggested that PQ1 caused a significant increase of Bax with no change in Bcl-2 expression, leading to a decrease of the Bcl-2/Bax ratio.
Fig. 5. PQ1 increases the level of Bax but has no effects on the level of Bcl-2.
T47D cells were treated with DMSO and various concentrations of PQ1 for 48 hours. Cells without treatments were used as controls. (a) Levels of Bax and Bcl-2 were examined by Western blot analysis. Actin was used as a loading control. (b) Graphical presentation of three independent experiments shows the pixel intensities of Bax and Bcl-2 normalized to the controls. * P-value is <0.05 compared to control. (c) Graphical presentation shows the ratio of Bcl-2 to Bax. Data were obtained in three independent experiments and are represented as the mean ± S.D. * P-value is <0.05 compared to control. (d) Immunofluorescence was performed to examine expression levels of Bax and Bcl-2. Red indicates Bax or Bcl-2 as indicated and blue indicates the nuclei.
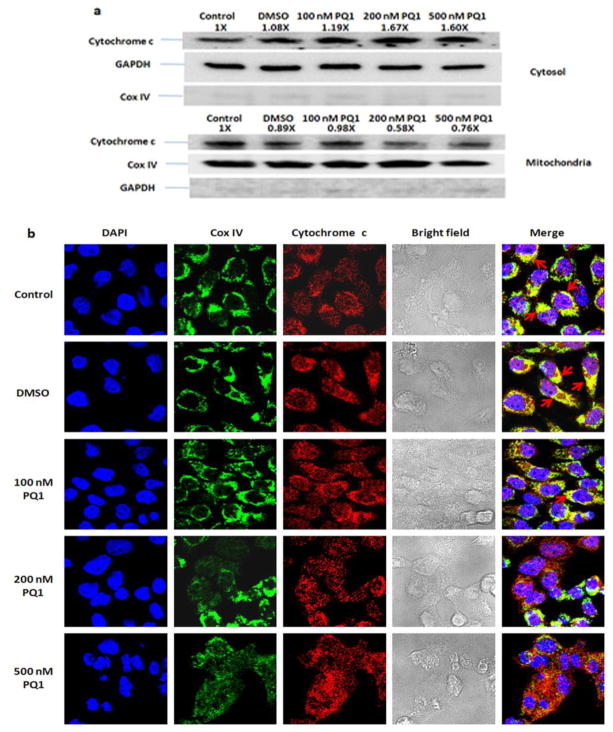
To investigate the cytochrome c release, mitochondrial and cytosolic fractions for cytochrome c were isolated after treatment with PQ1 for 48 hours. Western blot analysis showed a decrease of cytochrome c in the mitochondria fraction and an increase of cytochrome c in the cytosol of the PQ1-treated cells, indicating that PQ1 can trigger the release of cytochrome c from the mitochondria into cytosol (Fig. 6a). Cytochrome c release was also visualized by confocal immunofluorescence microscopy with double-staining of cytochrome c and mitochondrial marker. In the untreated and DMSO-treated cells, a significant colocalization of cytochrome c and mitochondria was observed (Fig. 6b). However, the colocalization signal decreased when cells were treated with 500 nM PQ1 (Fig. 6b). The reduction of cytochrome c in the mitochondria is consistent with the translocation of cytochrome c from the mitochondria to the cytosol.
Fig. 6. PQ1 induces the release of cytochrome c from the mitochondira to the cytosol.
T47D cells were treated with DMSO and various concentrations of PQ1 for 48 hours. Cells without treatments were used as controls. (a) Mitochondria and cytosol were separated by using mitochondria isolation protocol as described in Materials and Methods. Western blot analysis of cytochrome c was performed. GAPDH and Cox IV were used as loading control in the cytosolic and mitochondrial fractions, respectively. Cox IV in the cytosol and GAPDH in the mitochondria were used as negative controls. Pixel intensities of protein bands were normalized to pixel intensities of loading controls. The results represent one of three independent experiments. Numbers above the blot show fold changes in expression of cytochrome c normalized to control. (b) Colocalization of cytochrome c and mitochondria was determined by confocal microscopy. Red indicates cytochrome c, green indicates the mitochondrial marker Cox IV, and blue indicates nuclei stained by DAPI. Colocalization of cytochrome c and mitochondria is shown in yellow color as indicated by arrows.
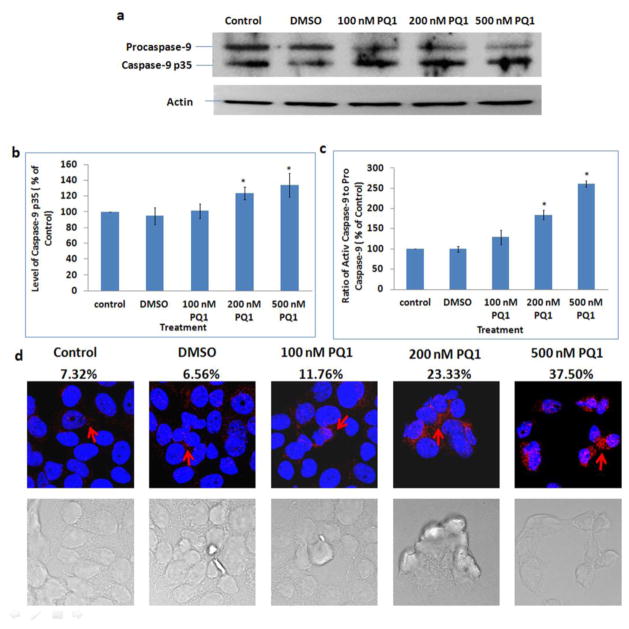
Released cytochrome c is a critical activator of caspase-9 in intrinsic apoptotic pathway. When caspase-9 is activated, the procaspase-9 (approximately 45 kDa) is cleaved into a fragment of caspase-9 p35 (approximately 35 kDa) [19, 20]. Therefore, expression level of caspase-9 p35, the active form of caspase-9, was examined by both Western blot analysis and confocal microscopy using anti-caspase-9 p35 antibodies. Immunoblotting results showed that PQ1 can cause a decrease of procaspase-9 and an increase of caspase-9 p35 (Fig. 7a, 7b). Compared with the control, the level of caspase-9 p35 was increased by 34% in cells treated with 500 nM PQ1 for 48 hours (Fig. 7b). The ratio of active caspase-9 to pro-caspase-9 was increased to 250% after treated with 500 nM PQ1 for 48 hours (Fig. 7c). Confocal images further supported that the increase of active caspase-9 was due to the presence of PQ1 (Fig. 7d). All the results indicate that PQ1 can activate intrinsic apoptotic pathway in T47D cells.
Fig. 7. PQ1 activates caspase-9 in T47D cells.
T47D cells were treated with DMSO and various concentrations of PQ1 for 48 hours. (a) Levels of procaspase-9 and caspase-9 p35 were examined by Western blot analysis using anti-caspase-9 p35 (H-170) antibody which detects the p35 subunit and precursor of caspase-9. Actin was used as a loading control. (b) Graphical presentation of three independent experiments shows the pixel intensities of caspase-9 p35 normalized to the controls. * P-value is <0.05 compared to control. (c) Graphical presentation of three independent experiments shows the ratio of active caspase-9 (caspase-9 p35) to pro-caspase-9. Results are normalized to the control. * P-value is <0.05 compared to control. (d) Immunofluorescence was performed using anti-cleaved caspase-9 (Asp315) antibody, a rabbit polyclonal antibody specific to the 35 kDa large fragment of caspase-9 following cleavage at aspartic acid 315. Red indicates caspase-9 p35 and blue indicates the nuclei. Percentages of cells with positive staining were labeled on top of relative images.
PQ1 activates caspase-8 in T47D cells
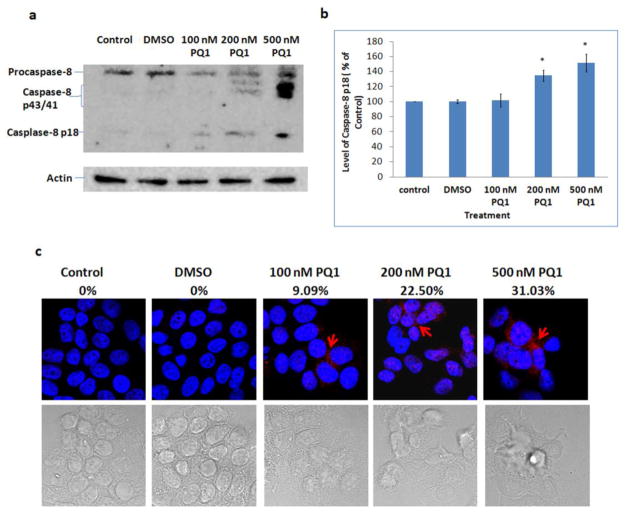
Caspase-8 is a key reporter of extrinsic apoptotic pathway. When extrinsic pathway is initiated, procaspase-8 will be activated and cleaved into active form, leading to the activation of caspase-3 [21]. Thus, the activation of capase-8 was examined by comparing the cleaved caspase-8 in the presence and absence of PQ1. The results showed that 200 and 500 nM PQ1 can significantly cause a cleavage of procaspase-8 (55 kDa) into 43 kDa, 41 kDa, and 18 kDa fragments (Fig. 8a). Quantification analysis of caspase-8 p18 showed that 48-hour treatment with 500 nM PQ1 increased the level of caspase-8 p18 to 152% relative to control (Fig. 8b). The results of immunofluorescent staining confirm that 200 and 500 nM PQ1 can cause an increase of active caspase-8 (Fig. 8c). Overall, the effect of PQ1 mediates not only the activation of caspase-9 but also the activation of caspase-8.
Fig. 8. PQ1 activates caspase-8 in T47D cells.
T47D cells were treated with DMSO and various concentrations of PQ1 for 48 hours. (a) Levels of procaspase-8 and cleaved caspase-8 (caspase-8 p43, p41 and p18) were examined by Western blot analysis using anti-caspase-8 p18 (H-134) antibody, a rabbit polyclonal antibody which detects cleaved subunits and precursor of caspase-8. Actin was used as a loading control. (b) Graphical presentation of three independent experiments shows the pixel intensities of caspase-8 p18 normalized to the controls. * P-value is <0.05 compared to the control. (c) Immunofluorescence was performed using anti-cleaved caaspase-8 (Asp391) antibody, a rabbit monoclonal antibody which detects p18 subunit after cleavage at Asp391 of human caspase-8. Red indicates caspase-8 p18 and blue indicates the nuclei. Percentages of cells with positive staining were labeled on top of relative images.
Cytotoxicity of PQ1 is counteracted by caspase inhibitors
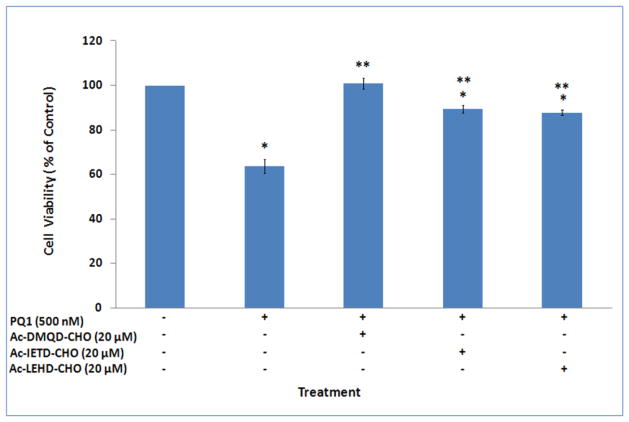
To examine if activation of caspases is necessary for PQ1 cytotoxicity, T47D cells were pre-treated with 20 μM inhibitor of caspase-3/-8/-9 for 1 hour, and then treated with 500 nM PQ1 for 23 hours. Cell viability results showed that the cytotoxicity of PQ1 was completely inhibited by the pre-treatment of Ac-DMQD-CHO, a caspase-3 inhibitor (Fig. 9). The pre-treatment of Ac-IETD-CHO, a caspase-8 inhibitor, and Ac-LEHD-CHO, a caspase-9 inhibitor, partially inhibited the cytotoxicity of PQ1 (Fig. 9). Compared with 500nM PQ1 treatment, pre-treatment of Ac-IETD-CHO and Ac-LEHD-CHO increased the cell viability from 64% to 87% and 84%, respectively. The effects of caspase inhibitors indicate that the cytotoxicity of PQ1 is related to the activation of caspase cascade.
Fig. 9. Effects of caspase inhibitors on the cytotoxicity of PQ1.
T47D cells were pre-treated with 20 μM caspase-3 inhibitor (Ac-DMQD-CHO), caspase-8 inhibitor (Ac-IETD-CHO), or caspase-9 inhibitor (Ac-LEHD-CHO) for 1 hour, and exposed to 500 nM PQ1 for 23 hours. Cells without treatments and cells treated with 500 nM PQ1 for 24 hours were used as controls. Cell viability was determined by trypan blue method. Data were obtained in three independent experiments and are represented as the mean ± S.D. * P-value is <0.05 compared to control. **P-value is <0.05 compared to treatment with 500 nM PQ1 for 24 hours.
Discussion
Cancer is a complex disease with multiple deregulated signaling pathways, including apoptosis. Targeting apoptotic pathways has emerged as an attractive approach for cancer treatment. So far, numerous quinoline derivatives, both in natural and synthetic products, have been reported to possess anticancer activities through induction of different pathways of apoptosis [1]. By investigating the effect of quinoline anti-malarials on MCF-7 breast cancer cells, Zhou et al. reported that quinidine, a natural alkaloid, and chloroquine, a synthetic alkaloid, trigger apoptosis via a p53-dependent pathway [22]. Studies of another quinoline derivative, QBS (2-amino-N-quinoline-8-yl-benzenesulfonamide), revealed that QBS induces apoptosis in Jurkat cells via a caspase-dependent pathway [23]. The quinoline ring by itself showed no evidence of apoptosis induction [22], indicating that this activity is conferred by addition of the side chain substituents. The properties of side chains and the steric structures of the derivatives may be related to apoptotic pathways selection. In this report, effect of PQ1, 6-methoxy-8-[(3-aminopropyl)amino]-4-methyl-5-(3-trifluoromethylphenyloxy)quinoline, on apoptosis was examined in T47D breast cancer cells. The results showed that PQ1 induces apoptosis by initiating caspase cascade. It is not clear that which specific substituent of PQ1 is responsible for the activation of apoptosis. More studies are needed to establish the relationship between structure and function.
The present study demonstrated that 200 and 500 nM PQ1 for 48 hours significantly increased the population of apoptotic cells (Fig. 3) and activated caspase-3, -9 and -8 (Fig. 4, 7 and 8), indicating that the effective concentrations of PQ1 in apoptosis induction fall in the nM range. Caspases are a group of ICE (interleukin 1 β-converting enzyme)-like proteases that play a crucial role in apoptosis mediation [24]. Currently, 14 caspases have been identified in humans [25, 26], and among them caspase-3 is frequently activated and serves as the executioner. Activation of caspase-3 by cleavage of procaspase-3 is considered to be a hallmark of apoptosis [27]. By examining the expression of cleaved caspase-3 after PQ1 treatment, we provide evidence that PQ1 can induce the activation of caspase-3. Caspase-3 is activated both by extrinsic and intrinsic pathways via interacting with two initiator caspases, caspase-8 and caspase-9 [28]. In intrinsic pathway, activation of caspase-9 is regulated by cytochrome c and two members of Bcl-2 family, Bax and Bcl-2. The pro-apoptotic factor Bax has been reported to form heterodimers with the anti-apoptotic factor Bcl-2, which consequently induce cytochrome c release and accelerate apoptosis [29]. Overexpressed Bax counteracts the activity of Bcl-2 [29]. However, this view has been questioned due to the fact that the dimeric interaction of Bax and Bcl-2 can only be detected in the presence of nonionic detergents, such as Triton X-100 and Nonidet P-40 [30]. Furthermore, Knudson and Korsmeyer reported that although there is an in vivo competition between Bax and Bcl-2, they are able to regulate apoptosis independently [31]. Consistent with this report, our results showed that PQ1 can cause an increase in Bax without any changes in Bcl-2, indicating that PQ1 can activate intrinsic apoptotic pathway through Bax-dependent but Bcl-2 independent mechanisms. Activation of caspase-8 is a crucial step in extrinsic apoptotic pathway. 200 and 500 nM PQ1 can cause a cleavage of procaspase-8 into active caspase-8 fragments, suggesting that PQ1 can also mediate the activation of extrinsic pathway reporter. However, the cleaved caspase-8 can activate caspase-3 through two alternative signaling pathways [32, 33]. One pathway is through the activation of caspase-3 directly. Another pathway is through the cleavage of BID, a Bcl-2 interacting protein, and the truncation of BID (tBID) to translocate to the mitochondria where tBID induces mitochondrial damage and releases cytochrome c. The released cytochrome c activates caspase-9 and sequentially activates caspase-3. It is not clear which downstream pathway is dominant in caspase-8 mediated apoptotic pathway. Further studies are needed to elucidate the downstream events after caspase-8 activation.
In conclusion, this study showed that the quinoline derivative, PQ1, exerts its anti-cancer effects in T47D breast cancer cells through the induction of both caspase-8 and caspase-9 mediated pathways of apoptosis. PQ1 can significantly increase bax, cause the release of cytochrome c, activate caspase-9 and caspase-8, and subsequently induce caspase-3-mediated apoptosis.
Acknowledgments
We gratefully acknowledge the financial support from the National Institute of Health, P20RR016475 and R15CA152922.
Footnotes
Conflict of Interest
The authors declare that they have no conflict of interest.
References
- 1.Solomon VR, Lee H. Quinoline as a privileged scaffold in cancer drug discovery. Curr Med Chem. 2011;18:1488–1508. doi: 10.2174/092986711795328382. [DOI] [PubMed] [Google Scholar]
- 2.Ganguly A, Banerjee K, Chakraborty P, et al. Overcoming multidrug resistance (MDR) in cancer in vitro and in vivo by a quinoline derivative. Biomed Pharmacother. 2011;65:387–394. doi: 10.1016/j.biopha.2011.04.024. [DOI] [PubMed] [Google Scholar]
- 3.Tseng CH, Tzeng CC, Chung KY, et al. Synthesis and antiproliferative evaluation of 6-aryl-11-iminoindeno[1,2-c]quinoline derivatives. Bioorg Med Chem. 2011;19:7653–7663. doi: 10.1016/j.bmc.2011.10.014. [DOI] [PubMed] [Google Scholar]
- 4.Sharma S, Panjamurthy K, Choudhary B, et al. A novel DNA intercalator, 8-methoxy pyrimido[4′,5′:4,5]thieno (2,3-b)quinoline-4(3H)-one induces apoptosis in cancer cells, inhibits the tumor progression and enhances lifespan in mice with tumor. Mol Carcinog. 2011 doi: 10.1002/mc.21867. [DOI] [PubMed] [Google Scholar]
- 5.Collins MK, Lopez Rivas A. The control of apoptosis in mammalian cells. Trends Biochem Sci. 1993;18:307–309. doi: 10.1016/0968-0004(93)90042-l. [DOI] [PubMed] [Google Scholar]
- 6.Franceschi C. Cell proliferation, cell death and aging. Aging (Milano) 1989;1:3–15. doi: 10.1007/BF03323871. [DOI] [PubMed] [Google Scholar]
- 7.Wyllie AH. Apoptosis and the regulation of cell numbers in normal and neoplastic tissues: an overview. Cancer Metastasis Rev. 1992;11:95–103. doi: 10.1007/BF00048057. [DOI] [PubMed] [Google Scholar]
- 8.Chabner BA. Biological basis for cancer treatment. Ann Intern Med. 1993;118:633–637. doi: 10.7326/0003-4819-118-8-199304150-00011. [DOI] [PubMed] [Google Scholar]
- 9.Kemnitzer W, Kuemmerle J, Jiang S, et al. Discovery of 1-benzoyl-3-cyanopyrrolo[1,2-a]quinolines as a new series of apoptosis inducers using a cell- and caspase-based high-throughput screening assay. Part 1: Structure-activity relationships of the 1- and 3-positions. Bioorg Med Chem Lett. 2008;18:6259–6264. doi: 10.1016/j.bmcl.2008.09.110. [DOI] [PubMed] [Google Scholar]
- 10.Elmore S. Apoptosis: a review of programmed cell death. Toxicol Pathol. 2007;35:495–516. doi: 10.1080/01926230701320337. [DOI] [PMC free article] [PubMed] [Google Scholar]
- 11.Zimmermann KC, Green DR. How cells die: apoptosis pathways. J Allergy Clin Immunol. 2001;108:S99–103. doi: 10.1067/mai.2001.117819. [DOI] [PubMed] [Google Scholar]
- 12.Kruidering M, Evan GI. Caspase-8 in apoptosis: the beginning of “the end”? IUBMB Life. 2000;50:85–90. doi: 10.1080/713803693. [DOI] [PubMed] [Google Scholar]
- 13.Gakhar G, Ohira T, Shi A, Hua DH, Nguyen TA. Antitumor effect of substituted quinolines in breast cancer cells. Drug Dev Res. 2008;69:526–534. [Google Scholar]
- 14.Shi A, Nguyen TA, Battina SK, et al. Synthesis and anti-breast cancer activities of substituted quinolines. Bioorg Med Chem Lett. 2008;18:3364–3368. doi: 10.1016/j.bmcl.2008.04.024. [DOI] [PMC free article] [PubMed] [Google Scholar]
- 15.Cryns V, Yuan J. Proteases to die for. Genes Dev. 1998;12:1551–1570. doi: 10.1101/gad.12.11.1551. [DOI] [PubMed] [Google Scholar]
- 16.Cohen GM. Caspases: the executioners of apoptosis. Biochem J. 1997;326 (Pt 1):1–16. doi: 10.1042/bj3260001. [DOI] [PMC free article] [PubMed] [Google Scholar]
- 17.Hengartner MO. The biochemistry of apoptosis. Nature. 2000;407:770–776. doi: 10.1038/35037710. [DOI] [PubMed] [Google Scholar]
- 18.Fisher DE. Apoptosis in cancer therapy: crossing the threshold. Cell. 1994;78:539–542. doi: 10.1016/0092-8674(94)90518-5. [DOI] [PubMed] [Google Scholar]
- 19.Li P, Nijhawan D, Budihardjo I, et al. Cytochrome c and dATP-dependent formation of Apaf-1/caspase-9 complex initiates an apoptotic protease cascade. Cell. 1997;91:479–489. doi: 10.1016/s0092-8674(00)80434-1. [DOI] [PubMed] [Google Scholar]
- 20.Zhivotovsky B, Samali A, Gahm A, Orrenius S. Caspases: their intracellular localization and translocation during apoptosis. Cell Death Differ. 1999;6:644–651. doi: 10.1038/sj.cdd.4400536. [DOI] [PubMed] [Google Scholar]
- 21.Budihardjo I, Oliver H, Lutter M, Luo X, Wang X. Biochemical pathways of caspase activation during apoptosis. Annu Rev Cell Dev Biol. 1999;15:269–290. doi: 10.1146/annurev.cellbio.15.1.269. [DOI] [PubMed] [Google Scholar]
- 22.Zhou Q, McCracken MA, Strobl JS. Control of mammary tumor cell growth in vitro by novel cell differentiation and apoptosis agents. Breast Cancer Res Treat. 2002;75:107–117. doi: 10.1023/a:1019698807564. [DOI] [PubMed] [Google Scholar]
- 23.Kim YH, Shin KJ, Lee TG, et al. G2 arrest and apoptosis by 2-amino-N-quinoline-8-yl-benzenesulfonamide (QBS), a novel cytotoxic compound. Biochem Pharmacol. 2005;69:1333–1341. doi: 10.1016/j.bcp.2004.12.019. [DOI] [PubMed] [Google Scholar]
- 24.Alnemri ES, Livingston DJ, Nicholson DW, et al. Human ICE/CED-3 protease nomenclature. Cell. 1996;87:171. doi: 10.1016/s0092-8674(00)81334-3. [DOI] [PubMed] [Google Scholar]
- 25.Thornberry NA, Lazebnik Y. Caspases: enemies within. Science. 1998;281:1312–1316. doi: 10.1126/science.281.5381.1312. [DOI] [PubMed] [Google Scholar]
- 26.Van de Craen M, Van Loo G, Pype S, et al. Identification of a new caspase homologue: caspase-14. Cell Death Differ. 1998;5:838–846. doi: 10.1038/sj.cdd.4400444. [DOI] [PubMed] [Google Scholar]
- 27.Porter AG, Janicke RU. Emerging roles of caspase-3 in apoptosis. Cell Death Differ. 1999;6:99–104. doi: 10.1038/sj.cdd.4400476. [DOI] [PubMed] [Google Scholar]
- 28.Salvesen GS. Caspases: opening the boxes and interpreting the arrows. Cell Death Differ. 2002;9:3–5. doi: 10.1038/sj.cdd.4400963. [DOI] [PubMed] [Google Scholar]
- 29.Oltvai ZN, Milliman CL, Korsmeyer SJ. Bcl-2 heterodimerizes in vivo with a conserved homolog, Bax, that accelerates programmed cell death. Cell. 1993;74:609–619. doi: 10.1016/0092-8674(93)90509-o. [DOI] [PubMed] [Google Scholar]
- 30.Hsu YT, Youle RJ. Nonionic detergents induce dimerization among members of the Bcl-2 family. J Biol Chem. 1997;272:13829–13834. doi: 10.1074/jbc.272.21.13829. [DOI] [PubMed] [Google Scholar]
- 31.Knudson CM, Korsmeyer SJ. Bcl-2 and Bax function independently to regulate cell death. Nat Genet. 1997;16:358–363. doi: 10.1038/ng0897-358. [DOI] [PubMed] [Google Scholar]
- 32.Scaffidi C, Fulda S, Srinivasan A, et al. Two CD95 (APO-1/Fas) signaling pathways. Embo J. 1998;17:1675–1687. doi: 10.1093/emboj/17.6.1675. [DOI] [PMC free article] [PubMed] [Google Scholar]
- 33.Li H, Zhu H, Xu CJ, Yuan J. Cleavage of BID by caspase 8 mediates the mitochondrial damage in the Fas pathway of apoptosis. Cell. 1998;94:491–501. doi: 10.1016/s0092-8674(00)81590-1. [DOI] [PubMed] [Google Scholar]


