Abstract
BACKGROUND
Esophagogastric junction (EGJ) competence is the fundamental defense against reflux making it of great clinical significance. However, characterizing EGJ competence with conventional manometric methodologies has been confounded by its anatomic and physiological complexity. Recent technological advances in miniaturization and electronics have led to the development of a novel device that may overcome these challenges.
METHODS
Nine volunteer subjects were studied with a novel 3D-HRM device providing 7.5 mm axial and 45° radial pressure resolution within the EGJ. Real-time measurements were made at rest and compared to simulations of a conventional pull-through made with the same device. Moreover, 3D-HRM recordings were analyzed to differentiate contributing pressure signals within the EGJ attributable to lower esophageal sphincter (LES), diaphragm, and vasculature.
RESULTS
3D-HRM recordings suggested that sphincter length assessed by a pull-through method greatly exaggerated the estimate of LES length by failing to discriminate among circumferential contractile pressure and asymmetric extrinsic pressure signals attributable to diaphragmatic and vascular structures. Real-time 3D EGJ recordings found that the dominant constituents of EGJ pressure at rest were attributable to the diaphragm.
CONCLUSIONS
3D-HRM permits real-time recording of EGJ pressure morphology facilitating analysis of the EGJ constituents responsible for its function as a reflux barrier making it a promising tool in the study of GERD pathophysiology. The enhanced axial and radial recording resolution of the device should facilitate further studies to explore perturbations in the physiological constituents of EGJ pressure in health and disease.
INTRODUCTION
Over the years, a variety of manometric methodologies and metrics have been proposed to quantify esophagogastric junction (EGJ) characteristics as a reflection of its competence against reflux (1). A station pull-through protocol has been used as the standard to determine the length of the EGJ high pressure zone (HPZ) and to localize the respiratory inversion point (RIP), defined as the location at which inspiratory pressure deflections changed from positive (abdomen) to negative (chest) (2). Surgeons have utilized the position of the RIP in relation to the HPZ to determine the intra-abdominal component of the EGJ as a predictor of fundoplication efficacy (3). However, the significance of HPZ length and intra-abdominal length have not gained wide acceptance in the gastroenterology community as evident in a recent AGAI Position Statement concluding that ‘The current role of manometry in gastroesophageal reflux disease (GERD) is to exclude motor disorders as a cause of the continued symptoms’ (4). In essence, it was concluded that the quantitative assessment of EGJ pressure morphology achieved with conventional manometry lacked sufficient validation to be useful in clinical management. Indeed, the anatomy in the area of the EGJ is complex and intraluminal manometry recordings detect pressure signals referable both to intrinsic esophageal structures and to adjacent extrinsic structures impinging on the esophagus. Both have distinct sphincteric mechanisms within the EGJ (5). The dominant pressure signals detected near the EGJ are attributable to the lower esophageal sphincter (LES), the crural diaphragm, the lower thoracic aorta and the heart. However, the specific pressure contributions of each are debated.
Recently, a 3D-high resolution manometry (3D-HRM) assembly (Given Imaging, Duluth, GA) has been developed with the potential to greatly simplify the assessment of EGJ pressure morphology (3,6). The 3D segment of the array permits high resolution recording both axially and radially while maintaining a stationary sensor position. Consequently, 3D-HRM should allow for the measurement of EGJ parameters that were only possible with pull-through maneuvers in the past and these measurements can be made in real time permitting analysis of the respiratory and vascular effects. Moreover, data extracted from the 3D-HRM recording may allow differentiating pressure signals within the EGJ attributable to the intrinsic sphincter and to the surrounding elements. Hence, the aims of this study were to compare measures of EGJ pressure morphology made with real time 3D-HRM to measures made simulating a conventional pull-through protocol and to define the pressure signatures of the diaphragmatic and LES pressure components within the 3D-HRM recording.
METHODS
Subjects
Nine volunteers were recruited for this study. None of them had a history of prior gastrointestinal surgery, significant medical disease, or current use of medications for upper gastrointestinal symptoms. All subjects underwent a brief interview and examination and gave written informed consent. Dysphagia was assessed using the Impaction Dysphagia Questionnaire (IDQ, maximal score: 50; 95th percentile cutoff in controls: 2). Reflux symptoms were measured using the GerdQ (scale 0–18; positive for GERD if score ≥7) (7). The study protocol was approved by the Northwestern University Institutional Review Board.
Manometric assembly
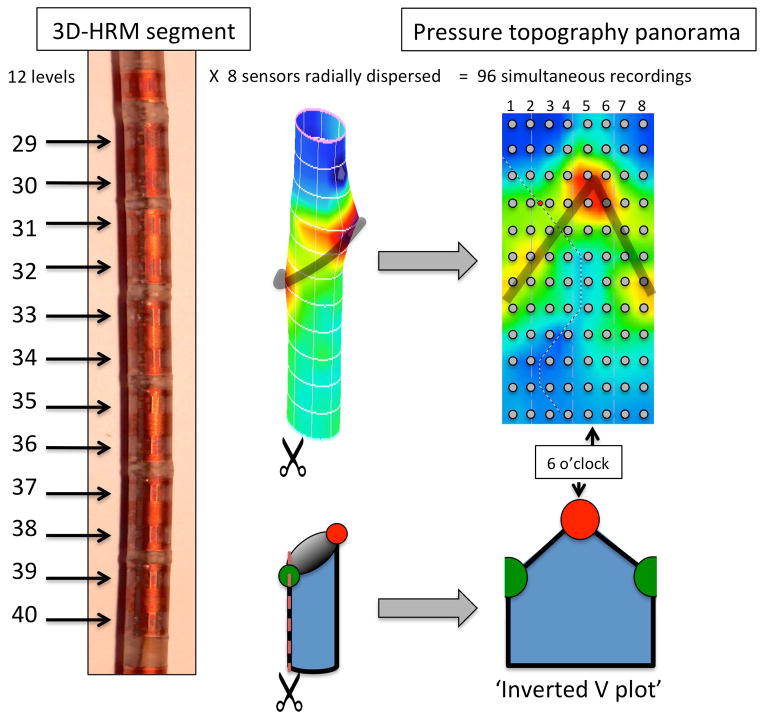
The 3D-HRM assembly (ManoScan 3D, Given Imaging, Duluth, GA) was a 128-channel solid-state device incorporating a 9.0 cm 3D-HRM segment into an otherwise standard HRM array. The 4.2 mm outer diameter assembly had the 3D-HRM segment positioned between 28 proximal and 4 distal standard sensing elements that were spaced 1 cm apart (6). Each standard sensor averaged the pressure signals from the 12 radially dispersed sensors into a single circumferential pressure value. The 3D segment was comprised of 12 rings of 8 radially dispersed independent pressure sensors with the rings spaced 7.5 mm apart. The individual 3D sensing elements were 2.5 mm long and separated from the adjacent element by 5 mm. Consequently, the 9 cm 3D segment provided 96 independent pressure recordings with a radial resolution of 45° and an axial resolution of 7.5 mm (Figure 1). The data acquisition frequency was 100 Hz.
Figure 1.
Schematic depiction of the 3D-HRM segment with representation of the 96 sensors distributed in 12 levels of 8 radially dispersed sensors each. The resulting image is a cylinder, which can be ‘opened’ to obtain a pressure topography panorama of the segment in the format of an inverted V plot. The grey dots indicate positions of individual pressure sensors. The orientation of the assembly relative to the EGJ was not controlled; hence, by convention the apical diaphragmatic signal is defined as 6 o’clock. The shaded ‘V’ on the topography plot indicates the disposition of the split diaphragm signal (red and green circles below).
Prior to recording, the manometric assembly was calibrated at zero and 300 mmHg using the manufacturer’s calibration chamber. The individual elements within the 3D array had a specified accuracy of ±1 mmHg for the pressure range of 0–50 mmHg and ± 1.5 mmHg in the 50–100 mmHg range. Accuracy was confirmed using the manufacturer’s pressure chamber but applying pressure with a sphygmomanometer from 10 to 150 mmHg in increments of 10 mmHg (3,8). All pressure measurements were referenced to atmospheric pressure.
Manometry protocol
Studies were performed in the supine position after a 6-hour fast. The assembly was passed transnasally and positioned with the 3D-HRM segment straddling the EGJ. After a period of accommodation, five minutes of baseline recording was obtained during which the subjects were asked to breathe normally. A standard 10 water swallow protocol was obtained to verify that the subjects had normal motility according to the Chicago Classification (9).
The assembly was then repositioned with the 3D segment in the stomach and a station pull-through was obtained withdrawing the assembly at 5 mm increments with each station held for at least 30 seconds. The pull-through was done maintaining normal respiration, with the patient asked to minimize swallowing. The pull-through was continued until the 3D array had traversed the EGJ and the distance to the nares was recorded for each station.
Data analysis
Data were analyzed after thermal compensation using Manoview software (version 3.0, Given Imaging, Duluth, GA). Analysis subroutines were written to compare calculations of high pressure zone length, and the localization of respiratory inversion made with real-time 3D-HRM to the same measures made using simulations of conventional manometry from the pull through protocol.
Four radially dispersed sensors within the 3D-HRM array (3, 6, 9, and 12 o’clock) were utilized for the simulation of conventional manometry during the station pull-through protocol. For each sensor, the upper and lower margins of the HPZ were defined by a 2 mmHg pressure increase relative to gastric pressure. The four length values were averaged to calculate the mean ‘LES length’, as described using conventional manometry, and a composite value was calculated as the extreme value of HPZ length. Respiratory inversion was defined as the axial position along the EGJ at which the positive pressure deflections associated with inspiration recorded in the abdomen change to negative deflections recorded in the chest. Pull-through data from the same four single sensors as for the determination of ‘LES length‘ were used and the respiratory inversion point was reported as the average of the four values.
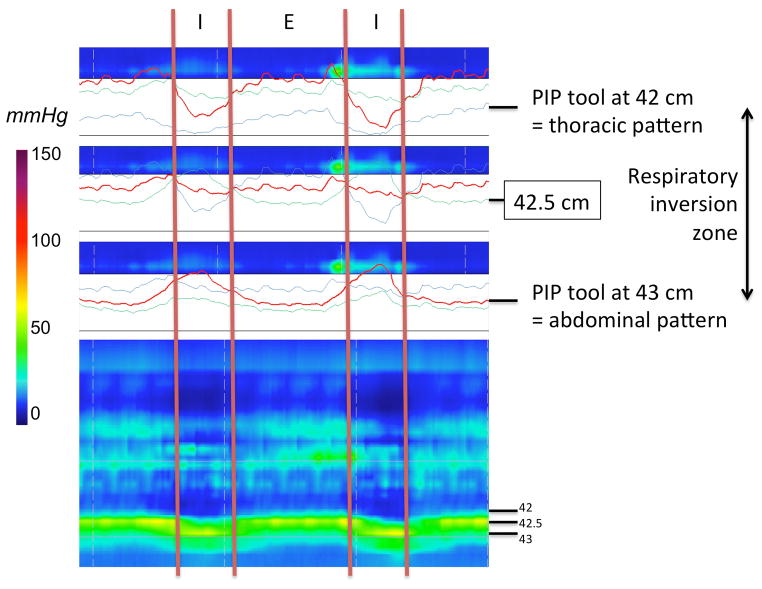
For the real-time 3D-HRM definition of the HPZ, we determined the length characterized by a 360° circumferential pressure increase of at least 2 mmHg relative to gastric pressure as the proximal and distal limits (6). Measurements of sphincter length were made at rest and in the 5-second post-deglutitive period to capture the LES after-contraction. The magnitude of sphincter pressure was also measured at each time as the ‘maximum of the minimums’ using the e-sleeve tool (8). Respiratory inversion was analyzed using the Manoview pressure inversion point tool (‘PIP tool’). Using the ‘PIP tool’, the tracing progressively changed from a thoracic pattern to an abdominal pattern (Figure 2). Hence, respiratory inversion was also reported as the ‘inversion zone’ spanning the distance between these endpoints.
Figure 2.
Characteristics of the RIP, using the 3D-HRM assembly. Determination of the respiratory inversion zone using the ‘PIP tool’ of the Manoview software (‘diamond shape’ at 42.5 cm). The transition from a clearly thoracic pattern with inspiratory pressure decrement at 42 cm to a clearly abdominal pattern at 43 cm with a clear inspiratory augmentation occurred gradually, centered at 42.5 cm. In this example, the overall length of the zone was 0.9 cm, otherwise varying between 0.7 and 1.0 in the subject group as a whole.
Statistical Analysis
Results between manometric methods were compared using the Kruskal-Wallis test for independent variables, and the Wilcoxon test for the dependent variables. Data were summarized as median (25th–75th percentile), unless stated otherwise. A p<0.05 was considered significant.
RESULTS
Subjects
Nine subjects (5F, ages [26, 49]) were recruited for the study. All had normal IDQ and GerdQ scores. All subjects successfully completed the intended protocol. One subject was suspected of having a hiatal hernia based on the HRM recording; this was subsequently confirmed by endoscopy. This volunteer was excluded from the determinations of HPZ length and respiratory inversion.
3D-HRM EGJ pressure morphology
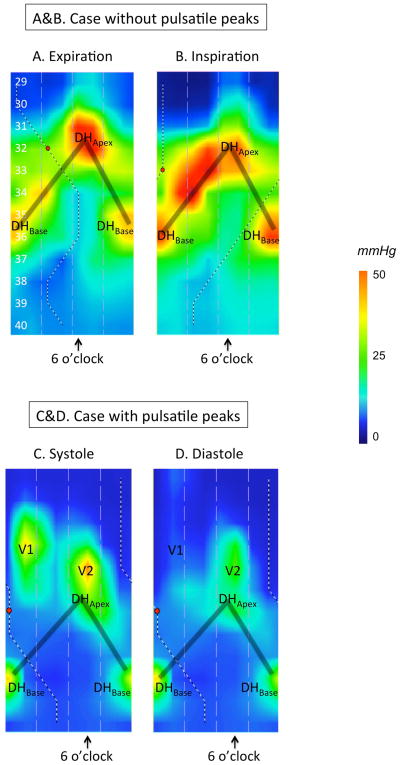
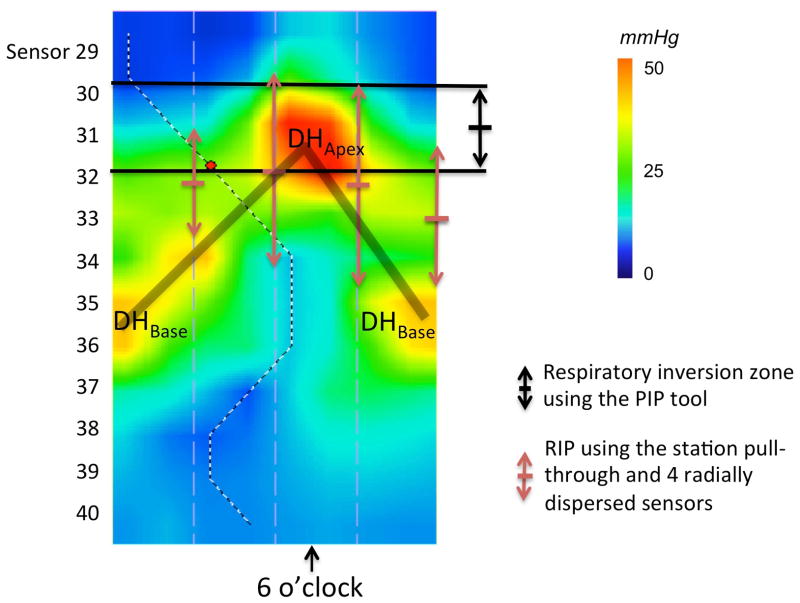
An immediate observation of 3D-HRM recordings was of their dynamic nature, varying with respiration, vascular pulsations, and swallowing. The dominant pressure peak, labeled DHApex was precisely synchronized with inspiration as evidenced by its synchrony with the occurrence of negative intrathoracic pressure (Figure 3A & 3B). In keeping with the convention established by Kwiatek, et al. (6), DHApex (referred to as the crural diaphragm signal by Kwiatek) was assigned the 6 o’clock orientation in the panoramic depiction of EGJ pressure morphology created by unfolding the cylindrical pressure representation. Radially opposing DHApex (12 o’clock), split in half on the inverted V plots and located 2.7 cm [2.2–3.4] distal to DHApex was a second prominent pressure peak (DHBase) that varied during respiration. Thus, the pressure signature of the diaphragmatic hiatus was found to behighly radially asymmetrical and oblique with respect to the axis of the esophagus.
Figure 3.
Representative examples of 3D-HRM still images at expiration (A) and inspiration (B), illustrating the discrete pressure peaks within the EGJ. Figures 3C & 3D illustrate the case of a different subject with pulsatile peaks. The shaded ‘V’ on the topography plots indicates the disposition of the split diaphragm signal. See text for details of peaks DHApex, DHBase, V1, and V2.
Two additional pulsatile pressure peaks were variably present (both evident in Figures 3C & 3D); both were situated in the thoracic part of the pressure topography panorama, proximal to the DHApex peak. One was situated at ‘6 o’clock’ (labeled ‘V1’ in Figures 3C & 3D) and the other one was positioned at ‘12 o’clock’ (labeled ‘V2’ in Figures 3C & 3D). The ‘V1’ peak, appearing during expiration and diminishing with inspiration, was located just above DHApex, whereas the ‘V2’ peak was positioned on the opposite side. These two pulsatile signals likely represent a cardiac signal and the lower thoracic aorta respectively.
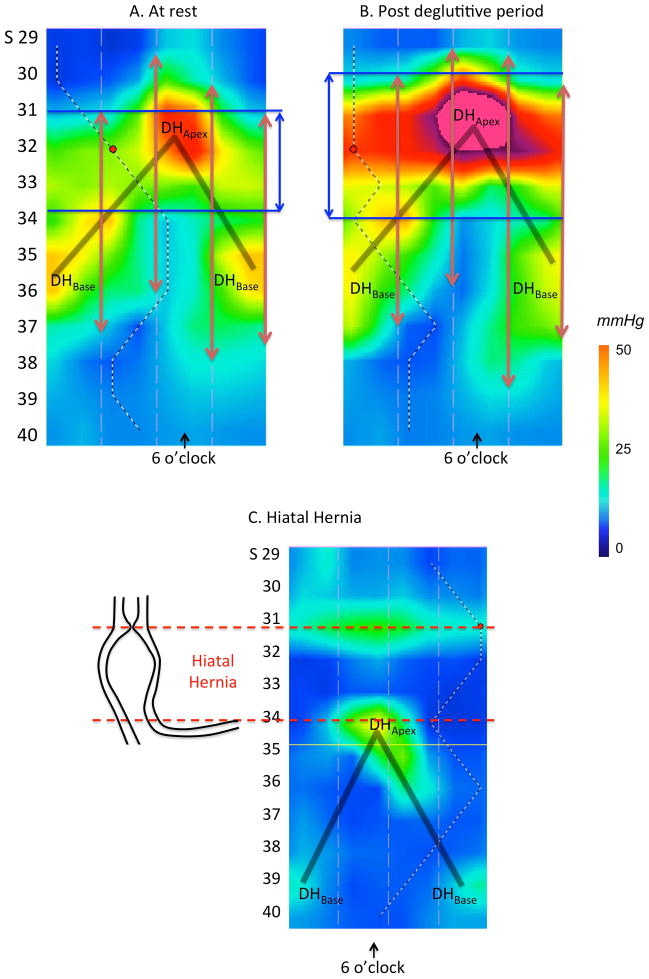
Although the pressure attributable to the intrinsic LES would not be expected to vary substantially in synchrony with either respiratory or vascular pulsations, it was strongly influenced by deglutition, exhibiting both deglutitive relaxation and a profound post-deglutitive contraction (10,11). We utilized the post-deglutitive contraction to verify the pressure signature of the LES in the 3D-HRM recording (Figures 4A & 4B). In sharp distinction to the oblique orientation of the diaphragm signal, the intrinsic LES had a horizontal configuration. We also utilized the ninth volunteer (with the hiatal hernia) to confirm this interpretation of DHApex and DHBase (Figure 4C). The same circumferential horizontal contraction was noted in this individual, located in the thorax above DHApex, with the inverted-V plot still present distally.
Figure 4.
3D-HRM of the EGJ at rest (Panel A) and in the post-deglutitive period (Panel B). At rest, the inverted V plot reveals the crural diaphragm (DHApex and DHBase) to be the dominant pressure signals while in the post-deglutitive period, the intrinsic LES exhibits a prominent after-contraction, which, in contrast to the crural diaphragm, is circumferential. The vertical red arrows represent the high-pressure zone as determined during station pull-through using sensors radially dispersed at the 3, 6, 9 and 12 o’clock radians and the blue vertical arrows represent the locus of 3D circumferential LES length. Panel C represents the case of a hiatal hernia as seen in 3D-HRM as a confirmation of our findings in normal volunteers. The shaded ‘V’ on the topography plots indicates the disposition of the split diaphragm signal.
High-pressure zone length
The various measures of HPZ length are summarized in Table 1. Using simulations of conventional manometry, ‘LES length’ at 3, 6, 9 and 12 o’clock were different, but equally interesting the borders were different (Figures 4A & 4B), such that the composite length of the HPZ measured 8 cm [7.3–10.6 cm], more than twice the average length of each radially oriented ‘LES length’, calculated as 3.4 cm [3.0–3.8 cm]. On the other hand, the 3D-HRM region with circumferential horizontal pressure (LES length) was relatively short: 2.3 cm [2.2–2.6] at expiration (Table 1) with no significant difference between inspiration and expiration. The length and magnitude of LES pressure were maximized during the post-deglutitive period (Figures 4A & 4B) at which time it was significantly longer 3.7 cm [3.0–4.2] and stronger 91 mmHg [75–102] (p<0.05) than prior to the swallow (2.3 cm [2.2–2.6], 18.3 mmHg [15.0–19.0]).
Table 1.
Localization and length of the HPZ defined by station pull-through and 3D-HRM at expiration.
| ‘LES length’ Station Pull-through | LES length 3D-HRM | |||||||
|---|---|---|---|---|---|---|---|---|
| 3 o’clock | 6 o’clock | 9 o’clock | 12 o’clock | Average | Composite | Expiration | Inspiration | |
| Upper border (cm) | 38.3 [37–42.9] | 36.3 [33.6–38.1] | 40.3 [38.6–43] | 40.5 [38.9–43.9] | 38.8 [37.4–41.9] | 36.3 [33.6–38.1]* | 42.6 [41.3–45.8] | 43.3 [41.5–47.1] |
| Lower border (cm) | 41.3 [40.8–45.5] | 39.8 [38.1–42.1] | 44.5 [41.9–46.6] | 44.5 [42.1–46.5] | 42.2 [41.5–45.3] | 44.5 [43.8–46.6]* | 44.8 [43.6–47.7] | 45.3 [44.8–49.6] |
| LES length (cm) | 3.0 [2.5–4] | 4.0 [3–4.3] | 3.5 [2.5–4.2] | 3.0 [2.6–5.2] | 3.4 [3–3.8] | 8.0 [7.3–10.6]* | 2.3 [2.2–2.6]* | 2.2 [2.1–2.7]* |
Different from mean pull-through value (3, 6, 9, and 12 o’clock not tested individually)
Thus, ‘LES length’ calculated using the simulation of the pull-through protocol was a composite of overlapping LES, diaphragmatic, and vascular pressure signals that were individually discernible in 3D-HRM by their respiratory variation, vascular pulsation, and radial orientation.
Respiratory inversion
Figure 5 illustrates representative data on the localization of the respiratory inversion zone determined by 3D-HRM and pull-through methodology. The respiratory inversion zone determined with the ‘PIP tool’ in 3D-HRM was located almost precisely at the DHApex pressure peak and the inversion zone averaged 0.9 cm [0.7–1.0] in length. There was no statistical difference between localization of the center of the respiratory inversion zone, determined in 3D-HRM (42.4 cm [40.5–45.5]) or by pull-through methodology (43.5 cm [40.3–45.5]).
Figure 5.
Representative 3D-HRM image illustrating the 3D-HRM localization of the respiratory inversion zone using the ‘PIP tool’ compared to measures made using station pull-through simulations. The 3D-HRM method tightly isolates the respiratory inversion zone within the crural diaphragm signal, which is less discretely accomplished with the pull-through technique. The shaded ‘V’ on the topography plot indicates the disposition of the split diaphragm signal.
DISCUSSION
This study utilized a novel 3D-HRM manometric device comprised of a 96-sensor array to dynamically monitor the EGJ area HPZ during rest in a group of normal subjects. Still ‘images’ at inspiration and expiration from the dynamic recordings were compared to simulations of a conventional pull-through method. The major findings of the study were that: 1) the dominant constituents of EGJ pressure at rest, identified by its characteristic radial and axial asymmetry, were attributable to the pressure signature of the diaphragmatic hiatus, 2) sphincter length assessed by a pull-through method greatly exaggerated the length of the segment within the EGJ that had circumferential contractile pressure, and 3) the respiratory inversion zone delineated with the ‘PIP tool’ of the 3D-HRM software was located at the apex of the diaphragmatic hiatus signal.
A major finding of interest this study pertained to the characteristics of the pressure peaks within the EGJ area, particularly that which we attribute to the diaphragmatic hiatus. The 3D-HRM pressure signature of the hiatus appeared oblique in relation to the luminal axis accounting for its extreme radial asymmetry (Figure 3). Regarding this ‘obliqueness’, the inverted-V pressure signal was constant among studies and this signal was clearly synchronized with inspiration as evidenced by the corresponding negative intrathoracic pressure. Hence, we propose that the inverted-V pressure signal in the 3D-HRM panoramic view is the ‘pressure signature of the diaphragmatic hiatus’. Further supporting this contention was the observation that DHApex was uniformly located at the RIP. Note that, as previously suggested by Kwiatek et al (6) DHApex was very likely reflective of crural diaphragm contraction, but it was not possible to be as certain regarding the genesis of DHBase beyond to say that it was clearly synchronized with respiration. Given recent observations of the mobility of the LES relative to the diaphragm in prolonged recordings, periodically converting from alignment to separation (12), as well as increasing interest in the pathophysiological significance of perturbations of EGJ anatomy in GERD, these observations beg for further studies in GERD subgroups, where there has been increasing recognition that the diaphragmatic hiatus plays a major role as an antireflux barrier since the observations by Mittal, et al. in the late 1980’s (13,14).
It was also of great interest to identify the pressure signature of the intrinsic LES within the 3D-HRM panorama of EGJ pressure (5). The key to isolating the LES component was in the post-deglutitive contraction, which doesn’t involve the diaphragm. As illustrated in Figure 4, the post-deglutitive LES contraction was circumferential and oriented perpendicularly to the axis of the esophagus in both control subjects (Figure 4B) and the case of hiatal hernia (Figure 4C). The proposed horizontal orientation of LES pressure, perpendicular to the luminal axis is also consistent with its anatomical characteristic of being comprised of circular muscle with only minor helical characteristics (15).
Another observation of interest in this study was that LES length determined with 3D-HRM was significantly shorter than ‘LES length’ determined by the station pull-through simulations. The lengthier pull-through measurements were attributable to the variable inclusion of pressure signals attributable to the LES, diaphragm, and vascular structures and to the misalignment of the radially oriented sensors with each other. Similar artifact was encountered in a previous study using ‘standard’ HRM reporting an average ‘LES length’ of 4.7 cm [3.3–5.3 cm] (16), presumably because of the effects of circumferentially averaging these non-circumferential, misaligned pressure constituents. Consequently, we believe that ‘LES length’ defined using the station pull-through incorporated all contributors to pressure within the EGJ without discerning which of the variably present ones were indeed present and without defining the spatial relationship between the LES and the diaphragm.
The meaning of the RIP localized in conventional manometry has been somewhat controversial since the observations of Dodds et al that movement of a pressure sensor relative to the pressure profile of the sphincter causes pressure fluctuations synchronized with respiration, but not necessarily localizing the diaphragm (17). This too was clarified using the ‘PIP tool’ in the current study. We observed that the locations of the RIP localized with the ‘PIP tool’ and DHApex exactly corresponded with each other, even though they were independent determinations. This highlights a key advantage of HRM, which is in avoiding the ‘location artifact’ inherent if 2D manometry technology and the ultimate genesis of the artifact described by Dodds, et al. Another consideration with respect to the ‘pseudo RIP’ observed by Dodds is that the magnitude of that pressure variation cannot exceed the magnitude of LES pressure and that it would be circumferential, being the LES after all. Neither of these conditions pertained to DHApex.
In conclusion, 3D-HRM permits real-time recording of EGJ pressure morphology facilitating analysis of the EGJ constituents responsible for its function as a reflux barrier. The axial and radial spatial resolution of the 9 cm 3D-HRM segment may permit further studies to differentiate pressure signals within the EGJ attributable to the LES and to extrinsic structures (diaphragm and vascular artifacts). These attributes of the 3D-HRM device suggest it to be a promising new tool in the study of GERD pathophysiology. Further pathophysiological studies are anticipated in subgroups of GERD patients with reflux and with and without hiatus hernia in the hopes of evolving this into a valuable clinically technique.
Acknowledgments
GRANTS
This work was supported by R01 DK56033 (PJK) and R01 DK079902 (JEP) from the National Institutes of Health, USA.
Abbreviations
- LES
lower esophageal sphincter
- EGJ
esophagogastric junction
- GERD
gastroesophageal reflux disease
- 3D-HRM
three dimensional high resolution manometry
- EPT
esophageal pressure topography
- RIP
respiratory inversion point
- HPZ
high pressure zone
Footnotes
AUTHOR CONTRIBUTIONS
Frédéric Nicodème contributed to the conception and study design, study supervision, data collection, analysis and interpretation, statistical analysis, manuscript drafting, editing, critical revision and final approval. John E. Pandolfino contributed to the conception and study design, obtained funding, data interpretation, manuscript editing, critical revision and final approval. Zhiyue Lin contributed to analysis and interpretation, critical revision and final approval. Peter J. Kahrilas contributed to the conception and study design, obtained funding, data interpretation, manuscript drafting, editing, critical revision and final approval.
DISCLOSURES
No relevant competing financial and other interests exist for Frédéric Nicodème, Zhiyue Lin, John E. Pandolfino or Peter J. Kahrilas.
References
- 1.Mittal RK, Balaban DH. The esophagogastric junction. N Engl J Med. 1997;336:924–932. doi: 10.1056/NEJM199703273361306. [DOI] [PubMed] [Google Scholar]
- 2.Harris LD, Pope CE. The pressure inversion point: its genesis and reliability. Gastroenterology. 1966;51:641–648. [PubMed] [Google Scholar]
- 3.Stein HJ, DeMeester TR. Who benefits from antireflux surgery? World J Surg. 1992;16:313–319. doi: 10.1007/BF02071539. [DOI] [PubMed] [Google Scholar]
- 4.Kahrilas PJ, Shaheen NJ, Vaezi MF. American Gastroenterological Association Medical Position Statement on the Management of Gastroesophageal Reflux Disease. Gastroenterology. 2008;135:1383–1391.e5. doi: 10.1053/j.gastro.2008.08.045. [DOI] [PubMed] [Google Scholar]
- 5.Mittal RK, Rochester DF, McCallum RW. Sphincteric action of the diaphragm during a relaxed lower esophageal sphincter in humans. Am J Physiol Gastrointest Liver Physiol. 1989;256:G139–G144. doi: 10.1152/ajpgi.1989.256.1.G139. [DOI] [PubMed] [Google Scholar]
- 6.Kwiatek MA, Pandolfino JE, Kahrilas PJ. 3D-high resolution manometry of the esophagogastric junction. Neurogastroenterol Motil. 2011;23:e461–e469. doi: 10.1111/j.1365-2982.2011.01733.x. [DOI] [PMC free article] [PubMed] [Google Scholar]
- 7.JONES R, JUNGHARD O, Dent J, et al. Development of the GerdQ, a tool for the diagnosis and management of gastro-oesophageal reflux disease in primary care. Aliment Pharmacol Ther. 2009;30:1030–1038. doi: 10.1111/j.1365-2036.2009.04142.x. [DOI] [PubMed] [Google Scholar]
- 8.Nicodème F, Pandolfino JE, Lin Z, et al. Adding a radial dimension to the assessment of esophagogastric junction relaxation: validation studies of the 3D-eSleeve. AJP: Gastrointestinal and Liver Physiology. 2012;303:G275–80. doi: 10.1152/ajpgi.00063.2012. [DOI] [PMC free article] [PubMed] [Google Scholar]
- 9.Bredenoord AJ, Fox M, Kahrilas PJ, et al. Chicago classification criteria of esophageal motility disorders defined in high resolution esophageal pressure topography. Neurogastroenterol Motil. 2012;24 (Suppl 1):57–65. doi: 10.1111/j.1365-2982.2011.01834.x. [DOI] [PMC free article] [PubMed] [Google Scholar]
- 10.Clouse RE, Staiano A, Alrakawi A, et al. Application of topographical methods to clinical esophageal manometry. Am J Gastroenterol. 2000;95:2720–2730. doi: 10.1111/j.1572-0241.2000.03178.x. [DOI] [PubMed] [Google Scholar]
- 11.Kwiatek MA, Nicodeme F, Pandolfino JE, et al. Pressure morphology of the relaxed lower esophageal sphincter: the formation and collapse of the phrenic ampulla. AJP: Gastrointestinal and Liver Physiology. 2012;302:G389–G396. doi: 10.1152/ajpgi.00385.2011. [DOI] [PMC free article] [PubMed] [Google Scholar]
- 12.Mittal RK, Karstens A, Leslie E, et al. Ambulatory high-resolution manometry, lower esophageal sphincter lift and transient lower esophageal sphincter relaxation. Neurogastroenterol Motil. 2012;24:40–e2. doi: 10.1111/j.1365-2982.2011.01816.x. [DOI] [PMC free article] [PubMed] [Google Scholar]
- 13.Mittal RK, Rochester DF, McCallum RW. Effect of the diaphragmatic contraction on lower oesophageal sphincter pressure in man. Gut. 1987;28:1564–1568. doi: 10.1136/gut.28.12.1564. [DOI] [PMC free article] [PubMed] [Google Scholar]
- 14.Mittal RK, Rochester DF, McCallum RW. Electrical and mechanical activity in the human lower esophageal sphincter during diaphragmatic contraction. J Clin Invest. 1988;81:1182–1189. doi: 10.1172/JCI113433. [DOI] [PMC free article] [PubMed] [Google Scholar]
- 15.Gilbert RJ, Gaige TA, Wang R, et al. Resolving the three-dimensional myoarchitecture of bovine esophageal wall with diffusion spectrum imaging and tractography. Cell and tissue research. 2008;332:461–468. doi: 10.1007/s00441-008-0601-0. [DOI] [PubMed] [Google Scholar]
- 16.Ayazi S, Hagen JA, Zehetner J, et al. The Value of High-Resolution Manometry in the Assessment of the Resting Characteristics of the Lower Esophageal Sphincter - Springer. J Gastrointest Surg. 2009;13:2113–2120. doi: 10.1007/s11605-009-1042-0. [DOI] [PubMed] [Google Scholar]
- 17.Dodds WJ. Instrumentation and Methods for Intraluminal Esophageal Manometry. Arch Intern Med. 1976;136:515–523. [PubMed] [Google Scholar]


