Abstract
Obesity arises mainly due to the imbalance between energy storage and its expenditure. Metabolically active brown adipose tissue (BAT) has recently been detected in humans and has been proposed as a new target for anti-obesity therapy because of its unique capacity to regulate energy expenditure. Myostatin (Mst), a negative regulator of muscle mass, has been identified as a potential target to regulate overall body composition. While the beneficial effects of Mst inhibition on muscle mass are well known, its role in the regulation of lipid metabolism, and energy expenditure is not very clear. We tested the effects of Mst inhibition on the gene regulatory networks that control BAT differentiation using both in vivo and in vitro model systems. PRDM16 and UCP1, two key regulators of brown fat differentiation were significantly up regulated in levator-ani (LA) and gastrocnemius (Gastroc) muscles as well as in epididymal (Epi) and subcutaneous (SC) fat pads isolated from Mst knock out (Mst KO) male mice compared to wild type (WT) mice. Using mouse embryonic fibroblast (MEFs) primary cultures obtained from Mst KO group compared to the WT group undergoing adipogenic differentiation, we also demonstrate a significant increase in select genes and proteins that improve lipid metabolism and energy expenditure. Furthermore, treatment of Mst KO MEFs with recombinant Mst protein significantly inhibited the gene expression levels of UCP1, PRDM16, PGC1-α/β as well as BMP7. Future studies to extend these findings and explore the therapeutic potential of Mst inhibition on metabolic disorders are warranted.
INTRODUCTION
Mst, a key member of the transforming growth factor-β (TGF-β) super family, has been demonstrated to play a major role in the regulation of skeletal muscle growth and overall fat content in mice (1–3) and humans (4). Loss of Mst results in a significant increase in lean mass as well as total energy expenditure in comparison to wild type control mice (5,6). Mst KO mice are also protected against high fat diet-induced weight gain and insulin resistance (7).
Brown adipose tissues (BAT) regulate energy expenditure through a process called adaptive thermogenesis, which dissipates chemical energy to produce heat (8, 9). Although BAT comprises a very small percentage of total body weight, it influences cell metabolism by regulating blood triglyceride clearance and glucose disposal (9). Brown fat elicits its themogenic function through the induction of mitochondrial protein called uncoupling protein-1 (UCP1) (10). Genetic disruption of UCP1 gene or reduction of brown fat tissues in mice is associated with increased obesity (11, 12). A genome-wide screen for transcriptional regulators enriched in brown fat cells led to the identification of PRDM16, a zinc-figure protein as a dominant regulator of the brown fat differentiation program, which has the ability to induce UCP1 and PGC-1α, and suppress genes that are selectively expressed in white adipose tissues (13, 14). Inhibition of PRDM16 with shRNA in mice BAT cells led to complete suppression of brown-fat selective genes, including UCP1 mRNA and protein without affecting the expression of metabolically important genes such as PPARγ and aP2 (13).
Ectopic brown fat progenitors have recently been identified in mice skeletal muscle and white fat tissues (15). These brown-fat cells found in white fat and between muscle bundles are more abundant in obesity resistant strains of mice (16). Brown fat and skeletal muscle share common developmental ancestry (17) and are suggested to arise from myf5-positive precursors, although some brown fat cells may derive from a different pool (18). In a recent paper, Zhang et. al. reported enhanced fatty acid oxidation and increased thermogenesis in Mst KO mice on high fat diet, which was associated with increased lipolysis and up-regulation of BAT specific transcription factors in Epi WAT (7). Also, treatment of primary cultures isolated from interscapular brown adipose tissues with recombinant Mst protein resulted in inhibition of brown fat differentiation (19). Skeletal muscle plays a major role in triglyceride clearance as well as in glucose disposal, the two main metabolic functions elicited by brown adipose tissues (20). Also, inducible brown adipocyte progenitors are reported to reside in skeletal muscle as well as in interscapular BAT (iBAT), SC and Epi WATs (15). Analysis of PRDM16 protein and RNA expression profile in different fat depots suggest that it was highly expressed in iBAT and SC WAT (~50% of iBAT) but was barely detected in Epi WAT (21).
In our present study, we evaluated the potential role of Mst inhibition on genes and proteins involved in brown fat differentiation, energy expenditure and lipid metabolism in skeletal muscle as well as in white adipose tissues isolated from WT and Mst KO mice. We also utilized MEF in vitro primary cultures isolated from WT and Mst KO embryos differentiated under specialized adipogenic conditions, and evaluated the effect of exogenous Mst on the expression profile of genes and proteins involved in the brown adipogenic differentiation. Our combined approach therefore, demonstrates that genetic or pharmacological manipulation of Mst expression both in vitro and in vivo may lead to global alteration of the brown adipogenic program suggesting a need to develop pharmacological inhibitors of Mst for the treatment of obesity and related metabolic diseases.
RESEARCH DESIGN AND METHODS
Animals
All animal experiments were approved from Institutional Animal Care and Use Committee, Charles Drew University. Heterozygous male and female Mst +/− mice (aged 2–3 months) (donated by Dr. S-J Lee; Department of Molecular Biology and Genetics, Johns Hopkins University School of Medicine, Baltimore, MD) were housed at constant temperature (68°0 F) under an artificial light/dark cycle (12/12h) and allowed to have free access to water and food (normal chow). Muscle (LA and Gastroc) and fat tissues (SC and Epi) were excised from 21 day old (4 animal each) WT (Mst +/+) and Mst KO (Mst −/−) male mice for analysis.
MEF culture, differentiation and treatment
MEFs were generated from 13.5 day post-coitum mouse embryos. Embryos were harvested, the head, limbs, and the internal organs were removed, and the carcasses were rinsed with 1 X PBS and minced. Minced carcasses were suspended with 3 ml 0.025% trypsin/EDTA (Invitrogen) and incubated at 37°C for 20 min. The trypsin was neutralized, after two trypsinization cycles, by adding the equal volume of cell culture media (DMEM supplemented with 10% fetal bovine serum, 20 mM glutamine, and penicillin/streptomycin). Cell suspensions were centrifuged and resuspended with cell culture media and plated out to three T-75 flasks per embryo and cultured at 37°C with 95% air and 5% CO2. When the cells are confluent, entire cells were split into four to five 100 mm dishes and cultured until confluent. For differentiation, 1-day post confluent cells (designated day 0) were treated with adipogenic differentiation medium (DM) containing 1μM dexamethasone (Sigma Chemicals), 0.5 mM methylisobutylxanthene, 5μg insulin/ml and 0.5μM rosiglitazone (Sigma Chemicals) for 48 h. After 48h, the medium was changed to maintenance medium (MM) containing 5μg insulin/ml and 0.5μM rosiglitazone and was changed every other day for up to day 6. MEFs isolated from Mst KO embryos were also treated with recombinant mouse Mst (R&D Systems, Minneapolis, MN) (2μg/ml) and medium was changed every alternate day. Early passage MEFs (p≤3) was used for each experiment in order to avoid senescence.
Genotyping
Genomic DNA was isolated from the heads harvested from each embryo using Direct Lysis Reagent (Viagen Biotech, CA). Genotypes of embryos were confirmed by PCR using an Mst WT and Mst KO primer sets (1). Mst WT primer set amplifies a 220 bp fragment (in C-terminal region) from the wild-type allele; while, the Mst KO primer set amplifies a 332 bp fragment (in PGK neo region) from the knockout allele. PCR cycle profile and the sequence of primers used for genotyping were as follows: 94°C 1 min, 94°C 30 sec / 68°C 30 sec-2 min for 15 times with −0.5°C per cycle, 94°C 30 sec and 60°C 30 sec for 20 times. Following primer pairs were used for genotyping - WT forward: 5′-AGAAGTCAAGGTGACAGACACAC-3′; WT reverse: 5′-GGTGCACAAGATGAGTATGCGG-3′; KO forward: 5′-GGATCGGCCATTGAACAAGATG-3′; and KO reverse: 5′-GAGCAAGGTGAGATGACAGGAG-3′.
Oil-Red O staining
Differentiated MEFs were fixed in 2% paraformaldehyde and stained with 0.5% Oil-Red O (Sigma Chemical Co., Saint Louis, MO) for 15 min as described previously (22). Oil Red O staining was quantified by image analysis using the Image Pro 7.0 software (Media Cybernetics, Silver Spring, MD), coupled to a Leica DMLB microscope/VCC video camera. After images were calibrated for background lighting, integrated OD (IOD = area × average intensity) was calculated using at least 20 pictures per treatment group (21). Results are proportional to the unweighted average OD, which was used to determine the Oil Red O staining, retained in the fat cells.
Immunoblot analysis
Proteins were resolved on 10–12% SDS-PAGE gels and then electro transferred and analyzed for protein expression using the following antibodies- anti-PRDM16 (1:300 dilution, Santa Cruz Biotechnology, CA), anti-aP2 (FABP4) (1:500 dilution, Santa Cruz Biotechnology, CA), antiC/EBP-α and anti-PPARγ (1:500 dilutions, Santa Cruz Biotechnology, CA); anti-UCP1 (1:1000 dilution, Abcam, MA); anti-AdipoQ (1:1000 dilutions, Millipore); anti-AMPK/anti-pAMPK (1:1000 dilutions, Cell Signaling) or anti-GAPDH antibody (1:5,000 dilutions, Chemicon International, Temecula, CA) with appropriate HRP-linked to secondary antibodies (1:1000 dilution) (Cell Signaling, MA). Immuno-reactive bands were visualized, scanned and analyzed by Image Quant software.
Real-time Quantitative PCR Analysis
Total RNA was extracted by using Trizol reagent, and equal amounts (2μg) of RNA were reverse transcribed using RNA High Capacity cDNA kit (Applied Bio systems, Foster City, CA). The Power Sybr Green PCR master mix was used with 7500 fast real-time PCR system (Applied BioSystems). The primer pairs used are shown in Table 1. Samples of 25 ng cDNA were analyzed in quadruplicate in parallel with GAPDH controls. The experimental mRNA starting quantities were calculated from the standard curves and averaged using 7500 software v1.4 (22–24).
Table 1.
Primer sequences used for quantitative real-time PCR
| PRIMER | FORWARD | REVERSE | Size (bp) |
|---|---|---|---|
| PRDM16 | 5′-CCACCAGCGAGGACTTCAC-3′ | 5′-GGAGGACTCTCGTAGCTCGAA-3′ | 107 |
| UCP1 | 5′-GTGAACCCGACAACTTCCGAA-3′ | 5′-TGAAACTCCGGCTGAGAAGAT-3′ | 66 |
| PGC1-α | 5′-TATGGAGTGACATAGAGTGTGCT-3′ | 5′-CTGGGCAAAGAGGCTGGTC-3′ | 57 |
| PGC1-β | 5′-CAGTACAGCCCCGATGACTC-3′ | 5′-GAAAGCTCGTCCACGTCAGAC-3′ | 242 |
| CEBP-α | 5′-GCGGGAACGCAACAACATC-3′ | 5′-GTCACTGGTCAACTCCAGCAC-3′ | 97 |
| PPARγ2 | 5′-GGAAGACCACTCGCATTCCTT-3′ | 5′-GTAATCAGCAACCATTGGGTCA-3′ | 121 |
| BMP7 | 5′-CCTGTCCATCTTAGGGTTGCC-3′ | 5′-CGCCGAATTATGCTTTCCCTG-3′ | 64 |
| Mst | 5′-AGTGGATCTAAATGAGGGCAGT-3′ | 5′-GGAGTACCTCGTGTTTTGTCTC-3′ | 94 |
| Cidea | 5′-TGACATTCATGGGATTGCAGAC-3′ | 5′-CATGGTTTGAAACTCGAAAAGGG-3′ | 84 |
| FGF21 | 5′-GTGCAAAGCCTCTAGGTTTCTT-3′ | 5′-GGTACACATTGTAACCGTCCTC-3′ | 123 |
| ELOV2 | 5′-TTGGCTGAGTACCTACACCTG-3′ | 5′-CTCGAACCATCCGAAGTGCTT-3′ | 77 |
Statistical Analysis
Data are presented as mean+/− SD, and between group differences were analyzed using ANOVA. If the overall ANOVA revealed significant differences, then pair-wise comparisons between groups were performed by Newman-Keuls multiple group test. All comparisons were two-tailed and p values ≤ 0.05 were considered statistically significant. The experiments were repeated at least three times, and data from representative experiments are shown.
RESULTS
Induction of BAT-specific protein and gene expression in skeletal muscle tissues in Mst KO mice compared to the WT
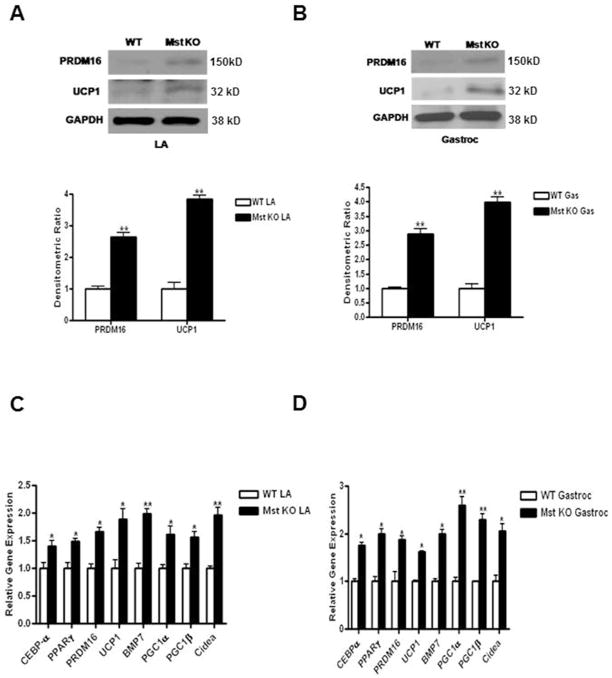
LA and Gastroc muscles were isolated from 21 day old WT and Mst KO mice. 150 μg of total cell lysates were analyzed by western blot analysis and probed with either anti-PRDM16 or anti-UCP1 antibodies. Protein expressions of both PRDM16 and UCP1 were barely detectable in WT mice; however, their expression was significantly induced in both LA (PRDM16: 2.6 ± 0.21 fold, p≤0.005; and UCP1: 3.8 ± 0.12 fold, p≤0.005) and Gastroc (PRDM16: 2.9 ± 0.15 fold, p≤0.005; and UCP1: 3.9 ± 0.24 fold, p≤0.005) muscle tissues from Mst KO mice (Figure 1A–B). We also analyzed the gene expression patterns of BAT-specific markers using quantitative real-time PCR analysis from these two skeletal muscle tissues. We found a significant induction of CEBP-α (LA: 1.4 ± 0.21 fold, p≤0.05; Gastroc: 1.75 ± 0.13 fold, p≤0.05); PPARγ (LA: 1.49 ±0.11; Gastroc: 2 ±0.21); PRDM16 (LA: 1.89 ± 0.37 fold, p≤0.05; Gastroc: 1.42 ± 0.05 fold, p≤0.05), UCP1 (LA: 1.67 ± 0.15 fold, p≤0.05; Gastroc: 1.87 ± 0.16 fold, p≤0.05), BMP7 (LA: 1.99 ±0.18 fold; Gastroc: 1.99 ±0.2 fold), PGC1-α (LA: 1.61 ±0.31 fold; Gastroc: 2.6 ±0.37 fold), PGC1-β (LA: 1.57 ±0.2 fold; Gastroc: 2.3 ±0.24 fold); and Cidea (LA: 1.97±0.27 fold; Gastroc: 2.06 ±0.3 fold) gene expression in Mst KO tissues compared to the WT tissues (Figure 1C–D), suggesting that brown fat differentiation program was significantly induced in the two skeletal muscle groups isolated from Mst KO mice compared to the WT mice.
Fig. 1.
Analysis of PRDM16 and UCP1 protein expression in LA and Gastroc muscles isolated from WT and Mst KO mice. 100μg of total protein lysates from LA (A) and Gastroc (B) muscles were analyzed by Western blot (top panel). Quantitative densitometric analysis normalized to GAPDH is shown at the bottom panel. Analysis of a panel of BAT-specific mRNAs isolated from LA (C) and Gastroc (D) muscles of WT and Mst KO mice by quantitative real-time PCR. Experiment was repeated three times and representative data is shown (*, denotes p≤0.05; and **, denotes p≤0.005).
Induction of BAT-specific protein and gene expression in white adipose tissues isolated from Mst KO mice compared to the WT mice
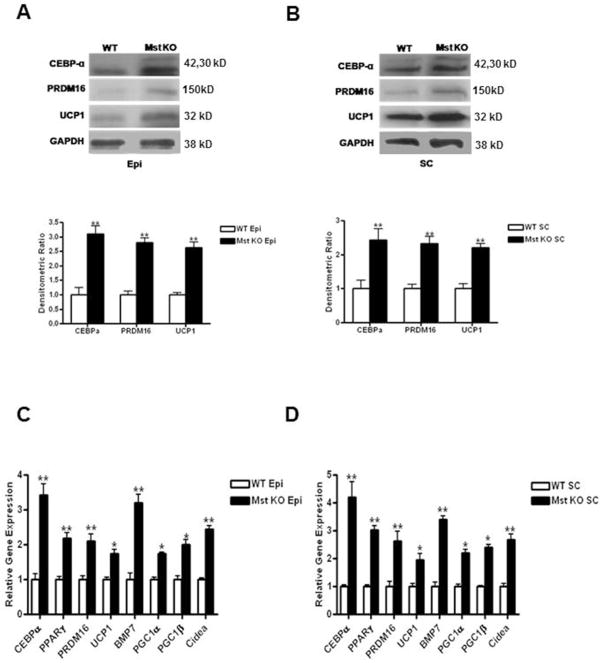
Epi and SC fat pads were isolated from 21 day old WT and Mst KO mice. 100 μg of total cell lysates were analyzed by western blot analysis and probed with anti-CEBP-α, anti-PRDM16 or anti-UCP1 antibodies. We found a significant induction in CEBP-α (Epi: 3.1 ± 0.6 fold, p≤0.005; and SC: 2.4 ± 0.7 fold, p≤0.005); PRDM16 (Epi: 2.8 ± 0.2 fold, p≤0.005; and SC: 2.3 ± 0.3 fold, p≤0.005) as well as in UCP1 (Epi: 2.62 ± 0.4 fold, p≤0.005; and SC: 2.2 ± 0.4 fold, p≤0.005) in Mst KO tissues compared to that of the WT tissues (Figure 2A–B). Our analysis of gene expression pattern confirmed significantly higher expression levels of CEBP-α (Epi: 3.17 ± 0.62 fold, p≤0.005; SC: 4.2 ± 0.68 fold, p≤0.005), PPARγ (Epi: 2.19 ±0.3 fold; SC: 3.02 ±0.3 fold); PRDM16 (Epi: 2.1 ± 0.32 fold, p≤0.005; SC: 2.6 ± 0.4 fold, p≤0.005); UCP1 (Epi: 1.5 ± 0.22 fold, p≤0.05; SC: 1.8 ± 0.28 fold, p≤0.05); BMP7 (Epi: 3.2 ±0.48 fold; SC: 3.4 ±0.27 fold); PGC1-α (Epi: 1.74 ±0.1 fold; SC: 2.2 ±0.28 fold); PGC1-β (Epi: 2.0 ±0.27 fold; SC: 2.4 ±0.19 fold) and Cidea (Epi: 2.45 ±0.18 fold; SC: 2.69 ±0.37 fold) in Mst KO tissues compared to that obtained from WT tissues (Figure 2C–D).
Fig. 2.
Analysis of CEBPα, PRDM16 and UCP1 protein expression in Epi and SC fat depots isolated from WT and Mst KO mice. 100μg of total protein lysates from Epi (A) and SC (B) muscles were analyzed by Western blot (top panel). Quantitative densitometric analysis normalized to GAPDH is shown at the bottom panel. Analysis of a panel of BAT-specific mRNAs isolated from Epi (C) and SC (D) fat depots of WT and Mst KO mice by quantitative real-time PCR. Experiment was performed three times and representative data is shown (*, denotes p≤0.05; and **, denotes p≤0.005).
Up-regulation of key brown fat differentiation markers in MEFs isolated from Mst KO mice compared to the WT mice under BAT-specific differentiation conditions
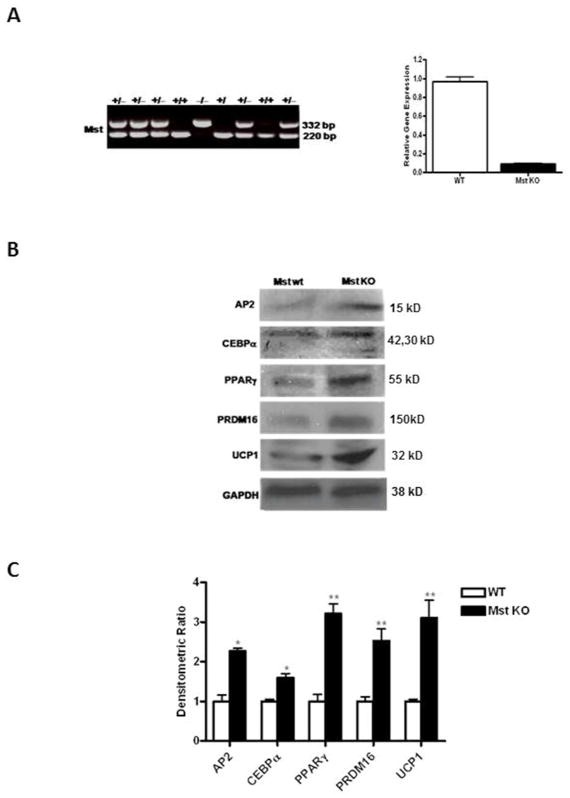
Primary cultures of MEFs were isolated from embryos of 13.5 day pregnant female Mst heterozygotes (Mst+/−) mice that were allowed to breed with male Mst heterozygous (Mst+/−) mice. Genotyping was performed using specific primer pairs that detect WT (+/+, 220 bp), heterozygote (+/−, 220 and 332 bps) and KO (−/−, 332 bp) alleles (Figure 3A, left panel). Mst gene and protein expression from WT and KO MEFs were analyzed to confirm the genotyping, where we find a very low level of Mst gene expression in Mst KO (~5–8% expression compared to the WT group) (Figure 3B, right panel). MEFs were allowed to differentiate under BAT-specific differentiation conditions for 6 days, harvested, and western blot analysis performed. We found significant increase in several proteins associated with both white (AP2: 2.27± 0. fold, p≤0.05; CEBPα: 1.6 ± 0.15 fold, p≤0.05; and PPARγ: 3.22 ± 0.43 fold, p≤0.005) and brown (PRDM16: 2.53± 0.32 fold, p≤0.005; UCP1: 3.1 ± 0.62 fold, p≤0.005) fat differentiation in MEFs isolated from Mst KO embryos compared to the WT. Our data therefore, suggest that in absence of Mst there is a potent induction of brown adipogenic differentiation of the MEF cultures (Figure 3B–C).
Fig. 3.
Genotyping and analysis of brown fat specific markers in primary cultures of mouse embryonic fibroblasts (MEFs) isolated from WT and Mst KO differentiating under adipogenic conditions. (A) Genotypic analysis of mouse embryos obtained from 13.5 day pregnant female Mst heterozygous (+/−) mice after breeding with male Mst heterozygous (+/−) mice (left panel). Quantitative analysis of Mst gene expression in WT and Mst KO MEFs (right panel). Protein (B) and gene (C) expression analysis of differentiating WT and Mst KO MEFs after 6 days. Experiment was performed three times and representative data is shown (*, denotes p≤0.05; and **, denotes p≤0.005).
Increased BAT differentiation in Mst KO MEFs compared to the WT MEFs is inhibited by recombinant Mst treatment
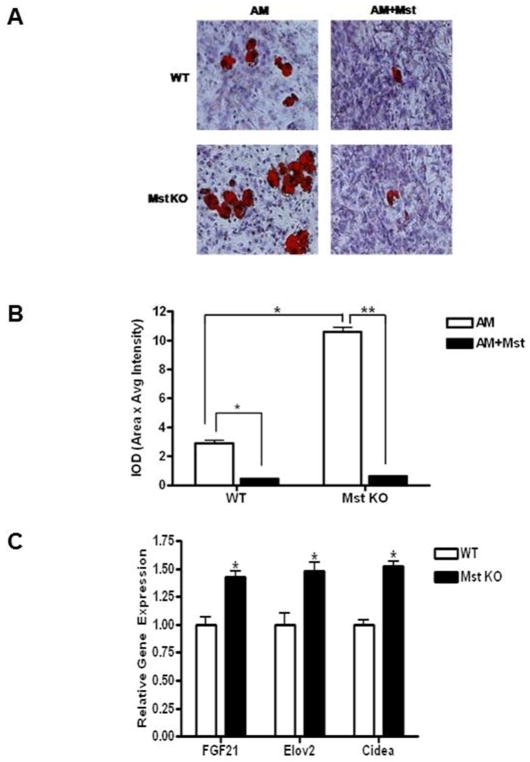
Quantitative analysis of adipogenic differentiation was performed by Oil-Red staining of the differentiated MEFs from both WT and Mst KO cultures treated with or without recombinant human Mst protein (2μg/ml) (Figure 4A–B). MEFs were differentiated for 48h in AM, followed by differentiation in maintenance medium (MM) for another 6 days either in presence or absence of recombinant Mst (2ug/ml). Medium was changed every alternate day during their differentiation period. There was a significant increase in Oil-Red O staining in Mst KO cells compared to that of the WT (3.65± 0.6 fold, p≤0.05) (Figure 4A–B). Furthermore, Mst treatment of WT (84 ± 6.2%, p≤0.05) and KO (94.3 ± 5.2 %, p≤0.005) culture resulted in significant inhibition of adipogeneis compared to the control untreated group (Figure 4A–B). Our quantitative real-time PCR analysis data revealed a significant increase in FGF21 (1.43 ±0.22 fold p≤0.05); Elov2 (1.48 ±0.3 fold, p≤0.050 and Cidea (1.52 ±0.17 fold, p≤0.05) in Mst KO MEFs compared to WT MEFs undergoing similar BAT-specific differentiation after 6 days (Figure 4C).
Fig. 4.
Effect of recombinant Mst on the adipogenic differentiation in primary cultures of WT and Mst KO MEFs. Cells were plated on a six-well plate and allowed to differentiate under adipogenic conditions either in absence or presence of recombinant Mst (2μg/ml) as described in materials and methods. Cells were fixed and stained with Oil-Red O (A) and quantitative analysis of the staining (B) is presented as IOD (area x intensity of staining). (C) Real-time quantitative PCR analysis of Cidea, FGF21 and Elov2 in WT and Mst KO MEFs undergoing BAT-specific differentiation. Experiment was performed three times and representative data is shown (**, denotes p≤0.005).
Up-regulation of key genes involved in brown adipogenic differentiation in Mst KO MEFs and their inhibition by recombinant Mst protein
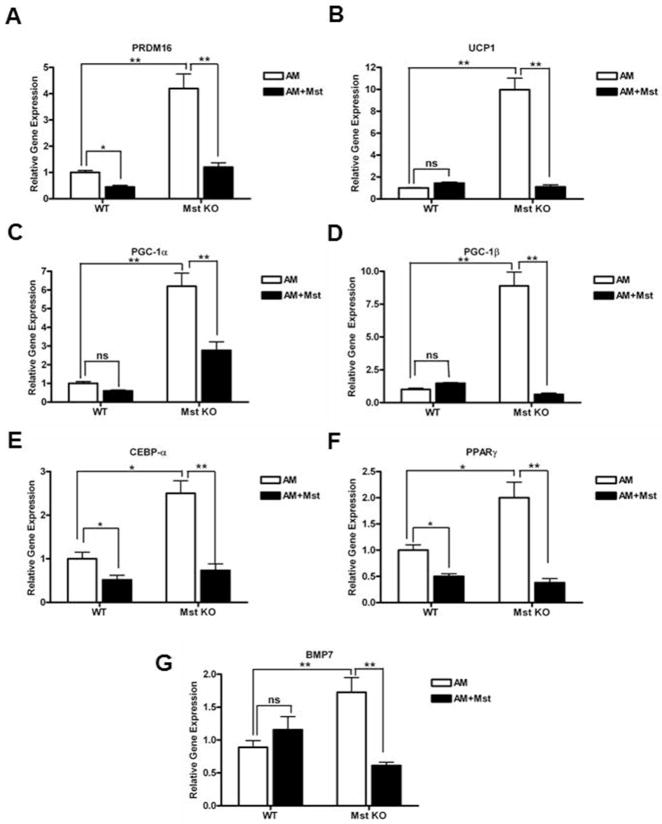
We performed real-time quantitative PCR analysis using total cellular RNA obtained from various treatment groups to analyze gene expression profile of several important genes involved in the BAT differentiation program. We found significant induction of PRDM16 (4.2 ± 1.1 fold, p≤0.005); UCP1 (9.8 ± 2.1 fold, p≤0.005); PGC-1α (6.2 ± 1.4 fold, p≤0.005); PGC-1β (8.7 ± 2.1 fold, p≤0.005); CEBP-α (2.4 ± 0.6 fold, p≤0.05); PPARγ (2.0 ± 0.6 fold, p≤0.005) and BMP7 (1.73 ± 0.45 fold, p≤0.005) in differentiating Mst KO MEFs compared to the WT MEFs (Figure 5A–G). Recombinant Mst treatment of the differentiated WT MEFs led to significant inhibition of PRDM16 (55 ± 5.7%, p≤0.05); CEBP-α (54.2 ± 15.2%, p≤0.05) and PPARγ (52.4 ± 8.7%, p≤0.05) genes. On the other hand, recombinant Mst treatment of differentiated Mst KO MEFs led to significant inhibition of PRDM16 (72.6 ± 7.6%, p≤0.005); UCP1 (89. 3 ± 4.4%, p≤0.005); PGC-1α (54.84 ± 12.5%, p≤0.005); PGC-1β (93.3 ± 2.7%, p≤0.005); CEBP-α (69.6 ± 12.4%, p≤0.005); PPARγ (81.0 ± 8.2%, p≤0.005) and BMP7 (64.74 ± 7.2%, p≤0.005) gene expression (Figure 5A–G). Our data, therefore suggest that deletion of Mst significantly up regulated BAT differentiation and supplementation of these differentiating MEFs with exogenous Mst significantly block BAT differentiation.
Fig. 5.
Analysis of brown fat specific genes PRDM16 (A); UCP1 (B); PGC-1α (C); PGC-1β (D); CEBPα (E); PPARγ2 (F) and BMP7 (G) in differentiating WT and Mst KO MEF primary cultures and their inhibition by recombinant Mst protein. Experiment was performed three times and representative data is shown (*, denotes p≤0.05; and **, denotes p≤0.005).
Induction of adiponectin and AMP-activated protein kinase signaling in Mst KO MEFs during BAT differentiation
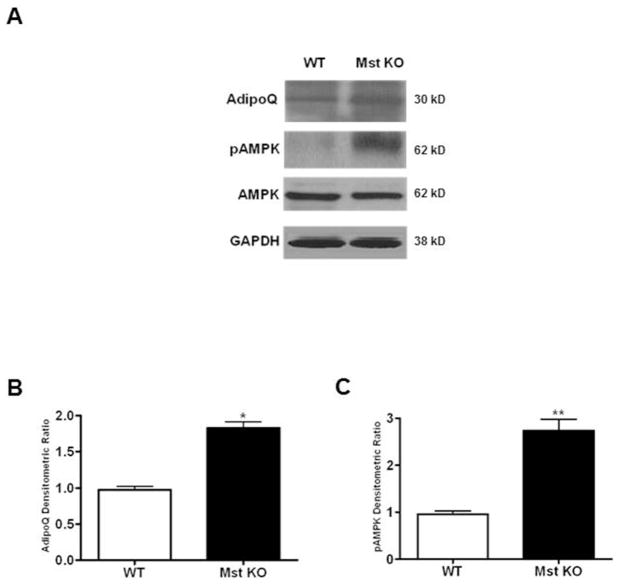
In order to test the role of energy sensing AMP-activated protein kinase signaling in MEF primary cultures isolated from WT and Mst KO embryos during adipogenic differentiation, we analyzed protein expression of adiponectin (AdipoQ) and AMPK/pAMPK. AdipoQ (1.82 ± 0.24 fold, p≤0.05) and pAMPK (2.73 ± 0.54 fold, p≤0.005) protein levels were significantly up regulated in Mst KO compared to the WT MEFs without any significant change in AMPK levels (Figure 6A–C).
Fig. 6.
Analysis of adiponectin (AdipoQ), AMPK and pAMPK protein expression in primary cultures of MEFs under adipogenic differentiation conditions after 6 days. Western blot analysis (A) and quantitative densitometric analysis (B) are shown (*, denotes p≤0.05; and **, denotes p≤0.005).
Discussion
Obesity and related metabolic diseases are recognized as global health problem and has been described as “the plague of our time” (25). Obesity develops when energy intake exceeds total energy expenditure. BAT has the unique capacity to burn energy by activating a process called adaptive thermogenesis in contrast to WAT, which stores energy in the form of triglycerides. Significant amounts of metabolically active BAT have recently been demonstrated in some studies (26), raising the hope that BAT-mediated dissipation of excess energy could be a viable solution to target obesity and related diseases in human.
Mst has emerged as an important regulator of muscle mass as well as overall fat content in mice (1–4). Loss of Mst in mice Mst KO mice has been reported to be associated with a significant loss of adipose tissues mass (4) and lower serum leptin levels in spite of normal food intake compared to wild type mice (7). In a recent report, Zhang et. al. demonstrated that Mst KO mice are protected against high fat diet (HFD)-induced obesity which was associated with enhanced fatty acid oxidation, increased body temperature and increased levels of BAT specific genes associated with ‘brown-like fat’ phenotype in epidydimal (Epi) WAT (7). However, the observed changes in overall cellular metabolism in Mst KO mice (7) could not be simply explained on the basis of increased BAT expression in Epi WAT only. Accordingly, we analyzed the expression of BAT specific genes and proteins from LA and Gastroc muscles as well as from SC and Epi WATs obtained from both WT and Mst KO mice. Our findings clearly suggest that Mst KO mice have significantly increased expression of BAT specific markers in other relevant tissues compared to the WT mice. While previous studies by Zhang et. al. (7) suggested up-regulation of cyclooxygenase 2 (COX-2) as the major molecular mechanism responsible for Mst-induced regulation of BAT formation at least in Epi WAT, we were unable to find increased COX-2 mRNA or protein expression in any of the muscle or fat tissue obtained from Mst KO mice compared to the WT mice. On the other hand, we found increased expression of PRDM16 gene and protein expression in both muscle as well as WAT obtained from Mst KO mice compared to the WT mice. Recent studies have also identified inducible brown adipocyte progenitors that reside not only in white fat but also in skeletal muscle (15). As skeletal muscle represents a powerful metabolic tissue, we simultaneously analyzed the expression of BAT-specific markers in LA and Gastroc muscles along with Epi and SC WATs isolated from WT and Mst KO male mice. Our data provides evidence that protein and gene expression of two key BAT specific markers UCP1 and PRDM16 are significantly up-regulated not only in Epi and SC fat tissues but also in LA and Gastroc skeletal muscle groups in Mst KO compared to the WT (Figure 1–2). Our data, therefore, may explain and support previous reports of overall increase in energy expenditure, body temperature and enhanced metabolic activities in Mst KO mice (5, 7).
Thermogenic program is very important during embryonic development and early childhood for the maintenance of body temperature and other regulatory roles. Therefore, understanding the specific role of Mst in overall BAT differentiation during this period would be beneficial from therapeutic point of view. We utilized primary cultures of MEFs (both WT and KO) isolated from day 13.5 pregnant heterozygous Mst (Mst+/–) mice and induced the BAT differentiation program. We observed that MEFs isolated from Mst KO embryos had significantly induced levels of key adipogenic genes (both WAT and BAT) and proteins (Figure 3). Treatment of these cells with recombinant Mst protein led to a significant decrease in Oil-Red O staining (Figure 4 and expression of BAT specific genes in both WT and KO groups (Figure 5). AMP-activated protein kinase (AMPK) is a critical regulator of mitochondrial biogenesis that controls the expression of genes involved in energy metabolism by acting in coordination with NAD+ -dependent type III deacetylase sirtuin 1 (SIRT1) (27, 28) were found to be up-regulated in muscle, WAT, as well as, in liver tissues isolated from Mst KO mice (7). Our data obtained from MEF primary cultures further support these findings and provide an explanation for enhanced metabolic capacity through induction of adiponectin and AMPK signaling pathways in differentiating Mst KO primary cultures compared to the WT counterparts. Adiponectin, originally identified as an adipose-specific gene (29, 30) has also been reported to limit triglyceride (TG) accumulation in liver (31) and increase glucose and TG clearance (32). Also, reduced levels of adiponectin have been correlated to increased risk of developing obesity and type 2 diabetes (30, 33). In a recent study, transgenic mice over-expressing adiponectin has been reported have reduced plasma free fatty acid concentrations, higher expression levels of brown fat specific markers PRDM16 and Cidea and 2-fold more brown fat mass (34). Our combined in vitro and in vivo approach to investigate the specific role of Mst in the regulation of BAT differentiation has significant advantage over recently published report using isolated primary brown preadipocytes (19), which does not test the ability of Mst inhibition in promoting the conversion of inter-muscular white adipocytes to brown fat or trans-differentiation of WAT to BAT in different fat depots.
One of the current strategies to combat obesity and related metabolic syndromes is to identify novel targets to promote BAT differentiation program in various organs in order to burn more calories, enhance triglyceride clearance and glucose disposal. Using primary cultures of differentiating WT and Mst KO MEFs, we demonstrate that Mst inhibition could promote “brown-fat like” phenotype and up-regulate key genes and proteins involved in energy expenditure and regulation of lipid metabolism. Therefore, inhibition of Mst through a novel class of Mst antagonists could provide rationale justification not only for promoting muscle mass but also for the treatment of obesity and related metabolic syndromes through enhanced BAT differentiation in skeletal muscle and white adipose tissues.
Acknowledgments
Mst heterozygous male and female mice were obtained from Dr. S-J Lee; Department of Molecular Biology and Genetics, Johns Hopkins University School of Medicine, Baltimore, MD. The authors acknowledge help from Dr. Timothy F Lane, Department of Ob/Gyn at UCLA in isolation of MEF primary cultures. This work was supported by National Institute of Health Grant SC1AG033407 (R.S.), and in part by 1SC1CA165865-01A1 (S.P.), Drew/UCLA Cancer Center Partnership grant 5U54CA143931, and Charles Drew University MSI endowment sub-award (5S21MD000103, R.S.).
Footnotes
The authors have no conflict of interest to disclose
Disclosure Statement
The authors declare no conflict of interest.
References
- 1.McPherron AC, Lawler AM, Lee SJ. Regulation of skeletal muscle mass in mice by a new TGF-beta superfamily member. Nature. 1997;387(6628):83–90. doi: 10.1038/387083a0. [DOI] [PubMed] [Google Scholar]
- 2.Lee SJ, McPherron AC. Regulation of myostatin activity and muscle growth. Proc Natl Acad Sci U S A. 2001;98(16):9306–11. doi: 10.1073/pnas.151270098. [DOI] [PMC free article] [PubMed] [Google Scholar]
- 3.McPherron AC, Lee SJ. Suppression of body fat accumulation in myostatin-deficient mice. J Clin Invest. 2002;109(5):595–601. doi: 10.1172/JCI13562. [DOI] [PMC free article] [PubMed] [Google Scholar]
- 4.Schuelke M, Wagner KR, Stolz LE, et al. Myostatin mutation associated with gross muscle hypertrophy in a child. N Engl J Med. 2004;350(26):2682–8. doi: 10.1056/NEJMoa040933. [DOI] [PubMed] [Google Scholar]
- 5.Choi SJ, Yablonka-Reuveni Z, Kaiyala KJ, et al. Increased energy expenditure and leptin sensitivity account for low fat mass in myostatin-deficient mice. Am J Physiol Endocrinol Metab. 2011;300(6):E1031–7. doi: 10.1152/ajpendo.00656.2010. [DOI] [PMC free article] [PubMed] [Google Scholar]
- 6.Bernardo BL, Wachtmann TS, Cosgrove PG, et al. Postnatal PPARdelta activation and myostatin inhibition exert distinct yet complimentary effects on the metabolic profile of obese insulin-resistant mice. PLoS One. 2010;5(6):e11307. doi: 10.1371/journal.pone.0011307. [DOI] [PMC free article] [PubMed] [Google Scholar]
- 7.Zhang C, McFarlane C, Lokireddy S, et al. Inhibition of myostatin protects against diet-induced obesity by enhancing fatty acid oxidation and promoting a brown adipose phenotype in mice. Diabetologia. 2012;55(1):183–93. doi: 10.1007/s00125-011-2304-4. [DOI] [PubMed] [Google Scholar]
- 8.Cannon B, Nedergaard J. Metabolic consequences of the presence or absence of the thermogenic capacity of brown adipose tissue in mice (and probably in humans) Int J Obes (Lond) 2010;34(Suppl 1):S7–16. doi: 10.1038/ijo.2010.177. Review. [DOI] [PubMed] [Google Scholar]
- 9.Nedergaard J, Bengtsson T, Cannon B. New powers of brown fat: fighting the metabolic syndrome. Cell Metab. 2011;13(3):238–40. doi: 10.1016/j.cmet.2011.02.009. [DOI] [PubMed] [Google Scholar]
- 10.Golozoubova V, Hohtola E, Matthias A, et al. Only UCP1 can mediate adaptive nonshivering thermogenesis in the cold. FASEB J. 2001;15(11):2048–50. doi: 10.1096/fj.00-0536fje. [DOI] [PubMed] [Google Scholar]
- 11.Feldmann HM, Golozoubova V, Cannon B, et al. UCP1 ablation induces obesity and abolishes diet-induced thermogenesis in mice exempt from thermal stress by living at thermoneutrality. Cell Metab. 2009;9(2):203–9. doi: 10.1016/j.cmet.2008.12.014. [DOI] [PubMed] [Google Scholar]
- 12.Lowell BB, S-Susulic V, Hamann A, et al. Development of obesity in transgenic mice after genetic ablation of brown adipose tissue. Nature. 1993;366(6457):740–2. doi: 10.1038/366740a0. [DOI] [PubMed] [Google Scholar]
- 13.Seale P, Kajimura S, Yang W, et al. Transcriptional control of brown fat determination by PRDM16. Cell Metab. 2007;6(1):38–54. doi: 10.1016/j.cmet.2007.06.001. [DOI] [PMC free article] [PubMed] [Google Scholar]
- 14.Kajimura S, Seale P, Tomaru T, et al. Regulation of the brown and white fat gene programs through a PRDM16/CtBP transcriptional complex. Genes Dev. 2008;22(10):1397–409. doi: 10.1101/gad.1666108. [DOI] [PMC free article] [PubMed] [Google Scholar]
- 15.Schulz TJ, Huang TL, Tran TT, et al. Identification of inducible brown adipocyte progenitors residing in skeletal muscle and white fat. Proc Natl Acad Sci U S A. 2011;108(1):143–8. doi: 10.1073/pnas.1010929108. [DOI] [PMC free article] [PubMed] [Google Scholar]
- 16.Almind K, Manieri M, Sivitz WI, et al. Ectopic brown adipose tissue in muscle provides a mechanism for differences in risk of metabolic syndrome in mice. Proc Natl Acad Sci U S A. 2007;104(7):2366–71. doi: 10.1073/pnas.0610416104. [DOI] [PMC free article] [PubMed] [Google Scholar]
- 17.Timmons JA, Wennmalm K, Larsson O, et al. Myogenic gene expression signature establishes that brown and white adipocytes originate from distinct cell lineages. Proc Natl Acad Sci U S A. 2007;104(11):4401–6. doi: 10.1073/pnas.0610615104. [DOI] [PMC free article] [PubMed] [Google Scholar]
- 18.Seale P, Bjork B, Yang W, et al. PRDM16 controls a brown fat/skeletal muscle switch. Nature. 2008;454(7207):961–7. doi: 10.1038/nature07182. [DOI] [PMC free article] [PubMed] [Google Scholar]
- 19.Kim WK, Choi HR, Park SG, et al. Myostatin inhibits brown adipocyte differentiation via regulation of Smad3-mediated β-catenin stabilization. Int J Biochem Cell Biol. 2012;44(2):327–34. doi: 10.1016/j.biocel.2011.11.004. [DOI] [PubMed] [Google Scholar]
- 20.Bartelt A, Bruns OT, Reimer R, et al. Brown adipose tissue activity controls triglyceride clearance. Nat Med. 2011;17(2):200–5. doi: 10.1038/nm.2297. [DOI] [PubMed] [Google Scholar]
- 21.Seale P, Conroe HM, Estall J, et al. Prdm16 determines the thermogenic program of subcutaneous white adipose tissue in mice. J Clin Invest. 2011;121(1):96–105. doi: 10.1172/JCI44271. [DOI] [PMC free article] [PubMed] [Google Scholar]
- 22.Singh R, Artaza JN, Taylor WE, et al. Testosterone inhibits adipogenic differentiation in 3T3-L1 cells: nuclear translocation of androgen receptor complex with beta-catenin and T-cell factor 4 may bypass canonical Wnt signaling to down-regulate adipogenic transcription factors. Endocrinology. 2006;147(1):141–54. doi: 10.1210/en.2004-1649. [DOI] [PMC free article] [PubMed] [Google Scholar]
- 23.Singh R, Bhasin S, Braga M, et al. Regulation of myogenic differentiation by androgens: cross talk between androgen receptor/ beta-catenin and follistatin/transforming growth factor-beta signaling pathways. Endocrinology. 2009;150(3):1259–68. doi: 10.1210/en.2008-0858. [DOI] [PMC free article] [PubMed] [Google Scholar]
- 24.Braga M, Bhasin S, Jasuja R, et al. Testosterone inhibits transforming growth factor-β signaling during myogenic differentiation and proliferation of mouse satellite cells: Potential role of follistatin in mediating testosterone action. Mol Cell Endocrinol. 2012;350(1):39–52. doi: 10.1016/j.mce.2011.11.019. [DOI] [PMC free article] [PubMed] [Google Scholar]
- 25.Enerback S. Research and Perspectives in Endocrine Interactions. Springer-Verlag; Berlin Heidelberg: 2010. Brown Adipose Tissue In Humans: A New Target for Anti-Obesity Therapy. Novel Insights into Adipose Cell Functions; pp. 61–66. [DOI] [Google Scholar]
- 26.Virtanen KA, Lidell ME, Orava J, et al. Functional brown adipose tissue in healthy adults. N Engl J Med. 2009;360(15):1518–25. doi: 10.1056/NEJMoa0808949. Erratum in: N Engl J Med 2009, 361 (11) 1123. [DOI] [PubMed] [Google Scholar]
- 27.Ahima RS. Adipose tissue as an endocrine organ. Obesity (Silver Spring) 2006;14 (Suppl 5):242S–249S. doi: 10.1038/oby.2006.317. [DOI] [PubMed] [Google Scholar]
- 28.Cantó C, Gerhart-Hines Z, Feige JN, Lagouge M, Noriega L, Milne JC, Elliott PJ, Puigserver P, Auwerx J. AMPK regulates energy expenditure by modulating NAD+ metabolism and SIRT1 activity. Nature. 2009;458(7241):1056–60. doi: 10.1038/nature07813. [DOI] [PMC free article] [PubMed] [Google Scholar]
- 29.Scherer PE, Williams S, Fogliano M, et al. A novel serum protein similar to C1q, produced exclusively in adipocytes. J Biol Chem. 1995;270(45):26746–9. doi: 10.1074/jbc.270.45.26746. [DOI] [PubMed] [Google Scholar]
- 30.Hu E, Liang P, Spiegelman BM. AdipoQ is a novel adipose-specific gene dysregulated in obesity. J Biol Chem. 1996;271(18):10697–703. doi: 10.1074/jbc.271.18.10697. [DOI] [PubMed] [Google Scholar]
- 31.Asterholm IW, Scherer PE. Enhanced metabolic flexibility associated with elevated adiponectin levels. Am J Pathol. 2010;176(3):1364–76. doi: 10.2353/ajpath.2010.090647. [DOI] [PMC free article] [PubMed] [Google Scholar]
- 32.Combs TP, Pajvani UB, Berg AH, et al. A transgenic mouse with a deletion in the collagenous domain of adiponectin displays elevated circulating adiponectin and improved insulin sensitivity. Endocrinology. 2004;145(1):367–83. doi: 10.1210/en.2003-1068. [DOI] [PubMed] [Google Scholar]
- 33.Arita Y, Kihara S, Ouchi N, et al. Paradoxical decrease of an adipose-specific protein, adiponectin, in obesity. Biochem Biophys Res Commun. 1999;257(1):79–83. doi: 10.1006/bbrc.1999.0255. [DOI] [PubMed] [Google Scholar]
- 34.Shetty S, Ramos-Roman MA, Cho YR, et al. Enhanced fatty acid flux triggered by adiponectin overexpression. Endocrinology. 2012;153(1):113–22. doi: 10.1210/en.2011-1339. [DOI] [PMC free article] [PubMed] [Google Scholar]


