

Abstract
Nonhuman animals are highly proficient at judging relative quantities presented in a variety of formats including visual, auditory, and even cross modal formats. Performance typically is constrained by the ratio between sets, as would be expected under Weber's Law, and as is described in the Approximate Number System (ANS) hypothesis. In most cases, tests are designed to avoid any perceptual confusion for animals regarding the stimulus sets, but despite this, animals show some of the perceptual biases that humans show based on organization of stimuli. Here, we demonstrate an additional perceptual bias that emerges from the illusion of nested sets. When arrays of circles were presented on a computer screen and were to be classified as larger than or as smaller than an established central value, rhesus monkeys (Macaca mulatta) underestimated quantities when circles were nested within each other. This matched a previous report with adult humans (Chesney & Gelman, 2012), indicating that macaques, like humans, show the pattern of biased perception predicted by ANS estimation. Although some macaques overcame this perceptual bias demonstrating that they could come to view nested stimuli as individual elements to be included in the estimates of quantity used for classifying arrays, the majority of the monkeys showed the bias of underestimating nested arrays throughout the experiment.
Keywords: Quantity Judgments, Nested Stimuli, Bisection, Approximate Numerical System, Rhesus Monkeys, Macaca mulatta
For more than 100 years, comparative psychologists and other researchers have attempted to demonstrate the capacities (and limitations) on the numerical cognition of nonhuman animals. This massive research area encompasses many dozens of testing paradigms designed to assess counting-like behavior, arithmetic competencies, rapid perception of quantities, the matching of stimuli based on their numerousness, and violations of expectations based on quantity information. Perhaps the most widely used test is the relative quantity judgment (RQJ), which entails making a choice between two or more sets or arrays on the basis of a relative judgment such as the larger array of food items. The list of species passing such tests grows each year, and now includes fish (Agrillo, Dadda, Serena, & Bisazza, 2008; Agrillo, Piffer, & Bisazza, 2011; Piffer, Agrillo, & Hyde, 2012), amphibians (Krusche, Uller, & Dicke, 2010; Uller et al., 2003), birds (Emmerton, 1998; Rugani, Regolin, & Vallortigara, 2008), and many mammals including voles (Ferkin, Pierce, Sealand, & delBarco-Trillo, 2005), dogs (Ward & Smuts, 2007), bears (Vonk & Beran, 2012), elephants (Irie-Sugimoto, Kobayashi, Sato, & Hasegawa, 2009; Perdue, Talbot, Stone, & Beran, 2012), marine mammals (Abramson, Hernandez-Lloreda, Call, & Colmenares, 2011; Jaakkola, Fellner, Erb, Rodriguez, & Guarino, 2005) and nonhuman primates (e.g., Addessi, Crescimbene, & Visalberghi, 2008; Anderson, Stoinski, Bloomsmith, & Maple, 2007, Anderson et al., 2005; Beran, 2001, 2004, 2012; Beran & Beran, 2004; Call, 2000; Evans, Beran, Harris, & Rice, 2009; Hanus &Call, 2007; Tomonaga, 2007).
Despite the many successful attempts to demonstrate proficiency in making quantity judgments and using numerical cues, a small number of studies have looked at how animals, like humans, might fall prey to illusions that disrupt the processing of quantitative information. For example, humans often overestimate the number of items in regularly arranged stimulus sets compared to randomly arranged sets, and stimuli that are arranged in straight rows and columns will produce higher estimates of their numerosity than arrays that are randomly scattered over the same area (Ginsburg, 1976, 1980). When asked to select the larger of two arrays of dots, one of which was regularly distributed and the other randomly distributed, humans, chimpanzees, and rhesus monkeys all selected the regularly arranged set at levels significantly higher than chance even when both arrays had the same number of items (Beran, 2006), thereby showing a similarity in this perceptual illusion.
Another illusion that may play a critical role in understanding the mechanism for quantitative representation concerns the nesting of visual stimuli within themselves. Chesney and Gelman (2012) presented human participants with a judgment task in which a number of briefly presented sets of circles were shown on a computer screen and had to be compared to an Arabic numeral that was presented right after that set of circles. Participants responded as to whether the number of circles was greater than the value of the numeral that was presented. Sometimes, the circles did not overlap each other on the screen, but in other conditions there was overlap such that the circles appeared as nested within each other. The authors anticipated that this arrangement would create difficulty for the participants because the nesting would make it more difficult to individuate the circles and properly enumerate or estimate their number. If these nested stimuli led to “missed” counts of some of the circles because of their arrangement, those counts could not be added to the tally for the whole set. Normally, without such misses, and under conditions of briefly presented stimuli (Kaufman, Lord, Reese, & Volkmann, 1949) or situations in which formal counting was prevented (Beran, Taglialatela, Flemming, James, & Washburn, 2006; Cordes, Gelman, Gallistel, & Whalen, 2001), humans were fairly good at estimating such quantities, although their performance followed the predictions of Weber's Law as estimates become less precise and more variable as a function of the true array size getting larger (Gallistel & Gelman, 2000). However, when Chesney and Gelman (2012) presented the nested sets, participants' response times were longer and their estimations were lower for those sets compared to sets without nested configurations. This led the authors to conclude that these kinds of stimulus organization can lead to missed enumeration of some stimuli, as predicted by the Approximate Number System (ANS) hypothesis for numerical estimation. Specifically, a mechanism such as the theoretical accumulator, which operates in the ANS to tally each encountered/perceived stimulus in an array that is being quantified (Meck & Church, 1983), cannot deal with the failed individuation of those nested stimuli. This may be because it does not perceive these stimuli as individual units but rather as one entity, and thus it underestimates the overall number of items in the array (see Chesney & Gelman, 2012).
Rhesus monkeys, like many other animals, show the hallmark response patterns reflective of the ANS and the accumulator model as originally demonstrated in work with rats (Meck & Church, 1983). This has led to the suggestion that something like the accumulator may be at work in the representations underlying quantity judgments in these animals as well (e.g., Beran, 2007, 2008; Brannon & Terrace, 2000; Cantlon & Brannon, 2006, 2007; Jordan & Brannon, 2006a, 2006b; Nieder, Friedman, & Miller, 2002; Nieder & Miller, 2003, 2004). If so, they too should be susceptible to this kind of perceptual illusion from the nesting of stimuli, and the present study assessed this possibility using similar methodology. We presented rhesus monkeys with stimuli that were either nested or were not, and we made use of a judgment task called the bisection test (e.g., Beran, Johnson-Pynn, & Ready, 2008; Droit-Volet, Clement, & Fayol, 2003; Jordan & Brannon, 2006a, 2006b; Roberts, 2005). In this test, an established central value determines whether presented stimuli are classified as either smaller or larger than that central value. Often, only anchor stimuli are trained, and then more central values are presented to see where the bisection point occurs for a participant (e.g., Jordan & Brannon, 2006a), whereas other times all classifications are reinforced, and performance typically is lowest for values closest to the central value (e.g., Beran, Smith, Redford, & Washburn, 2006). Here, we rewarded or punished all responses, but anticipated that performance would differ for nested and non-nested arrays.
We predicted that for control arrays, without nesting, performance would be lowest near the central value and would be generally high overall. But, for nested arrays, we predicted that the monkeys would consistently underestimate the total quantity of the array and make classification errors accordingly, particularly by make more “small” responses to sets that actually exceeded the central value. However, we also anticipated that the monkeys might be capable of overcoming that perceptual illusion, if it occurred, when they had more experience.
Methods
Participants
We tested eight adult male rhesus macaques (Macaca mulatta). These monkeys had previously been trained to use a joystick with their hands to control a cursor on a computer screen (see Richardson, Washburn, Hopkins, Savage-Rumbaugh, & Rumbaugh, 1990; Washburn & Rumbaugh, 1992). They all had participated in numerous previous computerized experiments including a large variety of tests of numerical cognition and quantity judgment (e.g., Beran, 2007, 2008; Beran et al., 2008). They had continuous access to water, and worked for fruit flavored primate pellets. They also received a daily diet of fruits and vegetables independent of the amount of work they completed on the task.
Materials
Trials were presented on a personal computer with an attached 17-inch color monitor. Joystick responses were made with a digital joystick mounted vertically to the cage. The test program was written in Visual Basic. Food rewards (94 mg Bio-Serv food pellets) were automatically dispensed by the computer for correct responses along with auditory feedback. Incorrect responses led to a 20 s timeout period with associated auditory feedback, during which time the screen remained blank.
Design and Procedure
At the start of each session, monkeys saw only two trials types – non-nested arrays of either 3 or 9 circles, of varying sizes, presented on the screen until they made a response, and they had to classify those stimuli as either Small (by moving the cursor to the stimulus on the bottom left of the screen) or Large (by moving the cursor to the stimulus on the bottom right of the screen; Figure 1). This was the training phase, and also was used later in the experiment as a reminder phase at the start of each test session as these monkeys completed different tasks throughout the day. The criterion for moving to the test part of the experiment was correct responses to 20 of the most recent 25 trials. Seven of the eight monkeys learned this task quickly, and on most sessions were meeting this daily criterion within or just beyond the minimum number of trials needed. However, one monkey, Hank, struggled nearly every session to meet this criterion, and after 10 such failed sessions was discontinued in the experiment without ever reaching the test phase.
Figure 1.
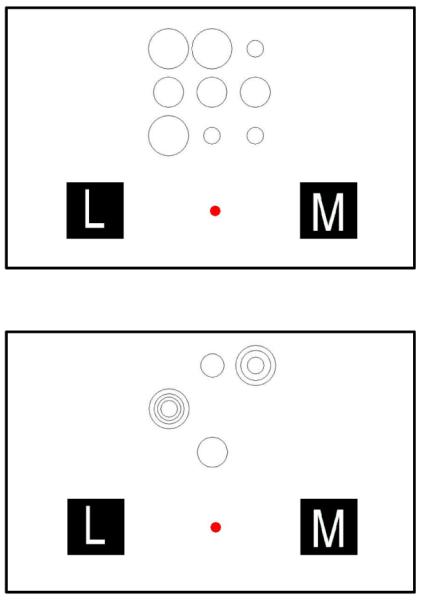
Example trial type. The top box shows a control trial with non-nested stimuli, with nine circles, that should be classified as a “More” (M). The bottom box also shows nine circles, but now nested in four locations. This should also be classified as a “More” (M).
After reaching the training criterion, the computer program then established the central value for the current testing session (5, 6, or 7). This value bisected the range of circle quantities for the session into the Small and Large categories. There was no visual indicator as to the central value, so the monkeys had to learn this through trial and error. Now, arrays of 3 to 9 circles (but not arrays equal to the central value for the current session) were presented randomly across trials until a response was made with the restriction that approximately half of the arrays were larger than the central value and half of the arrays were smaller than the central value. Monkeys continued to classify each array of circles as Small or Large, and they received a food pellet and melodic tone for correct responses and a 20 second timeout (blank screen) and buzz tone for incorrect responses. Monkeys completed as many trials as they chose during 4-hour test sessions.
There were two trial types presented in each testing session. One was the control condition, in which all circles were separated and did not overlap in any way. The other was the nested condition, in which at least two circles were nested within each other, and as many as four circles could be nested within one spatial location (see Figure 1). This nesting was randomly generated by taking the value on the trial and then equally often nesting 2, 3, or 4 stimuli (if that many were presented) within the same location. This produced the kinds of visual arrays shown in Figure 1. However, the rule was the same for classifying the array, and three nested stimuli still “counted” as three tallies toward that array's total quantity.
For each central value, 1,500 trial blocks were presented, and then the central value changed (but never within the same session – instead, sessions ended when the 1,500 trial limit had been reached with a particular central value, which may have taken more than one session to complete). Nested and control conditions were randomly presented within a testing session, with approximately half of the trials occurring in each condition. The three central values were presented three times each, in random order, but with each 3-block run of 1500 trials involving each of the central values once. Thus, the overall presentation order of the central values was 6-5-7-5-7-6-7-6-5.
Results
Figure 2 depicts group-level performance as a function of condition and set size across all central values for all three blocks. A within subjects repeated-measures analysis of variance (ANOVA) was conducted to examine the effect of set size, condition (control or nested), and block (first, second, or third set of 1,500 trials) on quantity classifications (percentage of trials on classifying the stimulus as larger than the central value) for each central value (5, 6, and 7).
Figure 2.
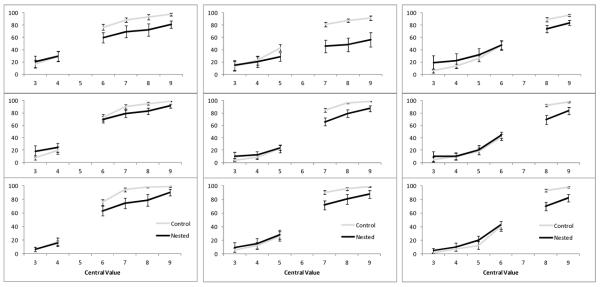
Mean percentage of “larger” responses for each block of 1,500 trials at each central value. The first column shows, from top to bottom, the first, second, and third runs of 1,500 trials with central value 5. The middle column shows, from top to bottom, the first, second, and third runs of 1,500 trials with central value 6. The right column shows, from top to bottom, the first, second, and third runs of 1,500 trials with central value 7. Performance in all panels is shown for control trials (in grey) and nested trials (in black). Errors bars represent standard errors of the mean.
For the central value 5, there was not a significant main effect of condition, F (1, 60) = 4.03, p =.09, ηp2 =.40, not a significant main effect of block, F (2, 60) = 0.34, p =.72, ηp2 =.05, but there was a significant main effect of set size, F (5, 60) = 68.0, p < .001, ηp2 =.92. There was not a significant interaction between condition and block, F (2, 60) = 0.62, p =.56, ηp2 =.09, but there was a significant interaction between condition and set size, F (5, 60) = 8.81, p < .001, ηp2 =.50, and between block and set size, F (10, 60) = 6.33, p < .001, ηp2 =.51. There was not a significant three-way interaction, F (10, 60) = 0.57, p =.83, ηp2 =.09. The critical comparison for the illusion pertained to the condition variable, and so we conducted post hoc paired samples t-tests comparing performance in the control and nested conditions at each set size. For central value 5, performance was significantly different across the two conditions for set sizes 7 (t(6) = 3.02, p = .023), 8 (t(6) = 3.20, p = .02), and 9 (t(6) = 3.79, p = .009), but not set sizes 3 (t(6) = −0.91, p = .40), 4 (t(6) = −0.26, p = .80), or 6 (t(6) = 1.89, p = .11). In the cases where there was a significant difference, the monkeys classified the arrays as Large at a higher percentage in the control condition that in the nested condition.
For the central value 6, there was not a significant main effect of block, F (2, 60) = 1.34, p =.30, ηp2 =.18, but there was a significant main effect of condition, F (1, 60) = 7.42, p =.034, ηp2 =.55, and there was a significant main effect of set size, F (5, 60) = 92.59, p < .001, ηp2 =.94. There was not a significant interaction between condition and block, F (2, 60) = 2.48, p =.13, ηp2 =.29, but there was a significant interaction between condition and set size, F (5, 60) = 23.37, p 2 < .001, ηp2 =.80, and between block and set size, F (10, 60) = 13.45, p < .001, ηp2 =.69. There was not a significant three-way interaction, F (10, 60) = 1.26, p =.27, ηp2 =.17. For central value 6, performance was significantly different across the two conditions for set sizes 7 (t(6) = 4.64, p = .004), 8 (t(6) = 4.20, p = .006), and 9 (t(6) = 4.52, p = .00), but not set sizes 3 (t(6) = −1.04, p =.34), 4 (t(6) = −0.35, p = .74), or 5 (t(6) = 0.79, p = .46). In the cases where there was a significant difference, the monkeys classified the arrays as Large at a higher percentage in the control condition that in the nested condition.
For the central value 7, there was not a significant main effect of condition, F (1, 60) = 0.45, p =.53, ηp2 =.07, not a significant main effect of block, F (2, 60) = 3.10, p =.08, ηp2 =.34, but there was a significant main effect of set size, F (5, 60) = 81.25, p < .001, ηp2 =.93. There was not a significant interaction between condition and block, F (2, 60) = 0.25, p =.78, ηp2 =.04, but there was a significant interaction between condition and set size, F (5, 60) = 12.20, p < .001, ηp2 =.67, and between block and set size, F (10, 60) = 3.11, p = .003, ηp2 =.34. There was not a significant three-way interaction, F (10, 60) = 1.19, p =.31, ηp2 =.16. For central value 7, performance was significantly different across the two conditions for set sizes 8 (t(6) = 3.95, p = .007), and 9 (t(6) = 3.59, p = .011), but not set sizes 3 (t(6) = 1.40, p = .21), 4 (t(6) = −89, p = .41), 5 (t(6) = −1.03, p = .34), or 6 (t(6) = −.23, p = .83). In the cases where there was a significant difference, the monkeys classified the arrays as Large at a higher percentage in the control condition that in the nested condition.
It is important to note that we saw some large individual differences in the performance of these monkeys. Some monkeys strongly showed the pattern reported above, where they made many more mistakes with nested arrays than with non-nested arrays when set sizes were large. However, some monkeys performed nearly identically in both conditions, especially after some experience with this task. To illustrate this range of individual differences, we present the performances of three monkeys in the online supplementary materials. These are not the only monkeys that showed a difference across conditions. Most monkeys, in most blocks across the central values, showed the separation in performance between nested and control conditions for the “large” values that were presented. These three monkeys illustrate the variability that occurred across the sample.
Given the effect that nesting had on performance, one expectation should be that arrays in the Nested condition that had a higher degree of nesting (i.e., a smaller number of discrete circle subsets) should have led to particularly poor performance, because these arrays would appear to be of particularly small numbers of items (even though they truly were not if one counted the circles nested within each other). To examine this possibility, we selected a subset of the data for further analysis. Specifically, for the first block of 1,500 trials at each central value for each monkey, we looked at mean performance on “Large” trials (those exceeding the central value) in the Nested condition as a function of the number of discrete circle sets in the array. This could range from 2 to 7 discrete sets, in terms of how many unique outer circles were present. Here, a smaller number typically would indicate more nesting relative to a larger number for the same cardinal number of circles in the entire array. The results of this analysis are shown in Figure 3. A repeated measures ANOVA indicated a significant difference in performance as a function of the number of unique and discrete subsets shown within the array, F (5, 30) = 6.58, p < .001, ηp2=.52.
Figure 3.
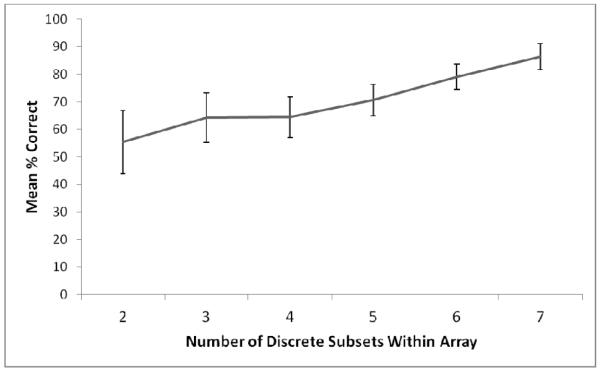
Mean percentage of correctly made “larger” responses for the subset of trials examined (see text) to determine the effects of more or less nesting on performance. Smaller numbers of discrete subsets would typically mean greater nesting of the circles in the array, and this led to lower overall performance. Error bars represent standard errors of the mean.
We also analyzed a subset of the response time data from the monkeys, to determine whether there were differential effects of the form of presentation of the arrays (nested or not) on response time. To do this, we again examined for each monkey the first 1,500 trial block with each central value, analyzing only the correctly completed trials. We removed any trials with response times longer than 10 seconds, as these were extreme outliers (these constituted less than 0.5% of the trials for all of the monkeys). We compared performance between the two conditions for each monkey using a one-way ANOVA, and the results for each monkey are presented in Table 1. In nearly all cases where there was a significant difference in response time across conditions, monkeys were slower to respond to nested arrays than to control arrays. However, it is important to note that these differences in response time were only fractional (i.e., in terms of the tenth of a second).
Table 1.
Response time (RT) data (in seconds) for each monkey for the first block with each central value. Only correctly completed trials were included in these analyses.
| Monkey | Central Value | Control RT | Nested RT | ANOVA |
|---|---|---|---|---|
| Chewie | 5 | 1.05 | 1.03 | F (1, 929) = .11, p = .74 |
| 6 | 0.84 | 1.00 | F (1, 851) = 2.03, p = .55 | |
| 7 | 0.95 | 0.93 | F (1, 967) = 0.56, p = .45 | |
| Gale | 5 | 0.93 | 0.96 | F (1, 1125) = 2.75, p = .10 |
| 6* | 1.00 | 1.05 | F (1, 1126) = 7.63, p = .006 | |
| 7 | 0.96 | 0.93 | F (1, 1039) = 2.62, p = .11 | |
| Han | 5* | 1.09 | 1.02 | F (1, 1118) = 9.26, p =.002 |
| 6 | 1.26 | 1.26 | F (1, 1112) = 01, p = .91 | |
| 7 | 1.08 | 1.11 | F (1, 1229) = .74, p = .39 | |
| Lou | 5* | 1.12 | 1.25 | F (1, 1406) = 22.83, p < .001 |
| 6* | 1.14 | 1.35 | F (1, 1204) = 61.30, p < .001 | |
| 7* | 1.01 | 1.16 | F (1, 1386) = 57.37, p < .001 | |
| Luke | 5 | 0.92 | 0.92 | F (1, 1085) = 0.0, p = .98 |
| 6 | 1.00 | 1.04 | F (1, 1096) = 2.32, p = .13 | |
| 7 | 0.94 | 0.95 | F (1, 1163) = 0.33, p = .56 | |
| Murph | 5* | 1.00 | 1.22 | F (1, 1369) = 63.04, p < .001 |
| 6* | 1.08 | 1.46 | F (1, 1258) = 125.82, p < .001 | |
| 7* | 1.08 | 1.24 | F (1, 1369) = 23.21, p < .001 | |
| Obi | 5* | 1.23 | 1.38 | F (1, 1141) = 12.28, p < .001 |
| 6 | 1.31 | 1.36 | F (1, 973) = 1.61, p = .21 | |
| 7* | 1.25 | 1.33 | F (1, 1219) = 8.60, p = .003 |
Note. Asterisks under the Central Value column indicate a significant different in response time between nested and control trials.
Discussion
Like humans (Chesney & Gelman, 2012), as a group rhesus monkeys demonstrated the perceptual bias affecting quantity judgments of visual arrays that emerges with the appearance of nested sets. Specifically, when monkeys classified sets of circles as larger or smaller than an established central value, they underestimated the quantity of stimuli in nested sets in which some circles were contained inside of each other. Although some macaques overcame this perceptual bias with experience over time, or were relatively immune to the bias from the outset of testing, the majority of the monkeys continued to show this bias throughout the experiment (see supplemental materials for examples of the range of performances seen in the monkeys).
The main outcome of the experiment was a difference in performance between conditions with or without nested stimuli whereby the monkeys performed poorer with large sets that were nested compared to those that were not. However, it is important to recognize that even with this difference performance with “large” nested arrays was still at or above the 50% correct level for all blocks with all central values, including the first blocks. So, the monkeys were classifying these arrays as being “large” even though they were under-representing the quantities in those sets relative to control sets. Had the monkeys always seen those nested arrays as being only singular items on the screen, they would not have been able to perform at these levels, even if that performance was not as high as in the control condition. This was true even when nesting was more pronounced and there were fewer discrete and unique subsets on the screen, although this certainly had the most detrimental effect on performance.
Some monkeys showed longer response times when stimuli were presented as nested arrays rather than non-nested arrays, although this was only the case for a minority of individuals. So, it is perhaps the case that these individuals were employing (or trying to employ) a more controlled serial enumeration process for nested arrays. However, we are hesitant to conclude this, given that these significant differences still reflected only a very small absolute difference in response times (usually a difference measured in tenths of a second at most), and so it is not clear how the monkeys are processing these arrays. Ideally, future studies could employ eye-tracking techniques to determine how the monkeys are looking at arrays when they are nested or non-nested.
Monkeys' quantity judgments, like those of humans in some circumstances, are critically dependent upon the tallying of individual items by the accumulator to accurately estimate the quantity of a given set (Meck & Church, 1983). Sets of nested items are, by definition, not presented separately but instead overlap or are contained within one another, and this appears to present a problem for accurate enumeration and estimation of quantity. Previous research indicated that nesting impedes one's ability to preattentively individuate items as is necessary to properly enumerate and tally sets of items (Trick & Enns, 1997; Trick & Pylyshyn, 1993, 1994). The present results indicate that monkeys also have difficulty individuating, and subsequently enumerating, nested items as well as they can do with spatially discontiguous items, and this negatively affects their quantity judgments.
Chesney and Gelman (2012) stated that the results of their experiment “match the predicted performance of an item-based system enumerating simultaneously presented items under conditions where impaired individuation increases miss rates” (pp. 1110). We propose that monkeys may show the same susceptibility in their ANS performance, and likely may even share with humans some of the subjective experiences of (mis)perceiving these kinds of arrays. Chesney and Gelman (2012) discussed some of the strategies that their participants reported as they came to realize that they were underestimating the quantity of items in nested arrays, including making themselves increase their estimates beyond what they thought they had seen. We anticipated that the monkeys, given the large number of trials they were presented, might also come to compensate (or even overcompensate) for the perceptual bias by choosing the Large response more often when they noticed nested stimuli, especially given that our stimuli remained on the screen until a response was made. Although some monkeys did improve on nested trials, many still underperformed relative to the control condition in nearly all blocks at all central values. This indicates that the bias is robust, and is likely a natural by-product of the nature of nested stimuli as they are processed by the ANS that monkeys share with humans. That said, it is critical to note here that our test with the monkeys was not a numerical judgment necessarily but was a quantity judgment because the number of circles in the arrays often co-varied with more continuous stimulus properties, such as pixel illumination amount, or other non-numeric features in those arrays.
Chesney and Gelman (2012) suggested there might be individual differences in how perceptual variables impact ANS estimation and speculated that these differences may relate to the development of mathematical abilities (see Halberda, Mazzocco, & Feigenson, 2008, for a discussion of the link between ANS acuity and math skill). Such individual differences existed in the performance of the monkeys in the current study. Not all monkeys were subject to the bias to the same extent, with some monkeys revealing an extreme sensitivity to the perceptual illusion (e.g., monkey Han) whereas others quickly came to give accurate quantity estimations of both control and test sets (e.g., monkey Luke). Interestingly, some monkeys (e.g., Lou) never showed the perceptual illusion, correctly estimating both nested and non-nested arrays as greater or lesser than the established central value. Whether such individual differences across monkeys also relate to more general numerical cognition skills in that species remains to be determined. Our present conclusion is that perceptual features of nested stimuli seem to impact quantity judgments across species in similar ways, thereby highlighting the likelihood that these perceptual biases are deeply rooted in a shared evolutionary history of approximate estimation of quantity and numerosity.
Supplementary Material
Acknowledgments
This research project was supported by Grant HD-060563 from the National Institute of Child Health and Human Development. Audrey Parrish was supported, in part, by a 2CI Primate Social Cognition Fellowship from Georgia State University.
References
- Abramson JZ, Hernandez-Lloreda V, Call J, Colmenares F. Relative quantity judgments in South American sea lions (Otaria flavescens) Animal Cognition. 2011;14:695–706. doi: 10.1007/s10071-011-0404-7. DOI 10.1007/s10071-011-0404-7. [DOI] [PubMed] [Google Scholar]
- Addessi E, Crescimbene L, Visalberghi E. Food and quantity token discrimination in capuchin monkeys (Cebus apella) Animal Cognition. 2008;11:275–282. doi: 10.1007/s10071-007-0111-6. doi:10.1007/s10071-007-0111-6. [DOI] [PubMed] [Google Scholar]
- Agrillo C, Dadda M, Serena G, Bisazza A. Do fish count? Spontaneous discrimination of quantity in female mosquitofish. Animal Cognition. 2008;11:495–503. doi: 10.1007/s10071-008-0140-9. doi:10.1007/s10071-008-0140-9. [DOI] [PubMed] [Google Scholar]
- Agrillo C, Piffer L, Bisazza A. Number versus continuous quantity in numerosity judgments by fish. Cognition. 2011;119:281–287. doi: 10.1016/j.cognition.2010.10.022. doi:10.1016/j.cognition.2010.10.022. [DOI] [PubMed] [Google Scholar]
- Anderson US, Stoinski TS, Bloomsmith MA, Maple TS. Relative numerousness judgment and summation in young, middle-aged, and old adult orangutans (Pongo pygmaeus abelii and Pongo pygmaeus pygmaeus) Journal of Comparative Psychology. 2007;121:1–11. doi: 10.1037/0735-7036.121.1.1. doi:10.1037/0735-7036.121.1.1. [DOI] [PubMed] [Google Scholar]
- Anderson US, Stoinski TS, Bloomsmith MA, Marr MJ, Smith AD, Maple TS. Relative numerousness judgment and summation in young and old Western Lowland gorillas. Journal of Comparative Psychology. 2005;119:285–295. doi: 10.1037/0735-7036.119.3.285. doi:10.1037/0735-7036.119.3.285. [DOI] [PubMed] [Google Scholar]
- Beran MJ. Summation and numerousness judgments of sequentially presented sets of items by chimpanzees (Pan troglodytes) Journal of Comparative Psychology. 2001;115:181–191. doi: 10.1037/0735-7036.115.2.181. doi:10.1037/0735-7036.115.2.181. [DOI] [PubMed] [Google Scholar]
- Beran MJ. Chimpanzees (Pan troglodytes) respond to nonvisible sets after one-by-one addition and removal of items. Journal of Comparative Psychology. 2004;118:25–36. doi: 10.1037/0735-7036.118.1.25. doi:10.1037/0735-7036.118.1.25. [DOI] [PubMed] [Google Scholar]
- Beran MJ. Quantity perception by adult humans (Homo sapiens), chimpanzees (Pan troglodytes), and rhesus macaques (Macaca mulatta) as a function of stimulus organization. International Journal of Comparative Psychology. 2006;19:386–197. [Google Scholar]
- Beran MJ. Rhesus monkeys (Macaca mulatta) enumerate large and small sequentially presented sets of items using analog numerical representations. Journal of Experimental Psychology: Animal Behavior Processes. 2007;33:55–63. doi: 10.1037/0097-7403.33.1.42. doi:10.1037/0097-7403.33.1.42. [DOI] [PubMed] [Google Scholar]
- Beran MJ. Monkeys (Macaca mulatta and Cebus apella) track, enumerate, and compare multiple sets of moving items. Journal of Experimental Psychology: Animal Behavior Processes. 2008;34:63–74. doi: 10.1037/0097-7403.34.1.63. doi:10.1037/0097-7403.34.1.63. [DOI] [PubMed] [Google Scholar]
- Beran MJ. Quantity judgments of auditory and visual stimuli by chimpanzees (Pan troglodytes) Journal of Experimental Psychology: Animal Behavior Processes. 2012;38:23–29. doi: 10.1037/a0024965. doi:10.1037/a0024965. [DOI] [PMC free article] [PubMed] [Google Scholar]
- Beran MJ, Beran MM. Chimpanzees remember the results of one-by-one addition of food items to sets over extended time periods. Psychological Science. 2004;15:94–99. doi: 10.1111/j.0963-7214.2004.01502004.x. doi:10.1111/j.0963-7214.2004.01502004.x. [DOI] [PubMed] [Google Scholar]
- Beran MJ, Johnson-Pynn JS, Ready C. Quantity representation in children and rhesus monkeys: Linear versus logarithmic scales. Journal of Experimental Child Psychology. 2008;100:225–233. doi: 10.1016/j.jecp.2007.10.003. doi:10.1016/j.jecp.2007.10.003. [DOI] [PMC free article] [PubMed] [Google Scholar]
- Beran MJ, Smith JD, Redford JS, Washburn DA. Rhesus macaques (Macaca mulatta) monitor uncertainty during numerosity judgments. Journal of Experimental Psychology: Animal Behavior Processes. 2006;32:111–119. doi: 10.1037/0097-7403.32.2.111. doi:10.1037/0097-7403.32.2.111. [DOI] [PubMed] [Google Scholar]
- Beran MJ, Taglialatela LA, Flemming TJ, James FM, Washburn DA. Nonverbal estimation during numerosity judgements by adult humans. Quarterly Journal of Experimental Psychology. 2006;59:2065–2082. doi: 10.1080/17470210600701171. doi:10.1080/17470210600701171. [DOI] [PubMed] [Google Scholar]
- Brannon EM, Terrace HS. Representation of the numerosities 1–9 by rhesus macaques (Macaca mulatta) Journal of Experimental Psychology: Animal Behavior Processes. 2000;26:31–49. doi: 10.1037//0097-7403.26.1.31. doi:10.1037/0097-7403.26.1.31. [DOI] [PubMed] [Google Scholar]
- Call J. Estimating and operating on discrete quantities in orangutans (Pongo pygmaeus) Journal of Comparative Psychology. 2000;114:136–147. doi: 10.1037/0735-7036.114.2.136. doi:10.1037/0735-7036.114.2.136. [DOI] [PubMed] [Google Scholar]
- Cantlon JF, Brannon EM. Shared system for ordering small and large numbers in monkeys and humans. Psychological Science. 2006;17:401–406. doi: 10.1111/j.1467-9280.2006.01719.x. doi:10.1111/j.1467-9280.2006.01719.x. [DOI] [PubMed] [Google Scholar]
- Cantlon JF, Brannon EM. How much does number matter to a monkey (Macaca mulatta)? Journal of Experimental Psychology: Animal Behavior Processes. 2007;33:32–41. doi: 10.1037/0097-7403.33.1.32. doi:10.1037/0097-7403.33.1.32. [DOI] [PubMed] [Google Scholar]
- Chesney DL, Gelman R. Visual nesting impacts approximate number system estimation. Attention, Perception, and Psychophysics. 2012;24:1104–1113. doi: 10.3758/s13414-012-0349-1. DOI 10.3758/s13414-012-0349-1. [DOI] [PubMed] [Google Scholar]
- Cordes S, Gelman R, Gallistel CR, Whalen J. Variability signatures distinguish verbal from nonverbal counting for both large and small numbers. Psychonomic Bulletin and Review. 2001;8:698–707. doi: 10.3758/bf03196206. doi:10.3758/BF03196206. [DOI] [PubMed] [Google Scholar]
- Droit-Volet S, Clement A, Fayol M. Time and number discrimination in a bisection task with a sequence of stimuli: A developmental approach. Journal of Experimental Child Psychology. 2003;84:63–76. doi: 10.1016/s0022-0965(02)00180-7. doi:10.1016/S0022-0965(02)00180-7. [DOI] [PubMed] [Google Scholar]
- Emmerton J. Numerosity differences and effects of stimulus density on pigeons' discrimination performance. Animal Learning and Behavior. 1998;26:243–256. doi:10.3758/BF03199218. [Google Scholar]
- Evans TA, Beran MJ, Harris EH, Rice D. Quantity judgments of sequentially presented food items by capuchin monkeys (Cebus apella) Animal Cognition. 2009;12:97–105. doi: 10.1007/s10071-008-0174-z. doi:10.1007/s10071-008-0174-z. [DOI] [PubMed] [Google Scholar]
- Ferkin MH, Pierce AA, Sealand RO, delBarco-Trillo J. Meadow voles, Microtus pennsylvanicus, can distinguish more over-marks from fewer over-marks. Animal Cognition. 2005;8:182–189. doi: 10.1007/s10071-004-0244-9. doi:10.1007/s10071-004-0244-9. [DOI] [PubMed] [Google Scholar]
- Gallistel CR, Gelman R. Non-verbal numerical cognition: From reals to integers. Trends in Cognitive Sciences. 2000;4:59–65. doi: 10.1016/s1364-6613(99)01424-2. doi:10.1016/S1364-6613(99)01424-2. [DOI] [PubMed] [Google Scholar]
- Ginsburg N. Effect of item arrangement on perceived numerosity: Randomness vs regularity. Perceptual and Motor Skills. 1976;43:663–668. doi: 10.2466/pms.1976.43.2.663. [DOI] [PubMed] [Google Scholar]
- Ginsburg N. The regular-random numerosity illusion: Rectangular patterns. Journal of General Psychology. 1980;103:211–216. doi: 10.1080/00221309.1980.9921000. [DOI] [PubMed] [Google Scholar]
- Halberda J, Mazzocco MMM, Feigenson L. Individual differences in non-verbal number acuity correlate with maths achievement. Nature. 2008;445:665–668. doi: 10.1038/nature07246. doi:10.1038/nature07246. [DOI] [PubMed] [Google Scholar]
- Hanus D, Call J. Discrete quantity judgments in the great apes (Pan paniscus, Pan troglodytes, Gorilla gorilla, Pongo pygmaeus): The effect of presenting whole sets versus item-by-item. Journal of Comparative Psychology. 2007;121:241–249. doi: 10.1037/0735-7036.121.3.241. doi:10.1037/0735-7036.121.3.241. [DOI] [PubMed] [Google Scholar]
- Irie-Sugimoto N, Kobayashi T, Sato T, Hasegawa T. Relative quantity judgment by Asian elephants (Elephas maximus) Animal Cognition. 2009;12:193–199. doi: 10.1007/s10071-008-0185-9. doi:10.1007/s10071-008-0185-9. [DOI] [PubMed] [Google Scholar]
- Jaakkola K, Fellner W, Erb L, Rodriguez M, Guarino E. Understanding of the concept of numerically “less” by bottlenose dolphins (Tursiops truncatus) Journal of Comparative Psychology. 2005;119:286–303. doi: 10.1037/0735-7036.119.3.296. doi:10.1037/0735-7036.119.3.296. [DOI] [PubMed] [Google Scholar]
- Jordan KE, Brannon EM. A common representational system governed by Weber's law: Nonverbal numerical similarity judgments in 6-year-olds and rhesus macaques. Journal of Experimental Child Psychology. 2006;95:215–229. doi: 10.1016/j.jecp.2006.05.004. doi:10.1016/j.jecp.2006.05.004. [DOI] [PubMed] [Google Scholar]
- Jordan KE, Brannon EM. Weber's Law influences numerical representations in rhesus macaques (Macaca mulatta) Animal Cognition. 2006;9:159–172. doi: 10.1007/s10071-006-0017-8. doi:10.1007/s10071-006-0017-8. [DOI] [PubMed] [Google Scholar]
- Kaufman EL, Lord MW, Reese TW, Volkmann J. The discrimination of visual number. American Journal of Psychology. 1949;62:498–525. doi:10.2307/1418556. [PubMed] [Google Scholar]
- Kilian A, Yaman S, Von Fersen L, Gunturkun O. A bottlenose dolphin discriminates visual stimuli differing in numerosity. Learning and Behavior. 2003;31:133–142. doi: 10.3758/bf03195976. doi:10.3758/BF03195976. [DOI] [PubMed] [Google Scholar]
- Krusche P, Uller C, Dicke U. Quantity discrimination in salamanders. Journal of Experimental Biology. 2010;213:1822–1828. doi: 10.1242/jeb.039297. doi:10.1242/jeb.039297. [DOI] [PubMed] [Google Scholar]
- Meck WH, Church RM. A mode control model of counting and timing processes. Journal of Experimental Psychology: Animal Behavior Processes. 1983;9:320–324. doi:10.1037/0097-7403.9.3.320. [PubMed] [Google Scholar]
- Nieder A, Freedman DJ, Miller EK. Representation of the quantity of visual items in the primate prefrontal cortex. Science. 2002;297:1708–1711. doi: 10.1126/science.1072493. doi:10.1126/science.1072493. [DOI] [PubMed] [Google Scholar]
- Nieder A, Miller EK. Coding of cognitive magnitude: Compressed scaling of numerical information in the primate prefrontal cortex. Neuron. 2003;37:149–157. doi: 10.1016/s0896-6273(02)01144-3. [DOI] [PubMed] [Google Scholar]
- Nieder A, Miller EK. Analog numerical representations in rhesus monkeys: Evidence for parallel processing. Journal of Cognitive Neuroscience. 2004;16:889–901. doi: 10.1162/089892904970807. doi:10.1162/089892904970807. [DOI] [PubMed] [Google Scholar]
- Perdue BM, Talbot CG, Stone AM, Beran MJ. Putting the elephant back in the herd: elephant relative quantity judgments match those of other species. Animal Cognition. 2012;15:955–961. doi: 10.1007/s10071-012-0521-y. doi:10.1007/s10071-012-0521-y. [DOI] [PubMed] [Google Scholar]
- Piffer L, Agrillo C, Hyde DC. Small and large number discrimination in guppies. Animal Cognition. 2012;15:215–221. doi: 10.1007/s10071-011-0447-9. DOI 10.1007/s10071-011-0447-9. [DOI] [PubMed] [Google Scholar]
- Richardson WK, Washburn DA, Hopkins WD, Savage-Rumbaugh ES, Rumbaugh DM. The NASA/LRC Computerized Test System. Behavior Research Methods, Instruments, and Computers. 1990;22:127–131. doi: 10.3758/bf03203132. doi:10.3758/BF03203132. [DOI] [PubMed] [Google Scholar]
- Roberts WA. How do pigeons represent numbers? Studies of number scale bisection. Behavioural Processes. 2005;69:33–43. doi: 10.1016/j.beproc.2005.01.005. doi:10.1016/j.beproc.2005.01.005. [DOI] [PubMed] [Google Scholar]
- Rugani R, Regolin L, Vallortigara G. Discrimination of small numerosities in young chicks. Journal of Experimental Psychology: Animal Behavior Processes. 2008;34:388–399. doi: 10.1037/0097-7403.34.3.388. doi:10.1037/0097-7403.34.3.388. [DOI] [PubMed] [Google Scholar]
- Tomonaga M. Relative numerosity discrimination by chimpanzees (Pan troglodytes): Evidence for approximate numerical representations. Animal Cognition. 2007;11:43–57. doi: 10.1007/s10071-007-0089-0. doi:10.1007/s10071-007-0089-0. [DOI] [PubMed] [Google Scholar]
- Trick LM, Enns JT. Clusters precede shapes in perceptual organization. Psychological Science. 1997;8:124–129. doi:10.1111/j.1467-9280.1997.tb00694.x. [Google Scholar]
- Trick LM, Pylyshyn ZW. What enumeration studies can show us about spatial attention: Evidence for limited capacity preattentive processing. Journal of Experimental Psychology: Human Perception and Performance. 1993;19:331–351. doi: 10.1037//0096-1523.19.2.331. doi:10.1037/0096-1523.19.2.331. [DOI] [PubMed] [Google Scholar]
- Trick LM, Pylyshyn ZW. Why are small and large numbers enumerated differently? A limited-capacity preattentive stage in vision. Psychological Review. 1994;101:80–102. doi: 10.1037/0033-295x.101.1.80. doi:10.1037/0033-295X.101.1.80. [DOI] [PubMed] [Google Scholar]
- Uller C, Jaeger R, Guidry G, Martin C. Salamanders (Plethodon cinereus) go for more: Rudiments of number in an amphibian. Animal Cognition. 2003;6:105–112. doi: 10.1007/s10071-003-0167-x. [DOI] [PubMed] [Google Scholar]
- Vonk J, Beran MJ. Bears “count” too: Quantity estimation and comparison in black bears (Ursus americanus) Animal Behaviour. 2012;84:231–238. doi: 10.1016/j.anbehav.2012.05.001. doi:10.1016/j.anbehav.2012.05.001. [DOI] [PMC free article] [PubMed] [Google Scholar]
- Ward C, Smuts BB. Quantity-based judgments in the domestic dog (Canis lupus familiaris) Animal Cognition. 2007;10:71–80. doi: 10.1007/s10071-006-0042-7. doi:10.1007/s10071-006-0042-7. [DOI] [PubMed] [Google Scholar]
- Washburn DA, Rumbaugh DM. Testing primates with joystick-based automated apparatus: Lessons from the Language Research Center's Computerized Test System. Behavior Research Methods, Instruments, & Computers. 1992;24:157–164. doi: 10.3758/bf03203490. doi:10.3758/BF03203490. [DOI] [PubMed] [Google Scholar]
Associated Data
This section collects any data citations, data availability statements, or supplementary materials included in this article.