

Abstract
Beneficial clinical bradycardic effects of ivabradine (IVA) have been interpreted solely on the basis of If inhibition, because IVA specifically inhibits If in sinoatrial nodal pacemaker cells (SANC). However, it has been recently hypothesized that SANC normal automaticity is regulated by crosstalk between an “M clock,” the ensemble of surface membrane ion channels, and a “Ca2+ clock,” the sarcoplasmic reticulum (SR). We tested the hypothesis that crosstalk between the two clocks regulates SANC automaticity, and that indirect suppression of the Ca2+ clock further contributes to IVA-induced bradycardia.
IVA (3μM) not only reduced If amplitude by 45±6% in isolated rabbit SANC, but the IVA-induced slowing of the action potential (AP) firing rate was accompanied by reduced SR Ca2+ load, slowed intracellular Ca2+ cycling kinetics, and prolonged the period of spontaneous local Ca2+ releases (LCRs) occurring during diastolic depolarization. Direct and specific inhibition of SERCA2 by cyclopiazonic acid (CPA) had effects similar to IVA on LCR period and AP cycle length. Specifically, the LCR period and AP cycle length shift toward longer times almost equally by either direct perturbations of the M clock (IVA) or the Ca2+ clock (CPA), indicating that the LCR period reports the crosstalk between the clocks. Our numerical model simulations predict that entrainment between the two clocks that involves a reduction in INCX during diastolic depolarization is required to explain the experimentally AP firing rate reduction by IVA.
In summary, our study provides new evidence that a coupled-clock system regulates normal cardiac pacemaker cell automaticity. Thus, IVA-induced bradycardia includes a suppression of both clocks within this system.
Keywords: Sinoatrial nodal pacemaker cells, Ca2+ cycling, ion channels, physiology, sarcoplasmic reticulum
1. Introduction
Results of recent clinical trials (BEAUTIFUL, SHIFT, VIVIFY, etc.) indicate that a reduction in heart rate by ivabradine (IVA) was anti-anginal and anti-ischemic (for review cf. [1]). Moreover, IVA has been demonstrated to reduce diastolic dysfunction and cardiac fibrosis [2] and to increase exercise capacity [3]. In a model of myocardial ischemia/reperfusion, IVA improved the regional myocardial blood flow and function and reduced the infract size [4]. In isolated sinoatrial nodal pacemaker cells (SANC) under voltage clamp and buffered Ca2+ conditions (i.e., presence of EGTA in the patch pipette), IVA, in low doses, specifically inhibits If of SANC but not other membrane currents [5, 6]. The beneficial clinical bradycardic effects of IVA have been interpreted solely on the basis of If inhibition [1–4, 7].
However, accruing evidence has been interpreted to indicate that normal automaticity of the SANC is regulated by integrated functions within a system of two clock-like oscillators [8–10]: the sarcoplasmic reticulum (SR), acting as a “Ca2+ clock,” rhythmically discharges diastolic local Ca2+ releases (LCRs) beneath the cell surface membrane; LCRs activate an inward current (likely that of the Na+/Ca2+ exchanger) that prompts a surface membrane or “M clock,” the ensemble of sarcolemmal electrogenic molecules, to effect an action potential (AP) (Fig. 1). Periodicity of Ca2+ clock-generated LCRs is regulated by the SR Ca2+ pumping, which depends not only on SR proteins (phospholamban (PLB) and ryanodine receptors), and their phosphorylation status, but also on function and phosphorylation status of M clock proteins, e.g., L-type Ca2+ channels that regulate cell Ca2+ available for SR pumping. According to the coupled-clock hypothesis [11], the M and Ca2+ clocks should crosstalk. Possibilities for crosstalk and feedback via changes in SR Ca2+ cycling include Ca2+ -dependent electrogenic processes (such as Na+/Ca2+ exchange) and voltage-dependent Ca2+ fluxes (such as via L-type Ca2+ channels). Thus, a change in AP firing rate in response to any disturbance signal that perturbs either clock entrains the function of the other clock. This is followed by a feedback from the entrained clock to the originally perturbed clock. Such feedback amplifies the response of the initially perturbed clock to the original signal, ensuring a robust response to the initial disturbance signal. Therefore, the steady-state AP cycle length change embodies contributions of both clocks, as in other coupled oscillatory systems throughout nature [12]. Because both M and Ca2+ clock molecules regulate cellular Ca2+ homeostasis, and resultant LCR characteristics, the coupled-clock hypothesis also predicts that in response to any chronotropic perturbation, the net changes in the steady-state LCR period are a reflection of integrated clock function.
Figure 1. Schematic illustrations of the coupled clock system.

The interplay of Ca2+-calmodulin adenylyl-cyclases (AC), PDE activity and cAMP-mediated, protein kinase A (PKA)-dependent and Ca2+/calmodulin protein kinase II (CaMKII) signaling to the cardiac pacmaker sarcoplasmic reticulum Ca2+ cycling proteins, surface membrane ion channels and mitochondria.
Although the coupled-clock hypothesis is conceptually attractive, direct experimental evidence to support crosstalk between the two clocks is lacking, and the idea that normal automaticity of SANC is regulated by a coupled-clock system remains controversial. We sought to provide evidence for crosstalk between the two clocks by determining whether the effect of IVA, at a concentration that specifically inhibits If of the M clock to reduce the AP firing rate, is accompanied by effects on the intracellular Ca2+ cycling, i.e. on the “Ca2+ clock.”
We further approached this clock crosstalk by determining the ability for observed changes in Ca2+ cycling to feed back to the M clock, by specific perturbation of the Ca2+ clock (using pharmacological inhibition of SR Ca2+ pump). We also further explore the detailed mechanisms of the crosstalk using numerical model simulations that embrace AP, If, ICa,L and Ca2-dependent phosphorylation effect on SR Ca2+ loading and release. Our discovery of the Ca2+ component in the bradycardic effects of IVA in cardiac pacemaker cells is clinically relevant, because this indicates that targeting the coupled-clock system within pacemaker cells, rather than a single effector molecule, such as funny channel, is likely to be a more general and effective strategy to normalize heart rate in patients requiring chronotropic therapy. Moreover, our results reveal the presence of powerful feed-forward and feed-back coupling mechanisms in SANC, providing new evidence that coupled-clock functions confer robustness to normal pacemaker cell automaticity.
2. Methods
To test the hypothesis that the AP cycle length is regulated by crosstalk between surface membrane ion channels and intracellular Ca2+ cycling, we superfused single, isolated rabbit SANC with IVA, a direct and specific blocker of If, or Cyclopiazonic acid (CPA) a direct and specific inhibitor of Ca2+ pumping by SERCA2. We measured AP cycle length, cytosolic Ca2+, SR Ca2+ load and LCR characteristics during diastolic depolarization in spontaneously beating SANC, and also LCR characteristics in permeabilized SANC. In addition, we measured If and ICa,L in voltage-clamped SANC. We determined whether simulations of our mathematical model could reproduce the experimental results, i.e., whether the change in AP cycle length in response to IVA requires crosstalk between membrane ionic currents and SR Ca2+ fluxes. A detailed expanded description of experimental and numerical methods is available in the Online Data Supplement. The experiment protocols have been approved by the Animal Care and Use Committee of the National Institutes of Health (protocol #034LCS2013).
3. Results
3.1 IVA blocks If in SANC
We first verified whether the previously determined effects of 3 μM IVA to inhibit If via whole cell voltage clamp in rabbit SANC [6] are reproducible in single, isolated rabbit SANC studied under our conditions. A representative example of the effect of IVA (3 μM) on If over a range of membrane potentials is shown in Fig. 2A, and the average If characteristics in the presence or absence of IVA are summarized in Table S3. The average effects of IVA (n=9) on the I-V relationships of peak If are shown in Fig. 2B. At the maximum diastolic depolarization (MDP) during spontaneous AP firing (~−59mV; Table S4), IVA decreased peak If, on average, by 45±6% control (Fig. 2B inset). If activation (Fig. 2C) was calculated from the peak tail current 5 min after IVA application (i.e., during steady state If blockade). On average, IVA decreased peak If without significantly shifting its voltage-dependent activation (Fig. 2D, Table S3). Note that in spontaneously beating SANC, unlike in the case of voltage clamp, a long time between spontaneous APs might increase If activation that may contradict the effect of IVA to reduce If amplitude at MDP.
Figure 2. Effect of IVA on If amplitude and activation kinetics.
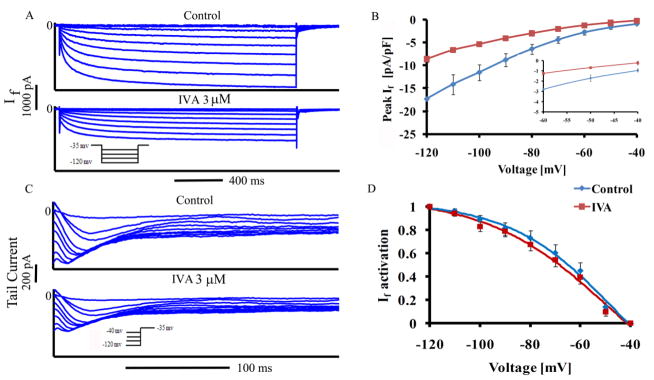
(A) Representative If traces in SANC recorded before and 5 min after application of IVA and (B) average peak If amplitude-voltage relationship (inset depicts If measured over the physiological voltage range), (C) representative If tail traces recorded in SANC before and after application of IVA and (D) If steady-state activation curve under control conditions, and in the presence of IVA (n=9). If tail current density at each membrane potential in control and with IVA is expressed relative to its maximal value at −120 mV.
3.2 Effects of IVA on the SANC spontaneous AP firing rate, intracellular Ca2+ cycling and SR Ca2+ load
To determine the effect of IVA on AP firing rate and AP parameters, we superfused single SANC with IVA for 10 min. Representative examples of APs and average AP firing rate are illustrated in Figures 3A–B, respectively. AP parameters in the presence or absence of IVA are summarized in Table S4. On average (n=9) IVA reduced the AP-firing rate by 14±2% (from 153±10 to 130±10 beats/min). Note, that in time-control experiments in the absence of drug (n=9), the time-dependent decrease in AP firing rate was only 2.68±3% (not shown).
Figure 3. Effect of IVA on spontaneous AP firing rate and spatiotemporal characteristics of LCRs.

(A) Representative AP recordings and (B) average changes in the rate of AP firing in the presence of IVA (n=9). (C) Confocal line scan images of Ca2+ in a representative SANC before and following exposure to IVA. LCRs are indicated by arrowheads. The LCR period is defined as the time from the peak of the prior AP-induced Ca2+ transient to an LCR onset. (D) LCR size (full width at half-maximum amplitude) (n=12 cells, 123 LCR) and (E) A linear function describes the relationship of the 90% decay time of the AP-induced Ca2+ transient (T-90c) to the LCR period in control and in the presence of IVA. The line is the best least squares linear-regression fit to the data. *p<0.05 vs. drug.
We next determined whether the effect of IVA to reduce the SANC AP firing rate is accompanied by an effect on intracellular Ca2+ cycling in single SANC loaded with Fluo-4 AM. Figure 3C illustrates the AP-induced Ca2+ transient and spontaneous diastolic LCRs (arrows) in a representative SANC. Table S5 lists the average characteristics of the AP-induced Ca2+ transients. The reduction in spontaneous AP firing rate in response to IVA is accompanied by a prolongation (by 12±5%) of the 90% decay time of intracellular Ca2+ (T-90c), while peak systolic Ca2+ (amplitude), time to peak Ca2+ and 50% decay time of intracellular Ca2+ (T-50c) were not significantly altered.
The spatiotemporal characteristics of diastolic LCRs determine the timing and extent of diastolic activation of an inward INCX, which accelerates the rate of diastolic depolarization. The average effects of IVA on these characteristics are listed in Table S5. IVA shifted the LCR size distribution to a smaller value (Fig. 3D), reduced LCR duration, reduced the average number of LCRs (normalized to 100 μm cell length and 1-s time interval), and markedly reduced ensemble LCR Ca2+ signal. The LCR period, defined as the time from the peak Ca2+ transient (the onset SR Ca2+ release triggered by the prior AP) to the LCR onset (as illustrated in Fig. 3C), was prolonged by IVA (Fig. 3E). Thus, changes in the LCR period in response to IVA occur concomitantly with changes in T-90c, and T-90c and the LCR period are highly correlated with each other both prior to and during exposure to IVA (Fig. 3E). These results indicate that, in conjunction with its bradycardic effect, IVA has a substantial effect to suppress spontaneous Ca2+ signaling.
To estimate whether LCR suppression is associated with a reduction in the SR Ca2+ content, brief, rapid pulses of caffeine were applied (“spritzed”) onto control cells and cells in the presence of IVA. Representative examples and average effects of caffeine induced Ca2+ release are presented in Figure 4A and Figure 4B, respectively. IVA significantly reduced the peak amplitude of the caffeine-induced Ca2+ transient by 13% (Fig. 4B).
Figure 4. SR load estimation from rapid caffeine application.

Effects of a rapid application of caffeine (indicated by the arrow) onto a SANC in (A) control, or in the presence of 3 μM IVA. (B) Average effects of IVA on the amplitude of caffeine-induced cytosolic Ca2+ transient (n=12 in control and in response to IVA). Effects of a rapid application of caffeine onto a SANC in (C) control, or in the presence of CPA. (D) Average effects of CPA on the amplitude of the caffeine-induced cytosolic Ca2+ transient (n=9 for control and CPA). (Note that the caffeine response can be usually measured only once in a given SANC, because following caffeine application a prolonged period is required for AP firing rate to return to the control AP firing rate. Therefore, the effects of caffeine before (i.e., control) and following application of IVA are measured in different cells.) *p<0.05 vs. control.
3.3 Direct inhibition of SR Ca2+ pumping by CPA suppresses intracellular Ca2+cycling and prolongs AP cycle length
To determine whether the IVA effect on Ca2+ cycling and SR Ca2+ load could be reproduced by direct perturbation of the Ca2+ clock, we employed 0.5 μM CPA which directly and specifically inhibits SERCA2 Ca2+ pumping in order to reduce the SR Ca2+ load [13] to a similar extent as that effected by IVA. A representative example of the CPA on the caffeine-induced Ca2+ transient is shown in Figure 4C. Fig. 4D shows that, on average, CPA significantly reduced the SR Ca2+ load, indexed by the amplitude of the caffeine-induced Ca2+ transient, by 20%.
Fig. 5A shows the effects of CPA on the AP-induced Ca2+ transient and on LCRs in a representative SANC. Table S5 lists the average characteristics of the AP-induced Ca2+ transients and LCR characteristics measured by Fluo-4. As in the response to IVA, the peak systolic Ca2+ (amplitude), time to peak Ca2+ and T-50c were not significantly altered, but also as in response to IVA, T-90c was prolonged (by 12±4%) in response to CPA. The effects of CPA on LCR characteristics were also similar to those in response to IVA: LCR size distribution shifted to smaller values (Fig 5B) and the ensemble LCR Ca2+ signal was reduced by CPA and on average, the LCR period was prolonged by 13±2% by CPA. Thus, as was the case for IVA, changes in LCR period in response to CPA occurred concomitantly with changes in the T-90c, and the two changes in parameters are highly correlated (Fig. 5C, Fig. S1). Fig. 5D illustrates the effect of CPA on AP cycle length in a representative SANC. Fig. 5E shows that, on average, a direct effect on intracellular Ca2+ cycling by CPA was accompanied by a reduction of the spontaneous AP firing rate (by 15±2%; n=9, from 155±10 to 130±10 beats/min), i.e., similar in magnitude of AP firing rate reduction effect of IVA. Table S4 shows that CPA effects on AP characteristics are also similar to those of IVA. A comparison of Figs. 3, 4 and 5 and the data in Tables S4-S6 indicates that the effects of IVA and CPA on intracellular Ca2+ cycling and AP firing rate are strikingly similar.
Figure 5. Effect of CPA on spontaneous AP firing rate and spatiotemporal characteristics of LCRs.

(A) Ca2+ confocal line scan images of a representative SANC before and following exposure to CPA, (B) LCR size in control (n=12 cells, 117 LCRs) and the presence of CPA (n=12 cells, 86 LCRs). (C) A linear function describes the relationship of the 90% decay time of the AP-induced Ca2+ transient (T-90c) to the LCR period in control and in the presence of CPA. The line is the best least squares linear-regression fit to the data. (D) Representative AP recordings and (E) average changes in the rate of AP firing in the presence of CPA (n=9). *p<0.05 vs. drug.
3.4 Both IVA and CPA effects on LCR period and AP cycle are correlated
It has been previously documented that changes in AP cycle length in response to numerous perturbations that affect both the M and Ca2+ clocks (a decrease in cAMP/PKA levels, β adrenergic receptor stimulation, etc.) are linked to the LCR period [14, 15]. Fig. 6 demonstrates that spontaneous AP cycle length prior to and in response to either IVA (panel A) or CPA (panel B) is predicted by the concurrent LCR period. When data prior to and in response to these perturbations (IVA and CPA) in panels A and B are merged, they conform to a linear function (panel C) with the same slope as the control-IVA (panel A) and control-CPA (panel B). Moreover changes in LCR period among cells (from 335±7 ms to 367±7 ms for IVA from 342±5 to 376±8 ms for CPA), and concurrent changes in spontaneous SANC AP cycle length induced by IVA or CPA, form a linear function that lies near a line of identity (Fig. 6D, r2=0.9, p<0.001). Thus, the LCR period is an integrated function of the coupled-clock system (because its relationship to the AP cycle length in response to IVA is identical to that in response to CPA).
Figure 6. Effect of IVA and CPA on LCR period.

The LCR period in control or in the presence of IVA (panel A) or CPA (panel B) predicts the concurrent AP cycle length. (C) Combined data in A and B for IVA and CPA conform to a least square fit of the data in A and B for IVA or CPA alone, respectively. Inset illustrates the average data points for control, IVA and CPA. (D) Data in panel C for IVA or CPA are expressed as % change from control prior to drug application in each cell. The IVA and CPA prolongation of the LCR period predict the concurrent prolongation of AP cycle length. The line is the best least squares linear-regression fit to the data. The dash line is the line of identity.
3.5 IVA directly and specifically affects only the membrane clock and CPA directly and specifically affects only the Ca2+ clock
To prove that IVA does not directly suppress cell Ca2+ cycling, we measured the effect of IVA on ICa,L, an important determinant of coupled-clock function of cell Ca2+ loading in intact SANC. We also measured Ca2+ kinetics in permeabilized SANC. Representative examples of the effect of IVA on ICa,L, measured at −5 mV, and on average I-V relationship of ICa,L are presented in Figures S2A and Figure S2B, respectively. Average ICa,L characteristics are listed in Table S6. Peak ICa,L in the presence of IVA did not differ from control (−13.7±1 vs −13.3±1 pA/pF, n=12). Furthermore, the reduction in ICa,L in the presence of IVA did not statistically differ from ICa,L time-control for run-down (4.3±1%, n=9). Note that measurements of ICa,L under voltage clamp and buffered Ca2+ may not mimic exactly how this ion current changes when intracellular Ca2+ changes during spontaneous AP firing.
We examined the effects of IVA on SR Ca2+ cycling by measuring LCR characteristics in permeabilized SANC. IVA did not affect LCR characteristics (Fig. 7, Table S7), and therefore did not have a direct effect to suppress SR-Ca2+ cycling. Specifically, IVA did not significantly change LCR frequency (number of LCR for 100 μm in 1 sec), duration, amplitude or size. Moreover, neither Ca2+ signal of individual LCR nor the LCR ensemble Ca2+ signal significantly changed in response to IVA. Therefore, 3 μM IVA employed to specifically and directly inhibit If did not directly suppress intracellular Ca2+ cycling.
Figure 7. Effect of IVA on spontaneous LCR characteristics in saponin permeabilized SANC.

(A) Ca2+ confocal line scan images of a representative SANC before and following exposure to IVA. Average effects of IVA on the (B) LCR duration, (C) LCR size and (D) LCR amplitude.
To prove that CPA suppression of intracellular Ca2+ is not due to a direct effect on the M clock ionic currents we measured If and ICa,L, an important determinant cell Ca2+ loading. Representative examples of the CPA effect on ICa,L, measured at −5 mV, and the average effect on the I-V relationship of ICa,L are presented in Figures S2C and Figure S2D, respectively. Average ICa,L characteristics are listed in Table S6. Peak ICa,L in the presence of CPA in voltage-clamped cells did not differ from control (−14.1±2 vs −13.7±2 pA/pF, n=12). Moreover, in voltage-clamped SANC, CPA did not affect the If peak or its kinetics (Table S3, Figure S3). Therefore, 0.5 μM CPA employed to specifically and directly inhibit SERCA pump did not directly affect the M clock.
3.6 A numerical model predicts cross talk in response to IVA
We employed a SANC numerical model developed previously [16, 17] in order to dissect contributions to the steady-state reduction in AP firing rate in response to IVA that result from (1) change in If, (2) feed-forward effect of IVA-induced cycle length increase to reduce Ca2+ influx (per unit time) and, hence, on SR Ca2+ pumping and release, and feedback of these Ca2+ cycling changes on AP firing rate, (3) additional feedback from change in intracellular Ca2+ cycling to Ca2+-calmodulin activation of Adenylyl-cyclases (AC)/cAMP-PKA and Ca2+/calmodulin protein kinase II (CaMKII) signaling. Please refer to the online supplement for details of the model and model parameters.
Fig. 8 illustrates the model simulations of the effects of 3 μM IVA on If, AP, intracellular Ca2+, ICa,L, junctional and network SR Ca2+, and sarolemmal Na+-Ca2+ exchange current. The blue traces show the coupled-clock model simulations in the absence of IVA. The red traces show the model simulations when IVA directly affects If parameters (If parameters were changed according to our experimental results, see Table S1d for changes in model parameters). The model shows that a reduction in AP firing rate (Fig. 8B) in response to a decrease in If amplitude affects Ca2+ influx, SR Ca2+ cycling and the activation of INCX. A reduction in Ca2+ influx per unit time accompanies the reduction in AP firing rate via less frequent ICa,L activation (due to a fewer number of simulated beats per unit time). The ICa,L integral per 10 sec decreases from 194 in the absence of IVA to 183 pA*s. Panels D to F in Fig. 8 illustrate the changes in cytosolic Ca2+, junctional and network SR Ca2+, respectively. Model simulations predict only a modest decrease in the peak cytosolic Ca2+ transient (by 2%), maximal Cajsr (by 0.2%) and maximal Cansr (by 3%). This reduction in SR load is less than that measured experimentally in the steady state (Fig. 4). Moreover, the model predicts that IVA prolonged the T-90c (by 8%). On the basis of its effects on cytosolic Ca2+ characteristics, IVA shifts the timing of diastolic depolarization at which inward sarcolemmal Na+-Ca2+ exchanger current was Ca2+ activated to a later time (by 7.5%), which matches the decrease in AP firing rate predicted by this model simulation. The effect of IVA on the INCX is not direct, but occurs via the resultant change in intracellular Ca2+ in response to IVA. Using a coupled-clock model [16, 17], we explored the relationship between the INCX, If and the membrane potential during diastolic depolarization. The blue tracings in Fig. 9 show the coupled-clock model simulations prior to IVA application. The red tracings in Fig. 9 show the model simulations in which IVA is present, but IVA only induces direct effects to reduce If, i.e., in the absence of changes in the Ca2+ calmodulin AC-cAMP/PKA and CaMKII signaling to PLB. Note, that when IVA only directly affected If parameters, the INCX integral during diastolic depolarization (−65 to −45 mV) indeed became significantly reduced: from 221 pA*mV in control to 204 pA*mV and the If integral during diastolic depolarization reduced from 30 to 19 pA*mV. Note, that these red simulations exclude any changes in the Ca2+-calmodulin activation of AC-cAMP/PKA or CaMKII signaling that leads to changes in PLB-phosphorylation (change in Kup). In other words, the red model simulation considers only the change in Ca2+ balance due to the inseparable reduction in Ca2+ influx in the ICa,L integral as reflected in less SR Ca2+ loading (Fig. 8F, red vs. blue). Red model simulations predict that If amplitude at MDP decreases by 44%, i.e., similar to the experimental results (Fig. 8, red trace), but the steady state AP firing rate decreases by only 7% (Fig. 8, red trace), i.e., about half of the experimentally measured steady state AP firing rate.
Figure 8. Coupled clock numerical model.

Simulations of the effects of IVA on (A) If, (B) AP, (C) ICa.L, (D) cytosolic Ca2+, (E) junctional, (F) network SR Ca2+ and (G) sarolemmal Na+-Ca2+ exchanger current. Blue traces are model simulations prior to drug. Red traces are model simulations when feed-forward entrainment and with only partial feed-back between the M and Ca2+ clock. Green traces are model simulations when both feed-forward and full feed-back entrainments exist between the clocks. Note the dashed line represent the diastolic depolarization phase.
Figure 9.

Numerical simulations of the relationships between membrane potential, If and sodium calcium exchange current during (A) and (C) one complete AP cycle; (B) and (D) during diastolic depolarization only. Note, that the ordinate scale in A and C differs from that in B and D.
cAMP-PKA and CaMKII dependent signaling both affect phosphorylation of PLB, which reduces SERCA2 Ca2+ pumping by shifting the half maximal [Ca2+] for Ca2+ uptake. The model takes into account the effects of cAMP and CaMKII signaling on the Ca2+ clock in the presence of IVA by changing the value of Kup (Half-maximal Cai for Ca2+ uptake in the network SR). Specifically, Kup was changed to fit the experimentally measured decrease in SR Ca2+ load. The model simulation in which the crosstalk of the Ca2+ clock by the M clock occurs in the presence of decreased PLB phosphorylation (green color), not only reproduced the experimentally measured reduction in If during diastolic depolarization (Fig. 8), but also reproduced the full experimentally measured reduction of the spontaneous AP firing rate in response to IVA (Fig. 8, green trace). Although, as in the red trace the peak ICa,L only slightly decreases (by 2%), the ICa,L integral per 10 sec decreases from 194 in the absence of drugs to 167 pA*s. In this model simulation, when both clocks can fully entrain each other, IVA further prolonged the cytosolic Ca2+ transient T-90c (by 15%), substantially decreases maximal Cajsr (by 7%) and maximal Cansr (by 12%), in accord with the experimental observations (Fig. 8 and Table S5). Moreover, this model predicted that, on the basis of its effect to entrain the LCR characteristics, IVA shifted the timing at which inward sarolemmal Na+-Ca2+ exchanger current was activated by Ca2+ at a later time during diastolic depolarization (by 14%) (Fig. 8G), i.e. which is precisely the same extent to which IVA reduced the AP firing rate.
The green tracings in Fig. 8 show the model simulations in which crosstalk to the Ca2+ clock by the M clock also occurs, due to a reduction in PLB phosphorylation (reduction in Kup) in response to IVA. Note that when this additional crosstalk is introduced into the model (i.e., reduction in PLB phosphorylation) the INCX integral during diastolic depolarization becomes further reduced, to 187 pA*mV. In both red and green simulations, changes in steady state INCX are related to the changes in steady state spontaneous AP firing rate (Fig. 9). Therefore, these model simulations suggest that IVA leads to an indirect effect to reduce INCX during late diastolic depolarization. Moreover, although the reduction in INCX is less in the model simulations when IVA only induced a reduction in If than in the model simulation that includes a reduction in PLB phosphorylation, the change in the If integral (from 30 to 19 pA*mV) during diastolic depolarization (−65 to −45 mV) was similar in both simulations.
4. Discussion
The first novel finding of our work is that IVA indirectly suppresses intracellular Ca2+ cycling at a concentration that specifically inhibits If, but does not directly suppress intracellular Ca2+ cycling (i.e., via a direct effect on ICaL [6, 18] or SR Ca2+ cycling (Fig. 7)), and does not affect other surface membrane ion channels (i.e., IK or INa) [6, 19]. Specifically, our results demonstrate that although a direct effect on Ca2+ cycling and SR Ca2+ loading in response to IVA does not occur, SR Ca2+ load is reduced and spontaneous LCRs from SR via ryanodine receptors are suppressed. This can be explained on the level of a net reduction in Ca2+ influx associated with the reduced AP firing rate (due to reduced number of APs that occur per unit time). During transition to a new steady state, reduction in Ca2+ influx simultaneously leads to (1) a reduction in Ca2+ available for pumping into the SR, reducing the SR Ca2+ load (the prolongation of the cytosolic Ca2+ transient rate T-90c can be interpreted to indicate a reduced rate of Ca2+ pumping into SR (Fig. S4) [13]), (2) prolongation of the LCR period and (3) a shift of Ca2+ activation of INCX to later time during diastolic depolarization. In other terms, intracellular Ca2+ cycling of the Ca2+ clock, informed by the feed-forward effect of the reduced AP firing rate to reduce Ca2+ influx, feeds back to entrain the M clock to further reduce the AP firing rate. As a result of the reduced net Ca2+ influx and SR Ca2+ load, a reduction of the amplitude of the LCR ensemble Ca2+ signal and prolongation of its period lead to a reduction and delayed in activation of INCX and also likely to reduced Ca2+-calmodulin activation of AC-cAMP/PKA and CaMKII signaling axes (for review, see [20]). This reduction in phosphorylation of Ca2+ cycling proteins further reduces the net Ca2+ influx and SR Ca2+ load. A new steady-state equilibrium is achieved as Ca2+ efflux via INCX becomes sufficiently reduced commensurate with reduced Ca2+ influx due to the reduction in AP firing rate [21]. Note, that while 3 μM IVA affects only If, higher concentrations of IVA (> 10μM) directly reduce ICaL [6, 18] and would lead to direct reduction in intracellular Ca2+. Therefore concentrations of IVA higher than 3 μM cannot be used as a tool to define the cross talk between the membrane and Ca2+ clock.
Thus, we interpret the results of our IVA experiments to indicate that the magnitude of bradycardia in response to IVA is not determined solely by an effect produced by one channel, i.e., funny-current ion channel, but rather by potent crosstalk within a coupled-clock system. To test this interpretation, we employed CPA to directly and selectively inhibit SERCA2 Ca2+ pumping into the SR. Using this approach, we determine the magnitude of AP firing rate reduction in response to a reduction in SR Ca2+ load and suppression of LCR characteristics to levels that were similar in magnitude to those affected by IVA. These experiments demonstrated that CPA decreases the SR Ca2+ load, and prolonged the LCR period, without directly affecting ICa,L or If (Figs. S2 and S3). Similar to the entrainment effect of the AP firing rate reduction by IVA on the Ca2+ clock, the reduction in AP firing rate in response to CPA involves crosstalk between M and Ca2+ clocks. Ca2+ pumping into SR via SERCA was directly suppressed by CPA, leading to a reduction in SR Ca2+ load, the LCR period is prolonged, and the spontaneous LCR ensemble Ca2+ signal to the M clock to activate NCX is reduced and delayed. The resultant Ca2+ to M clock crosstalk leads to a reduction of the AP firing rate. The AP rate reduction, per se, (during transition to a new steady state) provides a feed-forward effect to reduce net Ca2+ influx, and thus the resultant reduction in intracellular Ca2+ simultaneously feeds back on SR to further entrain reductions in SR Ca2+ cycling kinetics and prolongation of the LCR period. While we used only one concentration of IVA, by using CPA at a concentration that induces similar reduction in SR Ca2+ load, we show that two different perturbations that have completely different specific and direct mechanisms of actions induce a similar suppression of LCR characteristics and a similar reduction in magnitude of AP firing rate. The effects of CPA and IVA on coupled-clock entrainment are similar, even in the absence of an effect of CPA to reduce If or an of effect of IVA to directly affect SR Ca2+ cycling. Indeed, when the shift in the relationship between the changes in LCR period and AP cycle length in response to reduction in If (IVA) or SERCA2 inhibition (CPA) are superimposed (Fig. 6), it becomes apparent that IVA and CPA effects on LCR period and cycle length are similar. This is the essence of our main hypothesis i.e., that crosstalk occurs between the membrane and Ca2+ clock when either the membrane or the Ca2+ clock is directly perturbed. Thus, it may be concluded that, no matter how it is perturbed, the LCR period reports the level of crosstalk within the coupled-clock system. In other words, our results demonstrate that the net change in AP cycle length evoked by selectively perturbing either the M clock or the Ca2+ clock is predictable by, and inseparable from, the concurrent change in LCR periodicity and amplitude, and therefore LCR characteristics report an integrated function (i.e., coupling or entrainment) of M and Ca2+ clocks.
Because the additive contributions of the feed-back mechanisms from the entrained clock (indirectly perturbed) to the perturbed clock, the contributors to the steady state reduction in spontaneous AP firing rate cannot be determined experimentally (Fig. 8–9). We approached their dissection in silico, in the context of a numerical model. Model simulations that include only limited crosstalk between the M and Ca2+ clocks (i.e., due to the reduction in Ca2+ influx that inevitably occurs when the AP firing rate is reduced) in the absence of effects of the change in intracellular Ca2+ to reduce the extent of Ca2+-calmodulin activation of AC-cAMP/PKA and CaMKII-dependent phosphorylation of PLB fail to reproduce the experimental results. In other terms, the model simulation in the absence of additional crosstalk that results from a reduction in Ca2+ cycling protein phosphorylation (i.e., PLB) can account for only about 50% of the experimentally measured reduction in steady state AP firing rate that occurs in response to IVA. In contrast, simulations in which the model is informed of reductions in Ca2+-calmodulin PKA and CaMKII phosphotylation-dependent PLB signaling predict the full experimentally observed reduction in steady state AP firing rate induced by IVA. These model simulations, therefore, strongly suggest that both feed-back and feed-forward mechanisms resulting from a reduction in Ca2+-calmodulin activation of AC-cAMP/PKA and/or CaMKII signaling axes lead to a reduction in Ca2+ cycling protein phosphorylation that contributes importantly to the overall effect of IVA to reduce the steady state AP firing rate. Specifically, the model simulations predict that a reduction in the spontaneous AP firing rate results in reduction in Ca2+ influx and to a suppression of SR Ca2+ cycling which induces a reduction in cAMP/PKA and CaMKII signaling axis, leading to a reduction of PLB phosphorylation which leads to a further reduction in SR Ca2+ cycling and AP firing rate. Note that, while a reduction in Ca2+ activation of AC to reduce cAMP may shift the steady-state activation of If, this could also contribute to IVA-induced change in the AP firing rate. Our model simulations, however, predicted that this effect is likely to be minor, because a maximum shift in If activation (e.g. up to ~ 8 mV in response to acetylcholine [22]) results only in a minor decrease of the AP firing rate (within 4%, not shown).
When our model (Fig. 8 and 9) includes only limited crosstalk between the membrane and Ca2+ clocks (in the absence of effects of the change in intracellular Ca2+ due to the reduction in AP firing rate to reduce the extent of Ca2+-calmodulin activation of AC-cAMP/PKA and CaMKII-dependent phosphorylation of PLB), the model fails to reproduce the steady-state changes in spontaneous AP firing rate by IVA. Our model parameters of If prior to and during application of IVA are those that have been measured in the present study (Table S1d). It is interesting to note that another model, in which If amplitude is larger than our model [23], can even with limited crosstalk between the membrane and Ca2+ clocks reproduce the changes in spontaneous AP firing rate in response to IVA that were observed in the experiments of the present study. This computational model, however in contrast to our experimental results, predicts only a modest decrease in SR Ca2+ load, resulting from changes in maximal Cajsr (by 3%) and maximal Cansr (by 4%). Therefore, this computational model predicts that changes in steady state spontaneous AP firing rate by IVA are mainly due to changes in membrane clock (If), and not due to crosstalk between the clocks. This result is not in accord with experimental results.
The experimental effects of IVA to reduce the SANC AP firing rate are mediated only in part by its direct effects to inhibit If, and in part, by its crosstalk with the Ca2+ clock (Fig. 3–7), indicating that the SANC AP firing rate response to perturbations is regulated by a coupled-clock system, not by a single effector molecule alone, or by a single clock. Thus, our results support the hypothesis that crosstalk between membrane and Ca2+ clocks regulates SANC normal automaticity. The steady-state response to a perturbing signal that directly and specifically perturbs only one clock is determined by both feed-forward and feed-back effects between the clocks, which determine the magnitude of change in AP firing rate. Our combined experimental data and numerical model simulations support the idea that the effect of IVA to reduce the steady-state SANC AP firing rate involves continual crosstalk between the Ca2+ and M clocks during the transition of the AP firing rate from its initial level to steady-state level: a net reduction in Ca2+ influx during this transition is linked to instantaneous reduction of the AP firing rate and reduced Ca2+ influx per unit time. Intracellular Ca2+ signaling is suppressed in response to the reduction in Ca2+ influx and Ca2+ available for pumping into the SR is reduced. Thus, the reduced SR Ca2+ load leads to a reduction in the LCR ensemble and prolongation of its period, which causes a reduction in magnitude and a shift of Ca2+ activation of INCX to a later time during diastolic depolarization. Intracellular Ca2+ reduction leads to reduction in Ca2+-calmodulin activation of the adenylyl cyclase-cAMP-PKA and CaMKII signaling axis. This amplifies the feed-forward effect of the AP rate to reduce the SR Ca2+ pumping, SR Ca2+ load and Ca2+ influx. A new steady-state equilibrium is achieved as Ca2+ efflux via INCX becomes reduced to balance reduced Ca2+ influx initially due to the reduction in AP firing rate that later is amplified by phosphorylation-dependent signaling.
Thus, under voltage clamp even though a low dose of IVA may specifically inhibit If, experiments of the present study in isolated SANC suggest that the interpretation that the beneficial heart rate reduction by IVA involved in recent clinical trials (BEAUTIFUL, SHIFT, VIVIFY, etc. [1]) does not occur solely on the basis of direct If inhibition. The demonstration that crosstalk between the clocks determines the steady rate reduction in the response to IVA does not diminish its clinical therapeutic efficacy to reduce heart rate, but informs a more correct interpretation of why the heart rate becomes reduced to the extent that it does in response to IVA. Thus, our experiments and theoretical modeling that support such crosstalk between the membrane and Ca2+ clock suggest that application of IVA, together with a drug that affects the Ca2+ clock, may increase the beneficial effect of IVA to reduce heart rate. Alternatively, additive effects of the concurrent use of IVA and drugs that reduce cell Ca2+ cycling may induce extended rate reduction. Additional experiments are required, however, to determine the extent to which the mutual clock entrainment observed in SANC in response to IVA in the present study occurs in the intact heart/organism.
5. Limitations
We isolate the sinoatrial node tissue utilizing the anatomical landmarks within the right atrium area. Following disaggregation of the sinoatrial node to obtain single cells it is not possible to determine the original location of an isolated cell within the intact node prior the isolation. Some studies have found the cells within the SAN center differ from those in SAN periphery [24] other studies that demonstrate that some peripheral cells (and atrial cells as well) penetrate the central SAN, suggest that there may not be a homogenous cell population within the central area [25]. Although the basal spontaneous AP firing rate and AP characteristics of rabbit isolated SAN cells do not differ between central and peripheral cells (based upon cell size) [26], the funny channel density does differ between small and larger cells [24]. Therefore, IVA may indeed have different effects on different cells in our study that cannot be distinguished using the isolation landmarks in the present study.
Change in PKA or CaMKII-dependent protein phosphorylation signaling affects other protein than PLB phosphorylation, e.g., L-type channel, K+ channels and ryanodine receptors [27]. However, due to technical issues that that prevent measurements of other phosphorylation sites there is a lack of sufficient experimental data to quantify these effects in pacemaker cells. PLB phosphorylation, on the other hand, has been measured with other drug intervention [11] and has been employed in numerical models as a general index of changes in protein phosphorylation, i.e., not only of PLB, but also of other protein that were not measure experimentally. Due to direct interaction of Ca2+ influx and SR Ca2+ load, Kup is changed in the model to simulate a change in PLB phosphorylation that results in a change in SR Ca2+ load. Although changes in other phosphorylations sites surly occur, in the model changes in PLB phosphorylation are sufficient to correctly simulate the experimental results of changes in SR Ca2+ load and spontaneous AP firing rate.
Supplementary Material
Highlights.
Bradycardic effects of ivabradine include reduction in intracellular Ca2+ cycling.
Local Ca2+ release period reports the crosstalk between membrane and Ca2+ clocks.
Definitive evidence for a coupled-clock function in heart pacemaker cells.
Possible clinical mechanism for ivabradine induced bradycardia.
Acknowledgments
We are grateful for Mrs. Toni-Rose Guriba for assisting in analyzing the spontaneous beating rate.
Sources of Funding
The work was supported entirely by the Intramural Research Program of the National Institute on Aging, National Institutes of Health.
Non-standard abbreviations and acronyms
- AC
Adenylyl-cyclases
- AP
Action potential
- CPA
Cyclopiazonic acid
- IVA
Ivabradine
- LCR
Local Ca2+ release
- M
Membrane
- MDP
Maximum diastolic depolarization
- PKA
Protein kinase A
- PLB
Phospholamban
- SANC
Sinoatrial-node cells
- SR
Sarcoplasmic reticulum
- T-50c
50% decay time of intracellular Ca2+
- T-90c
90% decay time of intracellular Ca2+
Footnotes
Disclosures
None.
Publisher's Disclaimer: This is a PDF file of an unedited manuscript that has been accepted for publication. As a service to our customers we are providing this early version of the manuscript. The manuscript will undergo copyediting, typesetting, and review of the resulting proof before it is published in its final citable form. Please note that during the production process errors may be discovered which could affect the content, and all legal disclaimers that apply to the journal pertain.
References
- 1.Riccioni G. Ivabradine: recent and potential applications in clinical practice. Expert Opin Pharmacother. 2011;12(3):443–50. doi: 10.1517/14656566.2011.548321. [DOI] [PubMed] [Google Scholar]
- 2.Busseuil D, Shi Y, Mecteau M, Brand G, Gillis MA, Thorin E, et al. Heart rate reduction by ivabradine reduces diastolic dysfunction and cardiac fibrosis. Cardiology. 2010;117(3):234–42. doi: 10.1159/000322905. [DOI] [PubMed] [Google Scholar]
- 3.Volterrani M, Cice G, Caminiti G, Vitale C, D’Isa S, Perrone Filardi P, et al. Effect of Carvedilol, Ivabradine or their combination on exercise capacity in patients with Heart Failure (the CARVIVA HF trial) Int J Cardiol. 2011;151(2):218–24. doi: 10.1016/j.ijcard.2011.06.098. [DOI] [PubMed] [Google Scholar]
- 4.Heusch G, Skyschally A, Gres P, van Caster P, Schilawa D, Schulz R. Improvement of regional myocardial blood flow and function and reduction of infarct size with ivabradine: protection beyond heart rate reduction. Eur Heart J. 2008;29(18):2265–75. doi: 10.1093/eurheartj/ehn337. [DOI] [PubMed] [Google Scholar]
- 5.Thollon C, Cambarrat C, Vian J, Prost JF, Peglion JL, Vilaine JP. Electrophysiological effects of S 16257, a novel sino-atrial node modulator, on rabbit and guinea-pig cardiac preparations: comparison with UL-FS 49. Br J Pharmacol. 1994;112(1):37–42. doi: 10.1111/j.1476-5381.1994.tb13025.x. [DOI] [PMC free article] [PubMed] [Google Scholar]
- 6.Bois P, Bescond J, Renaudon B, Lenfant J. Mode of action of bradycardic agent, S 16257, on ionic currents of rabbit sinoatrial node cells. Br J Pharmacol. 1996;118(4):1051–7. doi: 10.1111/j.1476-5381.1996.tb15505.x. [DOI] [PMC free article] [PubMed] [Google Scholar]
- 7.Bucchi A, Baruscotti M, DiFrancesco D. Current-dependent block of rabbit sino-atrial node I(f) channels by ivabradine. J Gen Physiol. 2002;120(1):1–13. doi: 10.1085/jgp.20028593. [DOI] [PMC free article] [PubMed] [Google Scholar]
- 8.Bogdanov KY, Vinogradova TM, Lakatta EG. Sinoatrial nodal cell ryanodine receptor and Na(+)-Ca(2+) exchanger: molecular partners in pacemaker regulation. Circ Res. 2001;88(12):1254–8. doi: 10.1161/hh1201.092095. [DOI] [PubMed] [Google Scholar]
- 9.Gao Z, Chen B, Joiner ML, Wu Y, Guan X, Koval OM, et al. I(f) and SR Ca(2+) release both contribute to pacemaker activity in canine sinoatrial node cells. J Mol Cell Cardiol. 2010;49(1):33–40. doi: 10.1016/j.yjmcc.2010.03.019. [DOI] [PMC free article] [PubMed] [Google Scholar]
- 10.Shinohara T, Park HW, Joung B, Maruyama M, Chua SK, Han S, et al. Selective sinoatrial node optical mapping and the mechanism of sinus rate acceleration. Circ J. 2012;76(2):309–16. doi: 10.1253/circj.cj-11-0734. [DOI] [PMC free article] [PubMed] [Google Scholar]
- 11.Lakatta EG, Maltsev VA, Vinogradova TM. A coupled SYSTEM of intracellular Ca2+ clocks and surface membrane voltage clocks controls the timekeeping mechanism of the heart’s pacemaker. Circ Res. 2010;106(4):659–73. doi: 10.1161/CIRCRESAHA.109.206078. [DOI] [PMC free article] [PubMed] [Google Scholar]
- 12.Strogatz SH, Stewart I. Coupled oscillators and biological synchronization. Sci Am. 1993;269(6):102–9. doi: 10.1038/scientificamerican1293-102. [DOI] [PubMed] [Google Scholar]
- 13.Vinogradova TM, Brochet DX, Sirenko S, Li Y, Spurgeon H, Lakatta EG. Sarcoplasmic reticulum Ca2+ pumping kinetics regulates timing of local Ca2+ releases and spontaneous beating rate of rabbit sinoatrial node pacemaker cells. Circ Res. 2010;107(6):767–75. doi: 10.1161/CIRCRESAHA.110.220517. [DOI] [PMC free article] [PubMed] [Google Scholar]
- 14.Vinogradova TM, Bogdanov KY, Lakatta EG. beta-Adrenergic stimulation modulates ryanodine receptor Ca(2+) release during diastolic depolarization to accelerate pacemaker activity in rabbit sinoatrial nodal cells. Circ Res. 2002;90(1):73–9. doi: 10.1161/hh0102.102271. [DOI] [PubMed] [Google Scholar]
- 15.Vinogradova TM, Lyashkov AE, Zhu W, Ruknudin AM, Sirenko S, Yang D, et al. High basal protein kinase A-dependent phosphorylation drives rhythmic internal Ca2+ store oscillations and spontaneous beating of cardiac pacemaker cells. Circ Res. 2006;98(4):505–14. doi: 10.1161/01.RES.0000204575.94040.d1. [DOI] [PubMed] [Google Scholar]
- 16.Maltsev VA, Lakatta EG. A novel quantitative explanation for the autonomic modulation of cardiac pacemaker cell automaticity via a dynamic system of sarcolemmal and intracellular proteins. Am J Physiol Heart Circ Physiol. 2010;298(6):H2010–23. doi: 10.1152/ajpheart.00783.2009. [DOI] [PMC free article] [PubMed] [Google Scholar]
- 17.Yaniv Y, Spurgeon HA, Lyashkov AE, Yang D, Ziman BD, Maltsev VA, et al. Crosstalk between mitochondrial and sarcoplasmic reticulum Ca(2+) cycling modulates cardiac pacemaker cell automaticity. PLoS One. 2012;7(5):e37582. doi: 10.1371/journal.pone.0037582. [DOI] [PMC free article] [PubMed] [Google Scholar]
- 18.Yaniv Y, Maltsev VA, Ziman BD, Spurgeon HA, Lakatta EG. The “Funny” Current Inhibition by Ivabradine at Membrane Potentials Encompassing Spontaneous Depolarization in Pacemaker Cells. Molecules. 2012;17(7):8241–54. doi: 10.3390/molecules17078241. [DOI] [PMC free article] [PubMed] [Google Scholar]
- 19.Perez O, Gay P, Franqueza L, Carron R, Valenzuela C, Delpon E, et al. Effects of the two enantiomers, S-16257-2 and S-16260-2, of a new bradycardic agent on guinea-pig isolated cardiac preparations. Br J Pharmacol. 1995;115(5):787–94. doi: 10.1111/j.1476-5381.1995.tb15002.x. [DOI] [PMC free article] [PubMed] [Google Scholar]
- 20.Mattiazzi A, Mundina-Weilenmann C, Guoxiang C, Vittone L, Kranias E. Role of phospholamban phosphorylation on Thr17 in cardiac physiological and pathological conditions. Cardiovasc Res. 2005;68(3):366–75. doi: 10.1016/j.cardiores.2005.08.010. [DOI] [PubMed] [Google Scholar]
- 21.Eisner DA, Trafford AW. What is the purpose of the large sarcolemmal calcium flux on each heartbeat? Am J Physiol Heart Circ Physiol. 2009;297(2):H493–4. doi: 10.1152/ajpheart.00423.2009. [DOI] [PMC free article] [PubMed] [Google Scholar]
- 22.DiFrancesco D, Tortora P. Direct activation of cardiac pacemaker channels by intracellular cyclic AMP. Nature. 1991;351(6322):145–7. doi: 10.1038/351145a0. [DOI] [PubMed] [Google Scholar]
- 23.Severi S, Fantini M, Charawi LA, Difrancesco D. An updated computational model of rabbit sinoatrial action potential to investigate the mechanisms of heart rate modulation. J Physiol. 2012 doi: 10.1113/jphysiol.2012.229435. [DOI] [PMC free article] [PubMed] [Google Scholar]
- 24.Honjo H, Boyett MR, Kodama I, Toyama J. Correlation between electrical activity and the size of rabbit sino-atrial node cells. J Physiol. 1996;496 ( Pt 3):795–808. doi: 10.1113/jphysiol.1996.sp021728. [DOI] [PMC free article] [PubMed] [Google Scholar]
- 25.Verheijck EE, Wessels A, van Ginneken AC, Bourier J, Markman MW, Vermeulen JL, et al. Distribution of atrial and nodal cells within the rabbit sinoatrial node: models of sinoatrial transition. Circulation. 1998;97(16):1623–31. doi: 10.1161/01.cir.97.16.1623. [DOI] [PubMed] [Google Scholar]
- 26.Lyashkov AE, Juhaszova M, Dobrzynski H, Vinogradova TM, Maltsev VA, Juhasz O, et al. Calcium cycling protein density and functional importance to automaticity of isolated sinoatrial nodal cells are independent of cell size. Circ Res. 2007;100(12):1723–31. doi: 10.1161/CIRCRESAHA.107.153676. [DOI] [PubMed] [Google Scholar]
- 27.Shan J, Kushnir A, Betzenhauser MJ, Reiken S, Li J, Lehnart SE, et al. Phosphorylation of the ryanodine receptor mediates the cardiac fight or flight response in mice. J Clin Invest. 2010;120(12):4388–98. doi: 10.1172/JCI32726. [DOI] [PMC free article] [PubMed] [Google Scholar]
Associated Data
This section collects any data citations, data availability statements, or supplementary materials included in this article.