

Abstract
HIPK1 (homeodomain interacting protein kinase 1) is a serine/threonine kinase that belongs to the CMGC superfamily. Emerging data point to the role of HIPK1 in cancer, but it is still not clear whether it acts as a tumor suppressor or promoter. Here we identified HIPK1 as a kinase that is significantly overexpressed in colorectal cancer (CRC) and whose expression is stage-dependent. Being abundantly expressed at the onset of the disease, the HIPK1 level gradually decreased as tumor stage progressed. To further uncover how this factor regulates tumorigenesis and establish whether it constitutes an early factor necessary for neoplastic transformation or for cellular defense, we studied the effect of its overexpression in vitro by investigating various cancer-related signaling cascades. We found that HIPK1 mostly regulates the p53 signaling pathway both in HCT116 and HeLa cells. By phosphorylating p53 on its serine-15, HIPK1 favored its transactivation potential, which led to a rise in p21 protein level and a decline in cell proliferation. Assuming that HIPK1 could impede CRC growth by turning on the p53/p21 pathway, we then checked p21 mRNA levels in patients. Interestingly, p21 transcripts were only increased in a subset of patients expressing high levels of HIPK1. Unlike the rest of the cohort, the majority of these patients hosted a native p53 protein, meaning that such a pro-survival pathway (HIPK1+ > p53 > p21) is active in patients, and that HIPK1 acts rather as a tumor suppressor.
Keywords: HIPK1, p53, p21, growth arrest, colorectal cancer, tumor suppressor
Introduction
The homeodomain-interacting protein kinase 1 (HIPK1) is one of the four members (HIPK 1 to 4) of a small family of serine/threonine kinases belonging to the CMGC group. Originally identified as modulators of homeodomain-containing transcription factors,1-4 HIPKs have since been shown to regulate the activity of many other nuclear proteins (i.e., transcriptional regulators and chromatin modifiers) as well as cytoplasmic and transmembrane factors.5 These various effects correlate well with their vast intracellular localization, which may range from a dot-like distribution within the nucleus to the cytoplasm.6
Although the functions of HIPK1 remain largely uncharacterized in cancer cells, a growing set of evidence points to its role in oncogenesis.7,8 In favor of a pro-tumoral function, HIPK1-knockout mice were shown to develop fewer and smaller tumors than their WT counterparts upon chemical induction of carcinogenesis. Mouse embryonic fibroblasts isolated from these rodents also exhibited a reduced expression of Mdm2 and an increased sensitivity to DNA damage-induced apoptosis.7 These data underline the ability of HIPK1 to control at least some types of DNA repair responses, perhaps due to its capacity to interact with p53. Both proteins have indeed been shown to interact in a yeast two-hybrid system, and the regions involved in this interaction have been topologically mapped on the two proteins.7 Regardless of its action on p53, HIPK1 has also been described as a protective guardian of oxidative stress damage.9 Elevated levels of HIPK1 were suggested to reduce the sensitivity of H1299 lung cancer cells to H2O2-induced cell death, whereas its depletion was considered to intensify it. By controlling HIPK1 protein level (presumably through a direct interaction), Dj-1, a multifunction protein implicated in the genetic form of Parkinson disease, and more recently in oncogenesis, certainly played a major role in this effect.9
Despite such compelling evidence tending to attribute pro-oncogenic functions to HIPK1, many other reports have suggested its potential role as a pro-apoptotic factor likely to contain tumor progression. This effect potentially occurs through other nuclear partners of HIPK1, among which Daxx is included.7,10,11 While HIPK1’s interaction with Daxx was shown to affect the intranuclear localization and transcriptional repressive activity of Daxx,10 HIPK1 may, in some particular circumstances, phosphorylate Daxx to induce its cytosolic redistribution. This subsequently leads to apoptosis through ASK-1 oligomerization and MAPK (mitogen-activated protein kinase) signaling pathway activation.11 In addition, while HIPK1 is able to induce the cytosolic recruitment of Daxx, the kinase itself can shuttle between both compartments under stress conditions. For instance, TNF-α treatment was reported to lead to SENP1-dependent desumoylation of nuclear HIPK1 and its subsequent cytosolic translocation.12,13 Once released in the cytosol, the kinase supposedly binds to AIP1 (ASK-1 interacting protein 1) and enhances ASK-1/JUNK/p38 apoptotic signaling.12,13
From these data, it seems that HIPK1 activate one or another regulatory factor depending on the cellular context, and thereby positively or negatively modulate the signaling pathways controlling cell proliferation and/or apoptosis. These pleiotropic effects are obviously highly dependent on the subcellular localization of HIPK1, which controls the accessibility to its various substrates. HIPK1 cytosolic occupancy is thought to rely on nuclear desumoylation events that may affect any of the five putative sumoylation sites described for this enzyme, namely lysine 25, 317, 440, 556 and/or 1,202. For example, it has been reported that the activation of the ASK-1-JNK/p38 axis following TNF-α treatment results from HIPK1 lysine 25 desumoylation and subsequent cytosolic translocation.12,13
To determine the role of HIPK1 in cancer progression and clarify whether it constitutes a promoting or suppressing factor in vivo, we analyzed its expression level directly in colorectal cancer tissue and compared the results to clinical data. Our main finding indicates that HIPK1 is significantly overexpressed in tumors. Analysis of clinical records further revealed that HIPK1 peak expression was reached at stage-I/II, explaining why HIPK1-positive patients display better overall survival. To elucidate how HIPK1 may act in patients, we then designed a series of in vitro experiments to investigate which signaling pathways are engaged by it and to explore the consequences of its overexpression in cancer cells.
Results
HIPK1 is overexpressed at early stage in colorectal tumor samples
Various studies implicate HIPK1 in carcinogenesis, but it is still difficult to assign a pro- or anti-tumoral role to it, and even more to find convincing in vivo data. To fill this gap, we used a TMA (previously generated in our laboratory),14 composed of both normal and tumoral tissue from 80 colorectal cancer (CRC) patients, and compared HIPK1 expression levels in each type of sample after immunohistochemical staining (Fig. 1A–C). Image acquisition and quantitative analyses were performed by laser scanning cytometry using the Icys System,15,16 as formerly done for HIPK2.14 Briefly, tissue areas were appropriately selected in each spot of tissues based on nuclear staining. HIPK1 expression was evaluated inside each tissue area by applying a phantom segmentation and was plotted as histograms, from which we extracted both HIPK1 median intensity and the percentage of HIPK1-overexpressing cells (HIPK1+ cells) by means of an arbitrary gate. The values found for each patient were then plotted in a scatter dot plot, as displayed in Figure 1B and C. This revealed a net increase in HIPK1 expression level in the tumoral tissue (TT; mean HIPK1 median intensity = 1,322 ± 47) compared with the normal mucosa (NT; mean HIPK1 median intensity = 971 ± 49) (***p < 0.0001). It also showed that a significantly higher number of tumor cells expressed HIPK1 protein (mean % of HIPK1+ cells in TT: 49.69% vs. 35.97% for NT) (***p < 0.0001). To confirm these data, we checked the variation in HIPK1 expression level for each individual pair of NT / TT (Fig. S1A and B). In such representations, patients localized above the median line are those exhibiting a rise in HIPK1 expression in their TT, while those below the line express less protein. By considering the protein expression change ≥ to 20%, we identified 32.5 (median, panel A) to 35% (% of HIPK1 + cells, panel B) of patients with an increase in HIPK1 protein in their tumor. On the other hand, tumors showing a drop in HIPK1 expression were very rare. Images not only confirmed these results (Fig. 1A), but also showed that HIPK1 overexpression was strictly limited to the tumoral regions of the TT and did not concern the adjacent connective tissues.

Figure 1. HIPK1 overexpression in tumors. (A–C) Expression level of HIPK1 in CRC compared with healthy mucosa. Image acquisition and HIPK1 quantification were done using the Imaging Cytometer system (Icys) after immunohistochemistry (DAB signal reflecting HIPK1 expression). Representative images of HIPK1 staining are shown in (A), while the global quantification obtained after the analysis of 80 patients is presented in panel (B) for HIPK1 DAB median intensity and panel (C) for the percentage of HIPK1+ cells. Statistical analysis was done using a paired t-test (***p < 0.0001). (D) HIPK1 median intensity (DAB staining) in tumors according to the stage of the disease. Statistical analysis was done using an Anova test followed by a post-multiple comparison Tukey test (*p < 0.05). (E) % of HIPK1+ cells (DAB staining) in tumors according to the stage of the disease. Statistical analysis was done using an Anova test followed by a post-multiple comparison Tukey test (*p < 0.05).
We then addressed the possible relationships between modification in HIPK1 expression and tumor progression in an attempt to correlate HIPK1 level to any available clinical data. Disease stage was thus collected from the patients’ data files and then compared with HIPK1 expression (Fig. 1D and E). Although HIPK1 was overexpressed at all stages of the disease compared with healthy mucosa (Fig. 1B and C), it clearly reached a peak of expression at stage I/II, with a mean median intensity of 1,464 ± 71 (Fig. 1D) and a mean percentage of HIPK1+ cells of 55.7% ± 2.9 (Fig. 1E). During tumor progression, both HIPK1 median intensity and % of HIPK+ cells then gradually decreased to reach 1,288 ± 107 and 47.3% ± 3.4 at stage III and 1,177 ± 70 and 44.3% ± 2.6 at stage IV, respectively. Statistics were done with an Anova test (analysis of variance). As significant differences were observed, this analysis was further combined with a post-test to compare individual pairs of groups. The latter indicated that even if stage IV patients still expressed a higher level of HIPK1 than normal mucosa, the average median intensity and percentage of HIPK1+ cells at this stage was significantly lower than at stage I/II (*p < 0.05). HIPK1 overexpression is thus stage-dependent, thereby explaining the difference in overall survival (OS) when patients were stratified into two categories: the first including patients with low-to-normal level of HIPK1 protein (i.e., displaying a median intensity for HIPK1 < 1,100 or a % of HIPK+ cells ≤ 41%), and the second composed of patients with elevated levels of HIPK1 (i.e., ≥ 1,100 for HIPK1 median intensity or > 41% for HIPK+ cells) (Fig. S2A and B). However, to ascertain whether HIPK1 expression did not have any effect per se on OS, we plotted survival curves according to disease stage (Fig. S3A and B). Owing to an insufficient number of patients in each arm, data were obtained solely for stage IV patients. Interestingly, although not significant (probably due to the size of the cohort, 29 patients), stage IV patients with higher levels of HIPK1, still had a tendency to survive longer than the others, which may still mean that HIPK1 is a favorable factor with regard to prognosis. Nonetheless, from these results, we could conclude only that HIPK1 overexpression constitutes an early event in the process of colorectal carcinogenesis. The final outcome of this transient episode was, however, far from being elucidated. Indeed, it still remained possible that HIPK1 overexpression occurs to favor tumor progression or as a cell-defense mechanism against aberrant cell growth or proliferation.
HIPK1 interacts with p53 and modulates its transcriptional activity
As HIPK1 did not appear to be frequently mutated in CRC (1.28% according to the Cosmic Data Base website), we postulated that the majority of patients harbored a WT protein and further investigated the function of the native form of HIPK1. To evaluate its putative role in tumor biology and unearth whether its rise constitutes a favorable or a hostile mechanism to tumor growth, we first sought which signaling pathways were activated upon its overexpression in the colorectal cancer cell line HCT116. To this aim, we used a luciferase assay allowing the detection of the transcriptional activity of 10 different promoters related to 10 different cancer-signaling pathways (Table 1). Each reporter vector was either transfected with an empty plasmid or in combination with HIPK1 cDNA to specifically detect HIPK1-induced promoter activity changes (Fig. 2A). We found that several transcription activities were upregulated by HIPK1 overexpression in HCT116 cells, i.e., the serum response element (SRE) responsive to ERK pathway activation, the E-box binding element responding to myc/max transcription factors, the HIF-1 response element activated by hypoxia and the AP-1-sensitive promoter activated by the MAPK/JNK pathway. Above all, the p53-sensitive promoter appeared to be particularly stimulated by HIPK1 overexpression, with an approximate 4-fold increase in luciferase activity compared with control cells. To further highlight the specific actions of HIPK1, a similar experiment was then conducted in HeLa cells. The results confirmed the transcriptional induction profile resulting from HIPK1 overexpression, notably emphasizing its effects on AP-1- and p53-dependent promoters (Fig. 2B).
Table 1. Description of the 10-cancer signaling pathway explored in the luciferase test.
| Pathways | Transcription factors | |
|---|---|---|
| 1 |
Wnt |
TCF/LEF |
| 2 |
Notch |
RBP-Jk |
| 3 |
P53/DNA damage |
p53 |
| 4 |
TGFβ |
SMAD2/3/4 |
| 5 |
Cell cycle/pRb-E2F |
E2F/DP1 |
| 6 |
NFkB |
NF-kB |
| 7 |
Myc/Max |
Myc/Max |
| 8 |
Hypoxia |
HIF1A |
| 9 |
MAPK/ERK |
Elk-1/SFR |
| 10 | MAPK/JNK | AP-1 |

Figure 2. Cancer-related pathways activated by HIPK1 overexpression. (A and B) Screening of the activity of 10 cancer-related pathways in HCT116 (A) and HeLa (B) transiently transfected with pCDNA3 or pCMV6-HIPK1. Transcription activity corresponds to the ratio of the luciferase reference units (LRU) values measured in HIPK1-transfected cells to that measured for pcDNA3 transfected cells. Error bars correspond to s.e.m. values. (C) Expression level of p53 protein in HeLa and HCT116 (WT and p53−/−) cells. Each cell line was cultured for 24 h prior to immunoblotting against p53 and actin. When necessary, MG132 was simultaneously added for 24 h at 10 µM. (D) Evaluation of p53 promoter activation (Luciferase) in HCT116 and p53-null derivatives cells transfected with pCDNA3 or pCMV6-HIPK1. HIPK1/pCDNA3 ratio was calculated as described in (A). (E) Co-immunoprecipitation of p53 protein by Flag-tagged HIPK1 in HCT116 cells. As shown on the gel, each column contained the following: control (−), water; control (+), Flag-BAP protein; pellet, immunoprecipitation elution; transfected, extracts of Flag-HIPK1 overexpressing cells and untransfected; extracts of native HCT116 cells. (F–I) Screening of 10 promoters related to cancer mechanisms (Luciferase assay) in HCT116 (F and G) and HeLa (H and I) cells, respectively, transfected with pCMV6-HIPK1 kinase domain (F and H) and pCMV6-HIPK1 D315N (G and I) plasmids. HIPK1/pCDNA3 ratio was calculated as described in (A). Error bars correspond to s.e.m. values.
While p53 is constitutively present and functional in HCT116 cells, it is kept at extremely low, if not at undetectable, levels in HeLa cells. This absence of p53 expression is due to the production of the human papilloma virus (HPV) E6 oncogene that inactivates p53 by promoting its degradation.17 Accordingly, we verified that the pharmacological inhibition of the proteasome activity in these cells resulted in the restoration of detectable levels of p53 protein (Fig. 2C). Surprisingly, even in such conditions of poor p53 expression, HIPK1 overexpression was able to substantially induce the activity of the p53-sensitive promoter. To determine whether HIPK1 was capable of modulating the expression of residual p53 or acting in a p53-independent manner, we measured the activity of the p53-sensitive promoter in HCT116 cells knocked-out for p53 (HCT116 p53−/− cells)18 (Fig. 2C). In such conditions, the activation of the p53-sensitive promoter by HIPK1 was practically null, indicating that p53 protein is definitely required to promote HIPK1-induced gene expression (Fig. 2D). We thus conclude that the residual p53 protein present in HeLa cells is likely to be involved in HIPK1-induced p53-sensitive promoter activation.
A direct interaction between HIPK1 and p53 has previously been described.7 To uncover whether the action of HIPK1 on the p53-dependent promoter was mediated by a direct interaction between the two proteins, HCT116 cells were transiently transfected with a flag-tag HIPK1 and subjected to a co-immunoprecipitation assay using an anti-flag antibody. By capturing flag-tag HIPK1, we pulled down p53 protein, confirming that both proteins do indeed interact in our model (Fig. 2E). To further address the relevance of this interaction on the transcriptional activity of p53, we performed a luciferase reporter assay in HCT116 and HeLa cells transfected with a mutant form of HIPK1 deleted from its p53 interaction domain (aa 1–518) (mutant HIPK1 kinase domain). This deletion impaired the ability of HIPK1 to activate p53-dependent transcription (Fig. 2F and H). We additionally constructed a dead kinase mutant bearing a single point mutation in the active site of the kinase (D315N).12 Similarly to the deletion mutant, the D315N HIPK1 mutant was unable to activate the p53 promoter in HCT116 or HeLa cells (Fig. 2G and I), implying that HIPK1-induced p53-dependent transcription relies on the direct phosphorylation of p53 by HIPK1.
HIPK1 overexpression induces p53 phosphorylation on serine 15
HIPK1 has previously been shown to phosphorylate p53 in cells, but the serine residues involved in the process were not identified.7 To determine whether HIPK1 overexpression induces a site-specific or a more global phosphorylation state of p53 in HCT116 cells, we stained control (Fig. S4) or HIPK1-transfected cells (Fig. 3B) with a set of antibodies specifically designed to recognize the different phosphorylated forms of p53 (serine 6, 15, 20, 33, 37, 46). While all the antibodies were capable of detecting p53 phosphorylation triggered either by etoposide (for serine 6, 15, 20, 37, 46) or nocodazole (for serine 33) (Fig. 3A), HIPK1 overexpression selectively increased the phosphorylation of p53 on serine 15, leaving the other sites unaffected (Fig. 3B). After quantification using an image analysis method combining an automated nuclear segmentation and a fluorescence intensity quantification routine, we further evaluated the phosphorylation level of the different serine residues in transfected vs. control cells (Fig. 3C, data not shown). As expected, no differences were observed except for serine 15, for which the mean nuclear fluorescence intensity was close to 3-fold higher in HIPK1 overexpressing cells compared with control cells [Fig. 3C, i.e., 549.1 ± 46.6 for HIPK1 overexpressing cells (n = 31) vs. 221.1 ± 3.8 for control cells (n = 431), ***p < 0.001]. This result was moreover confirmed by western blot (Fig. 3E). In comparison, the kinase-dead mutant form D315N of HIPK1 was much less efficient to phosphorylate p53 on its serine 15 (Fig. 3C–E). Although significantly different from control cells, the mean nuclear fluorescence found with the mutant was 70% lower than that found for the native protein [Fig. 3C, i.e., 317 ± 15 for HIPK1 D315N overexpressing cells (n = 26) vs. 221 ± 5 for control cells (n = 265), ***p < 0.001]. It thus seemed that upon overexpression, the active form of HIPK1 has a high propensity to trigger p53 phosphorylation on its serine 15.

Figure 3. Phosphorylation status of p53 after DNA damage or HIPK1 overexpression. (A) HCT116 cells were treated with 10 µM of etoposide or 50 ng/ml of nocodazole for 16 h, and stained with phospho-p53 ser 6, 15, 20, 37, 46 (etoposide) or ser 33 (nocodazole) specific antibodies (green) and Hoechst (blue). (B) HCT116 cells were transfected with pCMV6-HIPK1 for 24 h prior to immunofluorescence staining using p53 ser 6, 15, 20, 33, 37 and 46 specific antibodies (green) and HIPK1 antibody (red). (C) Quantification of serine 15 mean of fluorescence in HIPK1 WT, HIPK1D315N-transfected or control HCT116 cells (***p < 0.0001, error bars correspond to s.e.m. values). (D) HCT116 cells were transfected with pCMV6-HIPK1 D315N for 24 h prior to immunofluorescence staining using p53 ser 15 antibody (green) and HIPK1 antibody (red). (E) HCT116 cells were transfected with vehicle (UN), pcDNA3.1, pCMV6-HIPK1, pCMV6-HIPK1 kinase domain or pCMV6-HIPK1 D315N for 24 h. Cellular extracts were then harvested and immunoblotted for pSer15-p53 and GAPDH as a loading control.
HIPK1-induced p53 phosphorylation triggers cell growth arrest
Serine 15 phosphorylation has previously been shown to favor the nuclear retention of p53 and the activation of p53-dependent transcription.19,20 This event has also been reported to stabilize p53 by preventing Mdm2 fixation and its further degradation by the proteasome.21 We thus sought to determine whether HIPK1 overexpression increases p53 expression level in HCT116 cells. Using western blot analysis, we found that HIPK1-transfected HCT116 cells did not exhibit much difference in p53 expression compared with the control cells, while pharmacological inhibition of the proteasome by MG132 addition (10 µM) did so in both conditions (Fig. 4A). It still remained possible, however, that the weak expression level of HIPK1 in the transfected cells associated with the non-negligible basal expression level of p53 in HCT116 cells would prevent the detection of major changes. For this reason, we used immunofluorescence to compare the level of p53 expression in control and overexpressing cells at the single cell level. A segmentation-based image analysis method was applied for quantification. This method was proved to be quantitative, since it perfectly reported the dose-dependent increase in p53 expression following addition of increasing amounts of the DNA-damaging agent etoposide (Fig. S5A). Even with this method, the slight increase in p53 level observed in HIPK1-transfected cells was not statistically significant (Fig. 4B). It was therefore possible that either p53 serine 15 phosphorylation did not lead to the same kind of regulation in CRC cell lines, or that the elevated basal level of p53 in these cells masked a slight variation in expression. For example, in HeLa cells, a cell line model that hardly expresses any detectable level of p53 protein, HIPK1 overexpression resulted in an increase in total p53 level (Fig. S6). The mean intensity of fluorescence was increased 2-fold compared with control cells [i.e., 613.8 ± 32.3 for HIPK1+ cells (n = 35) vs. 315.1 ± 4.7 for control cells (n = 183), ***p < 0.001]. This intriguing result may also mean that in HeLa cells, HIPK1 can reverse the effects of the E6 oncogene and modulate p53-dependent transcription via stabilization and an increase in p53 protein.

Figure 4. Effect of HIPK1 overexpression on p53 and p21 expression in HCT116 cells. (A) HCT116 cells were transfected with pcDNA3 or pCMV6-HIPK1 for 24 h in presence or absence of 10 µM of MG132. Cellular extracts were then harvested and immunoblotted for p53 and actin. (B) HCT116 cells were transfected with pCMV6-HIPK1 for 24 h prior to immunofluorescence staining. p53 (green) mean of fluorescence was quantified in HIPK1 transfected (red) and untransfected HCT116 cells and each value was plotted on the graph. Error bars correspond to s.e.m. values. (C) HCT116 cells were transfected with pCMV6-HIPK1 for 24 h and immunostained to quantify the level of p21 expression by imaging cytometry. The percentage of 21+ cells was evaluated both in control and HIPK-1 transfected cells (left panel). The mean intensity of p21 staining was also determined in both types of samples (right panel). Error bars correspond to s.e.m. values (**p < 0.01). (D) HCT116 cells were transfected with vehicle (UN), pcDNA3.1, pCMV6-HIPK1, pCMV6-HIPK1 D315N or pCMV6-HIPK1 kinase domain for 24 h. Cellular extracts were then harvested and immunoblotted for p21, p53 and GAPDH. (E) HCT116 cells were transfected with pcDNA3.1 or pCMV6-HIPK1 for 24 h and treated with increasing amount of Etoposide (1–200 μM) for another day. Cells were fixed and immunostained for HIPK1 and p21. The percentage of p21-positive cells was determined using the Icys imaging cytometer. (F) HCT116 cells were transfected with pCMV6-HIPK1 for 24 h and immunostained to visualize HIPK1 (red fluorescence) and KI67 antigen as a marker of cell proliferation (green fluorescence). Images were acquired by confocal microscopy. Quantification of KI67 expression was measured using MetaMorph software. Error bars correspond to s.e.m. values (***p < 0.0001).
We then considered that if HIPK1 overexpression promotes p53-dependent transcription, it should automatically affect the expression of its endogenous targets. P53 serine 15 phosphorylation has previously been reported to lead to an increase in p21 transcription, an inhibitor of cyclin-dependent kinase, through which p53 mediates cell cycle arrest in response to DNA damage.20 We thus decided to evaluate p21 expression in response to HIPK1 overexpression by quantitative imaging using the Icys system in HCT116 cells. As for p53, etoposide was first used as a control of p21 induction and expression quantification (Fig. S5B). Once validated, the effects of HIPK1 were analyzed. After quantification, we found that both the mean nuclear fluorescence intensity (Fig. 4C left panel, i.e., 2,152 ± 95 for control cells vs. 3,548 ± 186 for HIPK1+ cells) and the percentage of p21+ cells (Fig. 4C, right panel, 6.3% ± 0.7 for control cells vs. 33.1 ± 2.3 for HIPK1+ cells) were higher in HIPK1-transfected cells than in control cells. This result was verified in HeLa cells (Fig. S7A) and further validated by western blotting in HCT116 cells (Fig. 4D). We indeed observed a 2-fold increase in p21 expression level in HIPK1-transfected cells, even though HCT116 have been described to exhibit a low level of p21 protein.22 Moreover, the latter assay confirmed the requirement of HIPK1 kinase activity for p21 induction. Corroborating these data, HIPK1-overexpressing cells exhibited an increased sensitivity to etoposide treatment compared with control cells (Fig. 4E). Only half as much drug was required to reach EC50 when measuring the percentage of p21-positive cells after treatment with this DNA damaging agent (i.e., EC50 = 17.55 µM for HCT116 pcDNA3.1 control cells and 8 µM for HIPK1-transfected cells).
To determine whether such changes in p21 expression were functionally relevant, we measured cell proliferation by monitoring the expression of KI-67 antigen in HIPK1-overexpressing cells (Fig. 4F). This nuclear protein is a well-known marker of cell proliferation and is present at all stages of the cell cycle.23 As expected, a high level of HIPK1 in the cells triggered a net decrease in KI67 expression. On average, a 40% drop in mean KI67 nuclear intensity was detected [Fig. 4E, right panel, i.e., 893.2 ± 26.2 for control cells (n = 207) vs. 549.9 ± 4.6 for HIPK1+ cells (n = 29), ***p < 0.0001]. Altogether, these data showed that increasing the amount of HIPK1 protein in CRC cells elicited p21 production and cell cycle arrest in a p53-dependent manner. Taking these results into consideration, we concluded that HIPK1 has an anti-proliferative function when it is overexpressed. These properties were further confirmed in HeLa cells by titrating BrdU incorporation in control vs. HIPK1-transfected cells. As displayed in Figure S7B, the percentage of cells in S phase, and thus able to replicate their DNA, was clearly reduced in cells overproducing HIPK1 protein (14.8%) compared with control (28.5%) or pcDNA3-transfected cells (25.5%).
HIPK1 control of p53 / p21 signaling pathway exists in patients
All the above-mentioned results indicate that overexpression of HIPK1 activates at least the p53/p21 signaling pathway in order to limit cell growth. If so, this would further mean that cancer cells at early stage develop defense mechanisms to fight against stress conditions and uncontrolled cell growth. To verify that such systems do occur in vivo, we decided to measure p21 transcript levels in patients and compared them to HIPK1 expression levels (Fig. 5). Even though p21-fold changes (FC) were quite moderate (×1.2 to 2.2, in general), the only patients who displayed an increased level of p21 mRNA were those overexpressing HIPK1 protein (> 41%). As p53 protein is usually highly mutated in CRC patients (mutation rate above 71% in our cohort), we subsequently checked the p53 mutational status of these 10 patients exhibiting elevated levels of HIPK1 protein and p21 mRNA (Table 2). Unlike the rest of the cohort, most of them (70%) harbored a native p53 protein, indicating that HIPK1 very likely induces p21 transcription through p53 in such patients.
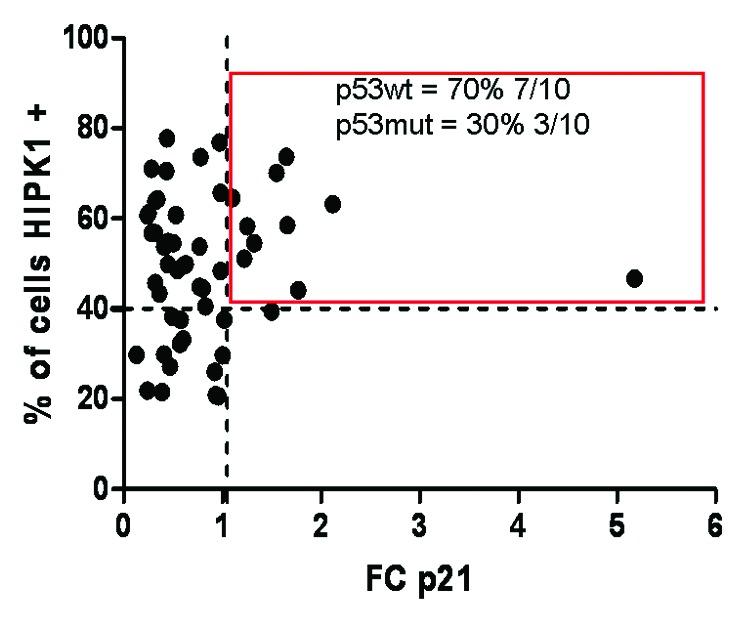
Figure 5. p21 mRNA expression level in function to HIPK1 protein level in patients. p21 transcript levels were determined by qPCR and compared with the level of HIPK1 protein found for each patient by immunohistochemistry. Patients HIPK1+ and p21+ are surrounded by a red square. The percentage of patients harboring a WT or mutated form of p53 in this group is displayed in the square.
Table 2. p53 mutational status of the ten patients HIPK+ (> 41%) - p21+.
| Patient number | p53 status |
|---|---|
| 1 |
WT |
| 2 |
(mut)* = WT |
| 3 |
WT |
| 4 |
WT |
| 5 |
WT |
| 6 |
MUT |
| 7 |
MUT |
| 8 |
WT |
| 9 |
WT |
| 10 | MUT |
p53 mutational status was determined as described in Soubeyran et al.14 The activity of each mutant was established using the p53 website (p53.free.fr).
Discussion
Following its identification, HIPK1 was hypothesized not only to play a positive role on tumor transformation, but also to be a potential pharmaceutical target for anticancer therapies, since it is a frequently upregulated protein in cancer cell lines. Nevertheless, HIPK1 function is not yet well defined, and other reports have also documented an opposite impact of HIPK1 on cellular fate,10,12,13 reporting notably a pro-apoptotic function mediated by the modulation of MAPK signaling.11
In this work, we explored the potential role of HIPK1 on tumorigenesis in order to elucidate whether it plays an oncogenic or a tumor-suppressive role during cancer progression. To this end, we used a TMA composed of 80 tumor-normal pairs of tissues isolated from patients with colorectal carcinoma, examined HIPK1 expression level ex vivo by imaging cytometry and compared the results to available clinical data. These analyses showed that HIPK1 is highly overexpressed in tumors compared with healthy mucosa, and that its expression in tumors evolves during disease progression. The highest peak of HIPK1 expression occurred at stage I/II, which presumably also explains the relationship between HIPK1 levels in tumors and the apparent benefits on OS. However, even though its expression decreased at a later stage, it was still higher than in healthy tissues, indicating that the increased OS associated with HIPK1+ patients may not be exclusively due to the stage of the disease. Altogether, this study showed that HIPK1 is suddenly overexpressed at the early onset of CRC and then is gradually lost over time. However, it was not yet clear whether that this factor was highly produced by the cancer cells as an indispensable factor for tumor evolution or, on the other hand, as a defense mechanism to fight against intern deregulations and stressful conditions.
To address this question, we then studied the repercussions of HIPK1 overexpression on various signaling pathways in vitro by using a CRC cell line model. Our results showed that a high intracellular level of HIPK1 affects the transcriptional activity of several promoters. At first sight, both pro- (NF-kB, myc/max, hypoxia, ERK) and anti-tumoral (p53) pathways were upregulated upon HIPK1 overexpression. Although surprising, this may indicate that, according to the cellular context (cell type, stress intensity), HIPK1 has the potential to modify the balance between pro-survival and pro-death signaling cascades and thus drive cell fate in one direction or another, as previously reported in the literature.10-13 However, in our experimental settings, the strongest action of HIPK1 was observed on the p53-dependent pathway, suggesting a predominance of anti-proliferative signals. In addition, a noteworthy effect was also measured on the AP-1 dependent promoter both for HCT116 and HeLa cells. The latter certainly correlates with the involvement of the kinase in MAPK signaling through the activation of ASK1/JNK/p38 kinases.12,13 This action, which was previously shown to trigger apoptosis, was not further studied here, but implies that the anti-tumoral effects of HIPK1 might also involve pro-apoptotic mechanisms. By stimulating both anti-proliferative and cell death pathways, HIPK1 overexpression may thus be seen as a powerful barrier to tumorigenesis.
With regard to p53, we not only found that HIPK1 activates promoters responding to this transcription factor, but also that both proteins co-immunoprecipitate. This implies that HIPK1 directly phophorylates p53, even if it cannot be excluded that another factor or a multiprotein complex is required for this event to occur.10,12,13 This interaction with p53 is also shared by two other members of the family: HIPK224 and the more recently described HIPK4.25 HIPK4 is structurally distant from HIPK1 and localizes exclusively in the cytosol. It has been shown to phosphorylate p53 on its serine 9, enhancing its repressor function on the survivin promoter.25 HIPK2, which is probably the best-characterized isoform of the family, shares a high percentage of homology with HIPK1. It also acts on p53 by triggering serine 46 phosphorylation upon DNA damage response (DDR) to allow the activation of the p53-dependent apoptotic program.24 Although p53-HIPK1 interaction has already been documented,7 the functional impact of HIPK1 on this pathway has not been further explored in cancer cells. Our results undoubtedly show that HIPK1 induces the phosphorylation of p53 on its serine-15. Phosphorylation of that residue has previously been described and was shown to be mediated by ATM (ataxia telangiectasia mutated) or ATR (ATM and Rad3-related) protein kinases after ionizing radiation or UV treatment.26-29 In such cases, this event led to p53 stabilization and an increase in its target gene transcription.20,21 While HIPK1 increased the intracellular amount of p53 total protein in HeLa cells, no expression changes were observed in HCT116. This event may thus be cell type-dependent or for some reason undetectable in our experimentations. Whatever the case, serine 15 phosphorylation induced a rise in p21 expression and cell cycle arrest in both cell lines, proving that HIPK1-induced p53 modifications activate the transcription factor to limit cell proliferation. This reinforces the idea that post-translational modifications of p53 may drive p53 target gene selectivity and cellular outcome.30 As previously shown for serine 46 with regard to the p53-dependent apoptotic program,31 HIPK1-induced p53 serine 15 phosphorylation may be a prerequisite for p53 cell cycle gene control. Indeed, HIPK1 overexpression halted cell proliferation rather than trigger the characteristic features of apoptosis in HeLa or HCT116 cell after transitory transfection (not shown), even though p53 and potentially ASK/JNK/p38 kinases (as proposed above) were supposedly induced. It is still puzzling to understand why and how HIPK1 specifically targets serine 15. However, previous works have already suggested that this residue can be targeted by kinases other than ATM post-UV treatment,27,28,32 including DNA-PK.33-35 Here we show that HIPK1 could be another candidate. This specificity might either come from a conformational constraint imposed by the formation of a multiprotein complex or a consensus sequence recognized by HIPK1. In any case, the ultimate goal of such a restricted pattern of phosphorylation may be necessary to transmit a proper cell cycle arrest signal. Serine 15 phosphorylation is usually known to transactivate p53 in an MDM2-dependent or -independent manner.36,37 This event has also been reported to favor the subsequent phosphorylation of threonine 18 and serine 20.38,39 Above all, we now confirm that HIPK1 induces p53 serine 15 phosphorylation, and that this sole event transactivates the transcription factor. Meanwhile, other post-translational modifications (i.e., acetylation, ubiquitination or sumoylation) were still possible. As reported for the RAX/PACT-PKR stress-signaling pathway, sumoylation events may be required for p53 phosphorylation.40 Bennett et al. reported that the RAX/PACT protein induces p53 lysine 386 sumoylation through an interaction with SUMO E2 ligase Ubc9 before triggering p53 serine 392 phosphorylation. These two post-translational modifications seemed sufficient to stabilize the transcription factor, enhance its transcriptional activity and trigger G1 arrest. Intriguingly, HIPK1 possesses five sumoylation sites and an SIM (SUMO interacting motif) domain, which may indicate that it also acts by triggering sumoylation events that may occur before or concomitantly to serine 15 phosphorylation.
All these results raise several questions about the possible role of an increased HIPK1 expression level in tumors, since the phenotype linked to HIPK1 overexpression in vitro is likely to be assimilated to quiescence or cellular senescence. HIPK1 has anti-proliferative functions when it is overexpressed, so it can be considered as a tumor suppressor rather than an oncogenic factor, at least in the context of colorectal cancers. Regarding our clinical data, we found a series of patients characterized by both an increased expression of HIPK1 and p21. Interestingly, most of them were harboring a WT p53, indicating that the above-mentioned pathway (HIPK1+ > p53 activation > p21 increase > cell cycle arrest) was presumably functional and activated in them. For the three patients presenting a mutated p53, a WT residual allele may have been sufficient to induce p21. Alternatively, this mutated form may still be effective for cell cycle control. From these data, we concluded that, concomitantly to pro-tumoral signals, a few anti-tumoral signaling pathways may be turned on and activated in cancer cells to limit tumor growth. Such reactions certainly occur early on during the process of cellular transformation in order to balance the effects of pro-oncogenic factors and try to stabilize the crisis situation. Therefore, it is highly possible that HIPK1 is overexpressed at early stages of cancer as a response to high-risk tumorigenic threats, as it has been shown for a few common sets of genes (i.e., ATM, Chk2, p53) involved in DDR.41,42 It would even be appealing to think that HIPK1 constitutes a new element of the DDR machinery that is specifically activated in pre-malignant CRC lesions, of which some are particularly prone to genetic instability,43 in order to delay cell division. We show here that, like ATM, HIPK1 is suddenly overexpressed during the initial phases of cancer development and is able to phosphorylate p53 serine 15. Moreover, at later stages, both ATM41,42 and HIPK1 (Fig. 1) expression tend to decrease. Interestingly, although necessary to constitute a first biological barrier to carcinogenesis, DDR also plays the villain by creating selective pressure for the emergence of mutations (within its own pathway) and the development of malignant clones. p53 instability in cancer might be such an example.44 In CRC, the adenoma-carcinoma sequence model proposed to explain the progression of the disease suggests that p53 mutations do not constitute the primary event leading to tumor initiation, but occur later on to promote tumor expansion.43 It is thus conceivable that the loss of HIPK1 overexpression observed in later-stage CRC cases results from a failure of the DDR, which presumably occurs after the p53 mutational event. Finally, even if the HIPK1 expression profile in tumors totally reflects the behavior of DDR genes, other properties of the kinase may explain its sudden rise in CRC, and, notably, its capacity to modulate oxidative stress through DJ-1 interaction.9 Proteomic analyses have recently shown that DJ-1 expression is also increased in fibroblasts and crypt epithelial cells of FAP (familial adenomatous polyposis) patients, who frequently develop colon cancer.45,46 The interplay between DJ-1 and HIPK1 proteins is quite complex, as (1) both proteins are intimately linked to the p53 signaling pathway7,47 and harbor antioxidant properties,9,48 and (2) at the same time, DJ-1 is able to induce HIPK1 degradation9 and rather holds pro-oncogenic properties.49 Whatever the case, it is intriguing to find that these two interrelated proteins are overexpressed either in potentially pre-cancerous (DJ-1) or in early stage cancerous (HIPK1) colorectal tissue. It might thus be possible that, during the initial steps of tumor formation, HIPK1 overexpression counterbalances and/or delays DJ-1 pro-tumoral action by notably competing with the p53 pathway.
Altogether, our results demonstrate that HIPK1 is overexpressed in the early stages of CRC and behaves more like a tumor suppressor gene than as an oncogene by turning on the p53/p21 signaling pathway.
Materials and Methods
TMA construction and clinical data
The TMA used in this study has been previously described and clinical data are also available.14 Briefly, the TMA was composed of both normal and tumoral tissues extracted from 80 patients with primary CRC. All these patients were operated and treated at the Institut Bergonié between January 1, 1999 and December 31, 2004. After surgery, fragments of tumors and normal mucosa were either frozen until DNA and RNA extractions or fixed in Holland’s Bouin and paraffin-embedded for pathological evaluation and TMA construction. Genomic DNAs were used to determine p53 mutational status by sequencing, while RNA extracts were used to quantify p21 transcript levels by qRT-PCR.14 The TMA was done to contain one core of normal mucosa (punched far away from the tumor) followed by three cores of tumoral tissues. Array sections were cut at 5 µm and placed on glass slides. All patients’ clinical characteristics are reported in Soubeyran et al.14
Cell lines, cell culture
HCT116 and HCT116 p53−/− cells were cultured in RPMI-1640 medium (GIBCO-Invitrogen) supplemented with 10% fetal bovine serum (FBS, Gibco, Invitrogen). Hela cells were grown in DMEM medium (Gibco-Invitrogen) supplemented with 10% FBS. All cell lines were maintained at 37°C in a humidified atmosphere with 5% CO2. Transitory transfections were made using Exgen 500 (Euromedex) according to the manufacturer’s instructions. Cells were analyzed 24–48 h post-transfection.
Plasmid construction and mutagenesis
pCMV6-HIPK1 was purchased from Origene. Flag-tags were amplified by PCR and then inserted at the N-terminal end of HIPK1 to generate the expression vector pCMV6-Flag-HIPK1. The cDNA encoding the kinase-inactive mutant HIPK1 D315N was made with the QuickChange II XL site-directed mutagenesis kit (Stratagene, Agilent Technologies) by using the following primers: (forward) 5′-GGTCTGATCCACGCTAACCTTAAGCCTG-3′ and (reverse) 5′-CAGGCTTAAGGTTAGCGTGGATCAGACC-3′.
Western blot analysis and immunoprecipitation
For western blot analysis, cells were harvested 24 h post-transfection or post-treatment, washed in PBS and placed in an equal volume of lysis buffer (1% Triton X100, 6.3% Glycerol, 20 mM TRIS-HCl pH 8, 137 mM NaCl, 1.5 mM MgCl2, 1 mM EGTA, 100 µM PMSF, 10 µg/ml Leupeptin, 10 µg/ml Aprotinin, 1 µg/ml Pepstatin) for 2 h at 4°C. Cells were then spun down for 10 min at 10,000 g at 4°C using an Eppendorf 5424R centrifuge and supernatants kept for protein quantification (Bradford assay, Sigma-Aldrich). Immunoprecipitation experiments were performed using the FLAG® Immunoprecipitation Kit (Sigma-Aldrich). All lysates were electrophoresed in a 10% SDS-PAGE, and transferred to PVDF membranes for immunoblotting with the appropriate primary antibody according the manufacturer’s instructions: anti-HIPK1 antibody (AP7137a, Abgent); anti-p53 antibody (DO-7 Ab; Dako); anti-serine 15 p53 antibody (Cell Signaling Technology); anti-p21 antibody (Cell Signaling); anti-Flag antibody (F7425, SIGMA). Membranes were then rinsed, incubated with the corresponding horseradish peroxidase-conjugated anti-mouse or anti-rabbit antibody (GE Healthcare Lifescience), and developed with ECL western blotting detection system (GE Healthcare Lifescience).
Immunofluorescence and image analysis
Cells were seeded onto glass coverslips in 24-well plates or directly added to 96-well plates the day prior to transfection, and fixed 24 h later with 3.7% formaldehyde for 10 min at room temperature (RT). After three washes in PBS, cells were permeabilized in 0.5% Triton X-100 for 5 min. Non-specific binding was blocked by incubating cells in 0.2% gelatin/PBS for 30 min at RT, and staining was performed using a specific primary antibody [anti-HIPK1 antibody, Abgent; anti-p21 antibody, clone CP74, ThermoScientific; anti-p53 antibody, DO-7 Ab; Dako; anti-Flag antibody F7425, SIGMA; anti-serine 6, 15, 20, 33, 37 or 46 p53 antibodies, Cell Signaling Technology; anti-KI67 antibody (clone MIB1, DAKO)] overnight at 4°C and a fluorescent secondary antibody conjugate [Alexa Fluor 488 (green) or 594 (red) anti-mouse or rabbit IgG, Molecular Probes, Life Technologies] for 1 h at RT. Nuclear staining was subsequently done with a 1/5,000 dilution of Hoechst 33258 (10 mg/ml) (Molecular Probes, Life technologies) for 10 min at RT. Coverslips were washed once in PBS and then mounted with Fluoromount G on glass slides. Image acquisition was performed using the LSM 510 Meta microscope for the slides, and the Icys® Research Imaging cytometer (Compucyte) for the 96-well plates. Images were quantified with the Multi Wavelength Cell Scoring application of Metamorph Software (Universal Imaging) and processed for figure assembly using CorelDraw Software. For each experiment (n = 2–3), at least 100 cells were counted for each sample.
Immunohistochemistry, TMA staining and image analysis
Immunohistochemistry (IHC) with HIPK1 antibody (Abgent) was performed on a 4 µm fixed paraffin-embedded TMA section mounted on a charged slide. The tissue section was de-paraffinized in toluene. After heat-induced proteolytic epitope retrieval in Tris-EDTA buffer (pH 9.0) for 20 min using a microwave oven, the primary antibody was incubated for 1 h at RT. After three PBS rinses, the TMA was incubated in presence of the HRP-conjugated secondary antibody for 30 mn at RT, according to the manufacturer’s instructions [EnVision® + Dual Link System-HRP (DAB+), Dako]. HIPK1 staining was revealed by the addition of di-aminobenzidine (DAB) substrate-chromogen. Nuclei were stained with Hematoxylin (Dako). Image acquisition and quantitative analyses were performed using the Icys® Research Imaging cytometer (Compucyte). Data were computed and analyzed using Excel and GraphPad software.
Transcriptional reporter assays
Cells were seeded in 96-well plates and cultured for 24 h before being co-transfected with the cignal reporter vector [CignalFinder™ Cancer 10-Pathway Reporter Array (luc), SABiosciences, Qiagen] and the expression vector. Cells were lyzed 48 h after transfection in 1× passive lysis buffer (Promega), and the luciferase activity was measured with a luminometer (Tecan Infinite F500, Tecan) containing an automatic injection module of the luciferase reagent (Dual-Luciferase® Reporter Assay System, Promega). Each measurement was done in quadruplicate and the experiment was repeated two or three times.
Analysis of DNA synthesis
Cells entering and progressing through the S phase of the cell cycle were detected using an anti-BrdU (BD-PharMingen, #555627, BD) according to the following protocol. HeLa cells seeded in a 96-well plate for 24 h were incubated with a solution of BrdU (10 µM) for 1 h. After fixation and permeabilization with a solution of ethanol at 70% for 20 min, cells were washed three times in PBS and treated with 2 M HCl for 30 min. Cells were then washed with 0.1 M sodium borate for 2 min, saturated with 0.5% of BSA and washed again with PBS before being successively incubated with the primary and secondary antibody for 1 h at room temperature. The plate was analyzed by laser scanning cytometry (Icys, Compucyte).
Supplementary Material
Acknowledgments
This work was supported by the French National Institute for Medical Research (INSERM), Aquitaine Region, French Ministry of Research, Institut Bergonié, Association for Cancer Research (ARC), the Ligue Contre le Cancer, Cancéropôle Grand Sud-Ouest and “Agir Cancer” Gironde. We thank Marion Zanese and Chantal Medina for their technical help.
Glossary
Abbreviations:
- HIPK1
homeodomain-interacting protein kinase 1
- CRC
colorectal cancer
- MAPK
mitogen-activated protein kinase
- AIP1
ASK-1-interacting protein 1
- NT
normal tissue
- TT
tumoral tissue
Disclosure of Potential Conflicts of Interest
No potential conflicts of interest were disclosed.
Supplemental Materials
Supplemental materials may be found here: www.landesbioscience.com/journals/cc/article/24927
Footnotes
Previously published online: www.landesbioscience.com/journals/cc/article/24927
References
- 1.Choi CY, Kim YH, Kim YO, Park SJ, Kim EA, Riemenschneider W, et al. Phosphorylation by the DHIPK2 protein kinase modulates the corepressor activity of Groucho. J Biol Chem. 2005;280:21427–36. doi: 10.1074/jbc.M500496200. [DOI] [PubMed] [Google Scholar]
- 2.Kim YH, Choi CY, Lee SJ, Conti MA, Kim Y. Homeodomain-interacting protein kinases, a novel family of co-repressors for homeodomain transcription factors. J Biol Chem. 1998;273:25875–9. doi: 10.1074/jbc.273.40.25875. [DOI] [PubMed] [Google Scholar]
- 3.Sung KS, Go YY, Ahn JH, Kim YH, Kim Y, Choi CY. Differential interactions of the homeodomain-interacting protein kinase 2 (HIPK2) by phosphorylation-dependent sumoylation. FEBS Lett. 2005;579:3001–8. doi: 10.1016/j.febslet.2005.04.053. [DOI] [PubMed] [Google Scholar]
- 4.Zhang Q, Yoshimatsu Y, Hildebrand J, Frisch SM, Goodman RH. Homeodomain interacting protein kinase 2 promotes apoptosis by downregulating the transcriptional corepressor CtBP. Cell. 2003;115:177–86. doi: 10.1016/S0092-8674(03)00802-X. [DOI] [PubMed] [Google Scholar]
- 5.Rinaldo C, Siepi F, Prodosmo A, Soddu S. HIPKs: Jack of all trades in basic nuclear activities. Biochim Biophys Acta. 2008;1783:2124–9. doi: 10.1016/j.bbamcr.2008.06.006. [DOI] [PubMed] [Google Scholar]
- 6.Huang H, Du G, Chen H, Liang X, Li C, Zhu N, et al. Drosophila Smt3 negatively regulates JNK signaling through sequestering Hipk in the nucleus. Development. 2011;138:2477–85. doi: 10.1242/dev.061770. [DOI] [PubMed] [Google Scholar]
- 7.Kondo S, Lu Y, Debbas M, Lin AW, Sarosi I, Itie A, et al. Characterization of cells and gene-targeted mice deficient for the p53-binding kinase homeodomain-interacting protein kinase 1 (HIPK1) Proc Natl Acad Sci USA. 2003;100:5431–6. doi: 10.1073/pnas.0530308100. [DOI] [PMC free article] [PubMed] [Google Scholar]
- 8.Nebral K, Denk D, Attarbaschi A, König M, Mann G, Haas OA, et al. Incidence and diversity of PAX5 fusion genes in childhood acute lymphoblastic leukemia. Leukemia. 2009;23:134–43. doi: 10.1038/leu.2008.306. [DOI] [PubMed] [Google Scholar]
- 9.Sekito A, Koide-Yoshida S, Niki T, Taira T, Iguchi-Ariga SM, Ariga H. DJ-1 interacts with HIPK1 and affects H2O2-induced cell death. Free Radic Res. 2006;40:155–65. doi: 10.1080/10715760500456847. [DOI] [PubMed] [Google Scholar]
- 10.Ecsedy JA, Michaelson JS, Leder P. Homeodomain-interacting protein kinase 1 modulates Daxx localization, phosphorylation, and transcriptional activity. Mol Cell Biol. 2003;23:950–60. doi: 10.1128/MCB.23.3.950-960.2003. [DOI] [PMC free article] [PubMed] [Google Scholar]
- 11.Song JJ, Lee YJ. Role of the ASK1-SEK1-JNK1-HIPK1 signal in Daxx trafficking and ASK1 oligomerization. J Biol Chem. 2003;278:47245–52. doi: 10.1074/jbc.M213201200. [DOI] [PubMed] [Google Scholar]
- 12.Li X, Zhang R, Luo D, Park SJ, Wang Q, Kim Y, et al. Tumor necrosis factor alpha-induced desumoylation and cytoplasmic translocation of homeodomain-interacting protein kinase 1 are critical for apoptosis signal-regulating kinase 1-JNK/p38 activation. J Biol Chem. 2005;280:15061–70. doi: 10.1074/jbc.M414262200. [DOI] [PubMed] [Google Scholar]
- 13.Li X, Luo Y, Yu L, Lin Y, Luo D, Zhang H, et al. SENP1 mediates TNF-induced desumoylation and cytoplasmic translocation of HIPK1 to enhance ASK1-dependent apoptosis. Cell Death Differ. 2008;15:739–50. doi: 10.1038/sj.cdd.4402303. [DOI] [PubMed] [Google Scholar]
- 14.Soubeyran I, Mahouche I, Grigoletto A, Leste-Lasserre T, Drutel G, Rey C, et al. Tissue microarray cytometry reveals positive impact of homeodomain interacting protein kinase 2 in colon cancer survival irrespective of p53 function. Am J Pathol. 2011;178:1986–98. doi: 10.1016/j.ajpath.2011.01.021. [DOI] [PMC free article] [PubMed] [Google Scholar]
- 15.Henriksen M, Miller B, Newmark J, Al-Kofahi Y, Holden E. Laser scanning cytometry and its applications: a pioneering technology in the field of quantitative imaging cytometry. Methods Cell Biol. 2011;102:161–205. doi: 10.1016/B978-0-12-374912-3.00007-9. [DOI] [PubMed] [Google Scholar]
- 16.Pozarowski P, Holden E, Darzynkiewicz Z. Laser scanning cytometry: principles and applications-an update. Methods Mol Biol. 2013;931:187–212. doi: 10.1007/978-1-62703-056-4_11. [DOI] [PMC free article] [PubMed] [Google Scholar]
- 17.Scheffner M, Werness BA, Huibregtse JM, Levine AJ, Howley PM. The E6 oncoprotein encoded by human papillomavirus types 16 and 18 promotes the degradation of p53. Cell. 1990;63:1129–36. doi: 10.1016/0092-8674(90)90409-8. [DOI] [PubMed] [Google Scholar]
- 18.Bunz F, Dutriaux A, Lengauer C, Waldman T, Zhou S, Brown JP, et al. Requirement for p53 and p21 to sustain G2 arrest after DNA damage. Science. 1998;282:1497–501. doi: 10.1126/science.282.5393.1497. [DOI] [PubMed] [Google Scholar]
- 19.Cai X, Liu X. Inhibition of Thr-55 phosphorylation restores p53 nuclear localization and sensitizes cancer cells to DNA damage. Proc Natl Acad Sci USA. 2008;105:16958–63. doi: 10.1073/pnas.0804608105. [DOI] [PMC free article] [PubMed] [Google Scholar]
- 20.Shouse GP, Cai X, Liu X. Serine 15 phosphorylation of p53 directs its interaction with B56gamma and the tumor suppressor activity of B56gamma-specific protein phosphatase 2A. Mol Cell Biol. 2008;28:448–56. doi: 10.1128/MCB.00983-07. [DOI] [PMC free article] [PubMed] [Google Scholar]
- 21.Sakaguchi K, Saito S, Higashimoto Y, Roy S, Anderson CW, Appella E. Damage-mediated phosphorylation of human p53 threonine 18 through a cascade mediated by a casein 1-like kinase. Effect on Mdm2 binding. J Biol Chem. 2000;275:9278–83. doi: 10.1074/jbc.275.13.9278. [DOI] [PubMed] [Google Scholar]
- 22.Chang LJ, Eastman A. Decreased translation of p21waf1 mRNA causes attenuated p53 signaling in some p53 wild-type tumors. Cell Cycle. 2012;11:1818–26. doi: 10.4161/cc.20208. [DOI] [PMC free article] [PubMed] [Google Scholar]
- 23.Scholzen T, Gerdes J. The Ki-67 protein: from the known and the unknown. J Cell Physiol. 2000;182:311–22. doi: 10.1002/(SICI)1097-4652(200003)182:3<311::AID-JCP1>3.0.CO;2-9. [DOI] [PubMed] [Google Scholar]
- 24.D’Orazi G, Cecchinelli B, Bruno T, Manni I, Higashimoto Y, Saito S, et al. Homeodomain-interacting protein kinase-2 phosphorylates p53 at Ser 46 and mediates apoptosis. Nat Cell Biol. 2002;4:11–9. doi: 10.1038/ncb714. [DOI] [PubMed] [Google Scholar]
- 25.Arai S, Matsushita A, Du K, Yagi K, Okazaki Y, Kurokawa R. Novel homeodomain-interacting protein kinase family member, HIPK4, phosphorylates human p53 at serine 9. FEBS Lett. 2007;581:5649–57. doi: 10.1016/j.febslet.2007.11.022. [DOI] [PubMed] [Google Scholar]
- 26.Banin S, Moyal L, Shieh S, Taya Y, Anderson CW, Chessa L, et al. Enhanced phosphorylation of p53 by ATM in response to DNA damage. Science. 1998;281:1674–7. doi: 10.1126/science.281.5383.1674. [DOI] [PubMed] [Google Scholar]
- 27.Canman CE, Lim DS, Cimprich KA, Taya Y, Tamai K, Sakaguchi K, et al. Activation of the ATM kinase by ionizing radiation and phosphorylation of p53. Science. 1998;281:1677–9. doi: 10.1126/science.281.5383.1677. [DOI] [PubMed] [Google Scholar]
- 28.Siliciano JD, Canman CE, Taya Y, Sakaguchi K, Appella E, Kastan MB. DNA damage induces phosphorylation of the amino terminus of p53. Genes Dev. 1997;11:3471–81. doi: 10.1101/gad.11.24.3471. [DOI] [PMC free article] [PubMed] [Google Scholar]
- 29.Tibbetts RS, Brumbaugh KM, Williams JM, Sarkaria JN, Cliby WA, Shieh SY, et al. A role for ATR in the DNA damage-induced phosphorylation of p53. Genes Dev. 1999;13:152–7. doi: 10.1101/gad.13.2.152. [DOI] [PMC free article] [PubMed] [Google Scholar]
- 30.Olsson A, Manzl C, Strasser A, Villunger A. How important are post-translational modifications in p53 for selectivity in target-gene transcription and tumour suppression? Cell Death Differ. 2007;14:1561–75. doi: 10.1038/sj.cdd.4402196. [DOI] [PubMed] [Google Scholar]
- 31.Smeenk L, van Heeringen SJ, Koeppel M, Gilbert B, Janssen-Megens E, Stunnenberg HG, et al. Role of p53 serine 46 in p53 target gene regulation. PLoS ONE. 2011;6:e17574. doi: 10.1371/journal.pone.0017574. [DOI] [PMC free article] [PubMed] [Google Scholar]
- 32.Canman CE, Lim DS. The role of ATM in DNA damage responses and cancer. Oncogene. 1998;17:3301–8. doi: 10.1038/sj.onc.1202577. [DOI] [PubMed] [Google Scholar]
- 33.Lees-Miller SP, Sakaguchi K, Ullrich SJ, Appella E, Anderson CW. Human DNA-activated protein kinase phosphorylates serines 15 and 37 in the amino-terminal transactivation domain of human p53. Mol Cell Biol. 1992;12:5041–9. doi: 10.1128/mcb.12.11.5041. [DOI] [PMC free article] [PubMed] [Google Scholar]
- 34.Woo RA, Jack MT, Xu Y, Burma S, Chen DJ, Lee PW. DNA damage-induced apoptosis requires the DNA-dependent protein kinase, and is mediated by the latent population of p53. EMBO J. 2002;21:3000–8. doi: 10.1093/emboj/cdf307. [DOI] [PMC free article] [PubMed] [Google Scholar]
- 35.Jack MT, Woo RA, Motoyama N, Takai H, Lee PW. DNA-dependent protein kinase and checkpoint kinase 2 synergistically activate a latent population of p53 upon DNA damage. J Biol Chem. 2004;279:15269–73. doi: 10.1074/jbc.M309917200. [DOI] [PubMed] [Google Scholar]
- 36.Shieh SY, Ikeda M, Taya Y, Prives C. DNA damage-induced phosphorylation of p53 alleviates inhibition by MDM2. Cell. 1997;91:325–34. doi: 10.1016/S0092-8674(00)80416-X. [DOI] [PubMed] [Google Scholar]
- 37.Dumaz N, Meek DW. Serine15 phosphorylation stimulates p53 transactivation but does not directly influence interaction with HDM2. EMBO J. 1999;18:7002–10. doi: 10.1093/emboj/18.24.7002. [DOI] [PMC free article] [PubMed] [Google Scholar]
- 38.Dumaz N, Milne DM, Meek DW. Protein kinase CK1 is a p53-threonine 18 kinase which requires prior phosphorylation of serine 15. FEBS Lett. 1999;463:312–6. doi: 10.1016/S0014-5793(99)01647-6. [DOI] [PubMed] [Google Scholar]
- 39.Saito S, Yamaguchi H, Higashimoto Y, Chao C, Xu Y, Fornace AJ, Jr., et al. Phosphorylation site interdependence of human p53 post-translational modifications in response to stress. J Biol Chem. 2003;278:37536–44. doi: 10.1074/jbc.M305135200. [DOI] [PubMed] [Google Scholar]
- 40.Bennett RL, Pan Y, Christian J, Hui T, May WS., Jr. The RAX/PACT-PKR stress response pathway promotes p53 sumoylation and activation, leading to G₁ arrest. Cell Cycle. 2012;11:407–17. doi: 10.4161/cc.11.2.18999. [DOI] [PMC free article] [PubMed] [Google Scholar]
- 41.Bartkova J, Horejsí Z, Koed K, Krämer A, Tort F, Zieger K, et al. DNA damage response as a candidate anti-cancer barrier in early human tumorigenesis. Nature. 2005;434:864–70. doi: 10.1038/nature03482. [DOI] [PubMed] [Google Scholar]
- 42.Bartek J, Lukas J, Bartkova J. DNA damage response as an anti-cancer barrier: damage threshold and the concept of ‘conditional haploinsufficiency’. Cell Cycle. 2007;6:2344–7. doi: 10.4161/cc.6.19.4754. [DOI] [PubMed] [Google Scholar]
- 43.Waldner MJ, Neurath MF. The molecular therapy of colorectal cancer. Mol Aspects Med. 2010;31:171–8. doi: 10.1016/j.mam.2010.02.005. [DOI] [PubMed] [Google Scholar]
- 44.Gorgoulis VG, Vassiliou LV, Karakaidos P, Zacharatos P, Kotsinas A, Liloglou T, et al. Activation of the DNA damage checkpoint and genomic instability in human precancerous lesions. Nature. 2005;434:907–13. doi: 10.1038/nature03485. [DOI] [PubMed] [Google Scholar]
- 45.Patel BB, Li XM, Dixon MP, Blagoi EL, Nicolas E, Seeholzer SH, et al. APC +/- alters colonic fibroblast proteome in FAP. Oncotarget. 2011;2:197–208. doi: 10.18632/oncotarget.241. [DOI] [PMC free article] [PubMed] [Google Scholar]
- 46.Yeung AT, Patel BB, Li XM, Seeholzer SH, Coudry RA, Cooper HS, et al. One-hit effects in cancer: altered proteome of morphologically normal colon crypts in familial adenomatous polyposis. Cancer Res. 2008;68:7579–86. doi: 10.1158/0008-5472.CAN-08-0856. [DOI] [PMC free article] [PubMed] [Google Scholar]
- 47.Shinbo Y, Taira T, Niki T, Iguchi-Ariga SM, Ariga H. DJ-1 restores p53 transcription activity inhibited by Topors/p53BP3. Int J Oncol. 2005;26:641–8. [PubMed] [Google Scholar]
- 48.Taira T, Saito Y, Niki T, Iguchi-Ariga SM, Takahashi K, Ariga H. DJ-1 has a role in antioxidative stress to prevent cell death. EMBO Rep. 2004;5:213–8. doi: 10.1038/sj.embor.7400074. [DOI] [PMC free article] [PubMed] [Google Scholar]
- 49.Nagakubo D, Taira T, Kitaura H, Ikeda M, Tamai K, Iguchi-Ariga SM, et al. DJ-1, a novel oncogene which transforms mouse NIH3T3 cells in cooperation with ras. Biochem Biophys Res Commun. 1997;231:509–13. doi: 10.1006/bbrc.1997.6132. [DOI] [PubMed] [Google Scholar]
Associated Data
This section collects any data citations, data availability statements, or supplementary materials included in this article.