

Abstract
Due to its role in aging and antitumor defense, cellular senescence has recently attracted increasing interest. However, there is currently no single specific marker that can unequivocally detect senescent cells. Here, we identified α-L-fucosidase (α-Fuc) as a novel sensitive biomarker for cellular senescence. Regardless of the stress stimulus and cell type, α-Fuc activity was induced in all canonical types of cellular senescence, including replicative, DNA damage- and oncogene-induced senescence. Strikingly, in most models the degree of α-Fuc upregulation was higher than the induction of senescence-associated β-galactosidase (SA-β-Gal), the current gold standard for senescence detection. As α-Fuc is convenient and easy to measure, we suggest its utility as a valuable marker, in particular in cells with low SA-β-Gal activity.
Keywords: biomarker, cellular senescence, lysosome, α-fucosidase, β-galactosidase, β-glucuronidase
Introduction
Cellular senescence is a stable state of growth arrest that was first recognized to occur in primary fibroblasts after having undergone a finite number of cell divisions.1 Nowadays, senescence is known to be not solely induced in response to the shortening of telomeres, a process referred to as replicative senescence, but to be triggered by various types of cell stress. Amongst others, chemotherapeutics, cytokines, reactive oxygen species, replicative stress, DNA damage, chromatin perturbation or abnormal oncogene activation have also been identified to induce cellular senescence.2-8
Senescence typically comes along with the flattening of cells, an increased cell size and with marked metabolic changes. A further hallmark of senescent cells is a sustained cell cycle arrest, established by the p53 and Rb pathways and maintained by an upregulation of p16Ink4a and p21WAF/CIP1.9,10 Senescent cells, moreover, start to secrete a wide spectrum of cytokines and growth factors, a feature collectively termed senescence-associated secretory phenotype (SASP).7,11,12 Widespread chromatin modifications, known as senescence-associated heterochromatin foci (SAHF), are also frequently observed. These SAHF contain chromatin repression marks, such as phospho-HP1γ, HMGA1, histone H3 trimethylation at lysine-9 (H3K9me) or the histone variant macroH2A.13,14 In addition, many senescence-inducing stimuli generate a sustained DNA damage response (DDR) that can be visualized by persistent nuclear DNA damage foci, termed “DNA segments with chromatin alterations reinforcing senescence” (DNA-SCARS), which accumulate DDR proteins, including ATM, CHK2, p53-binding protein-1 and the histone variant γH2AX.15
In the physiological context, senescence induction is known to be a powerful mechanism preventing cell transformation and tumorigenesis and has therefore attracted increasing scientific interest. However, the detection of senescent cells remains difficult due to the lack of specific biomarkers.16 Indeed, most determinants of cellular senescence, such as the upregulation of p53, p16Ink4a, p21WAF/CIP1 or SASP-associated cytokines, are not exclusively observed in senescence, but can also occur in other types of stress responses. In addition, alterations like SAHF or DNA-SCARS formation are frequently observed, but not necessarily a mandatory feature or exclusive to senescent cells.17
The current gold standard for the detection of senescence is the so-called senescence-associated β-galactosidase (SA-β-Gal) activity.18 Although SA-β-Gal has been first suggested as a distinct enzyme, its activity is derived from lysosomal β-Gal encoded by the GLB1 gene.19 β-Gal is an accepted marker of senescence, but its reliability and specificity have been questioned, as a positive β-Gal reaction has also been detected in human cancer cells that were chemically induced to differentiate, or upon contact inhibition.21-26 Moreover, several cell types, such as epithelial cells and murine fibroblasts generally show a weak β-Gal staining.18,27
In the present study, we investigated several lysosomal hydrolases for their suitability as senescence markers and identified α-fucosidase, a lysosomal glycosidase involved in the breakdown of glycoproteins, oligosaccharides and glycolipids, as a novel biomarker for senescence. We demonstrate that α-fucosidase, is upregulated at the levels of mRNA and enzyme activity in all canonical types of cellular senescence, including replicative, DNA damage- and oncogene-induced senescence. Our results suggest that detection of α-fucosidase might be a highly valuable biomarker for senescence in general and in particular in those cases where SA-β-Gal activity fails to properly discriminate between senescent and non-senescent cells.
Results and Discussion
Due to the increased lysosomal content of senescent cells, we investigated several lysosomal enzymes for their suitability as senescence markers. In first experiments, we induced senescence by treating HCT116 human colon cancer cells with the Aurora kinase inhibitor AZD1152-HQPA (AZD, barasertib). Senescence was verified by the lack of bromodeoxyuridine (BrdU) uptake, the typical appearance of flat, enlarged and multinucleated cells and a prominent expression of p21 after 7 d of drug treatment (Fig. 1A and B). Although often used as a model for senescence, AZD-treated HCT116 cells revealed a rather moderate staining for β-Gal using the traditional 5-bromo-4-chloro-3-indolyl-β-D-galactopyranoside (X-Gal) substrate (Fig. 1C). In contrast, when incubated for the same time with the α-L-fucosidase (α-Fuc) substrate 5-bromo-4-chloro-3-indolyl-α-L-fucopyranoside (X-Fuc), an intensive blue staining was obtained.

Figure 1. α-Fucosidase is a sensitive biomarker of cellular senescence. HCT116 cells were induced to undergo senescence by 7 d of treatment with the Aurora inhibitor AZD1152-HQPA (AZD; 500 ng/mL). (A) FACS analysis reveals BrdU uptake in control but not drug-treated cells. (B) Induction of p21 expression upon AZD treatment. (C) Parallel cytochemical analyses show a more intensive blue staining for α-Fuc as compared with β-Gal using X-Fuc and X-Gal substrate. (D) Fluorometric detection of β-Gal, α-Fuc and β-Gluc activities after indicated times of AZD treatment. One unit equates to the activity in control samples. (E) Protein lysates from cells treated for 7 d with AZD were analyzed for α-Fuc and β-Gal activities in the presence of the α-Fuc inhibitor deoxyfuconojirimycin. (F) qRT-PCR analysis of GLB1, GUSB1 and FUCA1 mRNA after AZD treatment. Panels (A–C) show representative data and panels (D–F) mean values ± SD, each from three independent experiments.
To further investigate the utility of α-Fuc as a senescence marker, we quantified respective enzyme activities in lysates of AZD-treated and control cells using the corresponding fluorogenic 4-methylumbelliferyl substrates. A time course experiment revealed a progressive increase of α-Fuc activity that became detectable after 3 d of drug treatment (Fig. 1D). Compared with α-Fuc, the increase of β-Gal was delayed and considerably weaker. An even lower increase was measured for β-glucuronidase (β-Gluc; Fig. 1D) and several other lysosomal enzymes, such as acid phosphatase, β-hexosaminidase, α-mannosidase and N-acetyl-β-glucosaminidase (data not shown). To investigate the specificity of the increased α-Fuc activity, we employed the α-Fuc-specific inhibitor deoxyfuconojirimycin,28 which dose-dependently inhibited α-Fuc but not β-Gal activity (Fig. 1E). In addition, quantitative RT-PCR analysis revealed that elevated α-Fuc activity correlated with an increased transcription of α-Fuc (Fig. 1F). In contrast, mRNA induction of GLB1 and GUSB1, the genes encoding β-Gal and β-Gluc, was considerably weaker during AZD-induced senescence.
The experiments suggest that α-Fuc is strongly induced during drug-induced senescence and might be an even more sensitive marker than other lysosomal hydrolases. To further investigate whether α-Fuc upregulation was a general phenomenon, we employed additional cell types and senescence models. In each of these, senescence was verified by measurement of BrdU uptake, p21 expression or histone H3K9 methylation (Fig. 2). First, we investigated replicative senescence of human WI-38 fibroblasts. Compared with cells with low population doublings, high-passage cells exhibited a strong induction of α-Fuc mRNA levels and enzyme activities, whereas only minor increases were observed for β-Gal and β-Gluc (Fig. 3). In addition, we analyzed oncogene-induced senescence and generated MCF7 breast cancer cells that expressed a doxycycline-inducible RasG12V protein. Similar to the previous models, also in oncogene-induced senescence, α-Fuc was most strongly induced among the tested hydrolases at the levels of mRNA and enzyme activity (Fig. 3).

Figure 2. Senescence alterations in different cell types and senescence models. (A) Replicative senescence in high-passage WI-38 human fibroblasts as compared with low-passage cells. (B) Oncogene-induced senescence was triggered in MCF7 human breast cancer cells expressing an inducible oncogenic RasG12V protein by 7 d of incubation with doxycycline. (C) NCI-H460 human lung cancer cells were induced to undergo drug-induced senescence by 7 d of incubation with bleomycin. (D) Apaf-1-deficient murine embryonic fibroblasts (MEFs) were induced to undergo drug-induced senescence by 7 d of incubation with bleomycin. For measurement of DNA synthesis senescent and proliferating cells were incubated 48 h before cell harvest with or without BrdU. Subsequently, cells were with stained for flow cytometry with a FITC-coupled BrdU antibody. Induction of p21 expression was analyzed by immunocytochemistry in proliferating control and senescent cells. Induction of senescence in MEFs was verified by immunofluorescent staining for histone H3K9 trimethylation (H3K9me). Green H3K9me staining was superimposed to staining for α-tubulin (red) and DNA staining with DAPI (blue).
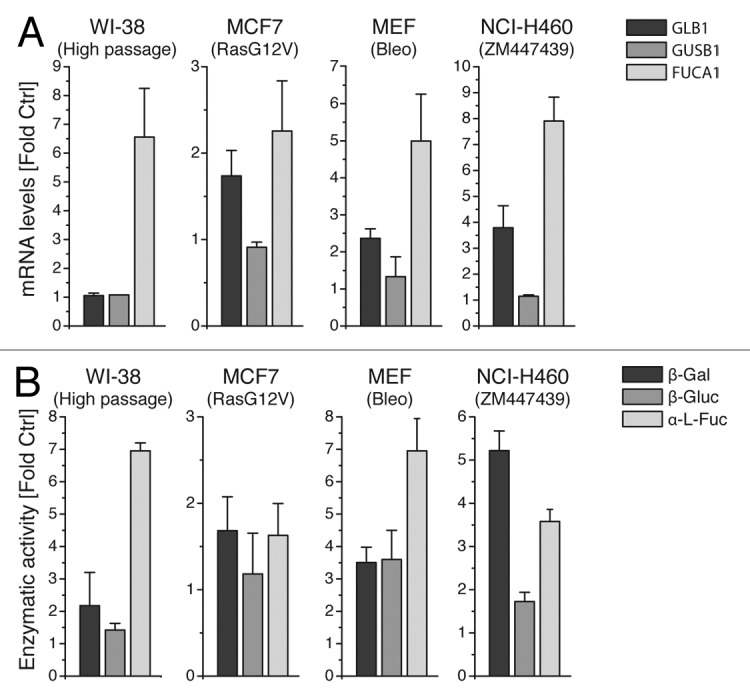
Figure 3. Increased α-fucosidase activity is a conserved hallmark in different types of senescence. Replicative senescence was investigated in low and high passage WI-38 fibroblasts. Oncogene-induced senescence was triggered in MCF7 cells by RasG12V expression for 7 d. Drug-induced senescence was studied in MEFs and NCI-H460 cells after 7 d of incubation with bleomycin and ZM447439, respectively. (A) Induction of GLB1, GUSB1 and FUCA1 mRNA in senescent and control cells. (B) Protein lysates from senescent and control cells were assayed for β-Gal, α-Fuc and β-Gluc activities using the corresponding 4-MU glycosides. Values are mean ± SD from three independent experiments.
We next investigated senescence in murine cells that generally stain less intensively for β-Gal.18 To this end, we employed Apaf-1-deficient murine embryonic fibroblasts (MEFs) that undergo senescence rather than apoptosis upon DNA damage.29 Indeed, treatment with bleomycin, a DNA-damaging drug, induced a > 6-fold increase of α-Fuc mRNA and enzyme activity, whereas induction of β-Gal and β-Gluc mRNA and corresponding enzyme activities was considerably weaker (Fig. 3). The only exception was found in NCI-H460 lung cancer cells, which, albeit α-Fuc mRNA was mostly strongly upregulated, showed the highest activity for β-Gal after senescence induction with the Aurora inhibitor ZM447439 (Fig. 3).
Thus, our results demonstrate a broad applicability of α-Fuc for the detection of cellular senescence. Unlike mediators of the DNA damage response or novel, but still unestablished, markers, such as transcription factor DEC1 or decoy death receptor DCR2,30 α-Fuc is easy and convenient to measure and to quantify using indigogenic or fluorogenic substrates. The upregulation of α-Fuc is consistent with the occurrence of several metabolic alterations during senescence. In this context, the aggregation of lipofuscin has recently been suggested as a suitable biomarker for cellular senescence,31 which might be related to the marked alterations of the lipid profile in senescent cells.11,32
The molecular mechanisms underlying the upregulation of α-Fuc and other lysosomal enzymes during senescence have been largely unknown. Recent studies, however, indicate that the activity of mammalian target of rapamycin (mTOR), which induces cell growth by promoting protein synthesis, is a regulator of lysosomal biogenesis.33 Interestingly, mTOR controls two transcription regulators, TFEB and ZKSCAN3, which control several genes for lysosomal proteins and might function as master regulators of lysosomal biogenesis.34-37 In this regard, conserved TFEB-binding DNA-regulatory elements are present in a large set of lysosomal genes, including those coding forβ-Gal and β-Gluc. Intriguingly, the TFEB-binding motif is absent in the α-Fuc gene,34 thus suggesting that the senescence-associated induction of α-Fuc does not simply reflect an increase in lysosomal biogenesis and that lysosomal hydrolases are not collectively upregulated during senescence. It will be therefore interesting to investigate the differential regulation of α-Fuc and other lysosomal enzymes by TFEB, ZKSCAN3 or still unknown transcription factors in different forms of senescence.
In summary, our results suggest that α-Fuc is a sensitive marker for different types of senescence in murine and human cells. Although we cannot not exclude that α-Fuc is increased in situations unrelated to senescence, our results demonstrate a strong α-Fuc induction in all canonical types of senescence. Thus, detection of α-Fuc might be in particular useful in those cases where low SA-β-Gal activity fails to discriminate between senescent and non-senescent cells.
Material and Methods
Cell culture
Apaf-1-deficient MEFs38 were cultured in DMEM (PAA), HCT116 cells in McCoy’s 5A medium (GIBCO), NCI-H460 cells in RPMI-1640 (PAA) and MCF7/TetOn-RasG12V cells in tetracycline-free DMEM (GIBCO). Media were supplemented with penicillin/streptomycin and 10% FCS (PAA). WI-38 fibroblasts were maintained in DMEM supplemented with 15% FCS, 1% sodium pyruvate, 1% MEM essential and non-essential amino acids and L-glutamine (GIBCO). HEK293FT cells were cultured in DMEM supplemented with 10% FCS, L-glutamine, sodium pyruvate, non-essential amino acids and neomycin (400 µg/mL). Cells were maintained at 37°C in the presence of 5% CO2, while WI-38 cells were cultured under low oxygen conditions (5% CO2/5% O2).
Generation of MCF7/TetOn-RasG12V cells
Oncogene-induced senescence was triggered by lentiviral expression of tetracycline-inducible RasG12V in MCF7 cells. To this end, HRasG12V cDNA was PCR-amplified with the primers 5′-CACCATGACGGAATATAAGCTGGT-3′ and 5′-TCAGGAGAGCACACACTTGCAGCTC-3′. The amplicon was cloned into pENTR-D-TOPO (Life Technologies) according to manufacturer’s protocols, yielding pENTR/HRasG12V. The pInducer20/TetOn-HRasG12V lentiviral vector was generated using gateway cloning (Life Technologies) by recombining pInducer20 plasmid39 with pENTR/HRasG12V using LR-Clonase II (Life Technologies). The plasmid was then co-transfected with lentiviral assembly ΔR8.9 and envelope (VSV)g plasmids into HEK293FT cells using jetPEI reagent (PEQLAB). Forty-eight h post-transfection, virus-containing culture supernatant was collected and concentrated with filter vials (Sartorius AG). MCF7 cells were transduced with virus-containing supernatant in the presence of polybrene (4 µg/mL; Sigma) for 48 h. Transduced cells were selected in the presence of neomycin (600 µg/mL) for 7 d and analyzed for RasG12V expression upon addition of doxycycline (2 µg/mL; Fagron) by immunoblotting.
Induction of cellular senescence
Cells were seeded 24 h prior to treatment at a density of 2 × 10⁴ cells/cm2. To induce cellular senescence, MEF/apaf-1−/− cells were treated with bleomycin (10 µg/mL; Medac), HCT116 cells with the Aurora inhibitor AZD1152-HQPA (2.5 µM; Biozol), NCI-H460 cells with the Aurora inhibitor ZM447439 (500 nM; Biozol) and MCF7/TetOn-RasG12V cells with 200 ng/mL doxycycline. Treatment was performed for 3 d. Hereafter, culturing was continued under standard conditions. Cells were analyzed for senescence-induced alterations after the indicated days of incubation. Senescent WI-38 cells were obtained by continuous culture until 55–58 population doublings (PDLs) were achieved. Control cells had undergone 32–35 PDLs.
BrdU assay
Incorporation of 5-bromo-2'-deoxyuridine (BrdU) was quantified using the FITC BrdU Flow kit (Becton Dickinson). Senescent and proliferating control cells were cultured for 48 h in the presence of 10 µM BrdU before subjecting them to flow cytometric measurements.
Immunocytochemical staining
Cells were seeded on coverslips at a density of 2 ×10⁴/cm2 and grown in appropriate culture media for 24 h before induction of senescence. After 7 d cells were fixed with methanol/acetone at −20°C for 10 min and subsequently incubated for 1 h in PBS containing 4% bovine serum albumin and 0.05% saponin.
SAHF-linked H3K9 methylation was assayed by immunofluorescence. Samples were incubated overnight with anti-α-tubulin (DM1a, 1:500, Sigma) and anti-H3K9me (Cell Signaling) antibodies. Then, samples were washed three times in PBS and incubated with secondary antibodies labeled with AlexaFluor488 and AlexaFluor594 (Life Technologies) for 2 h at room temperature. DNA was detected using DAPI (4’,6-diamidino-2-phenylindole, 1 µg/ml; Sigma). Analyses were performed with a Zeiss LSM 710 microscope equipped with 63× immersion objective at excitation wavelengths of 405, 488 and 546 nm.
Expression of p21 cells was analyzed by immune peroxidase staining. To this end, endogenous peroxidase was blocked in fixed samples with PBS containing 20% methanol and 0.3% H2O2 for 30 min. Subsequently, blocking buffer (1.5% FCS in PBS) was applied for 1 h, and cells were incubated with monoclonal anti-p21 antibody (SX118; 1:200; Becton Dickinson). After overnight incubation at 4°C, samples were washed three times with blocking buffer, incubated with biotin-conjugated goat anti-mouse IgG (0.6 µg/mL; Dianova) for 1 h and washed three times with PBS. Subsequently, staining was achieved with the Vectastain ABC Elite Standard kit (Vector Laboratories) and the substrate diaminobenzidine.
Cytochemical staining for hydrolase activities
After fixation in PBS/0.1% glutaraldehyde and washing in PBS cells were stained at 37°C for 24 h for hydrolase activities using specific indigogenic substrates in the indicated buffers containing 3 µM potassium ferrocyanide and 3 µM potassium ferricyanide. α-Fucosidase was detected in McIlvain phosphate-citrate buffer, pH 5.0, using 4 mM 5-bromo-4-chloro-3-indolyl-α-L-fucopyranoside (X-Fuc, Gold Biotechnology). β-Galactosidase was stained in 40 mM citric acid/sodium phosphate, pH 6.0 using the substrate 5-bromo-4-chloro-3-indolyl-β-D galactopyranoside (X-Gal) as described.18
Fluorimetric quantification of hydrolase activities
The activities of α-fucosidase, β-galactosidase and β-glucuronidase were quantified by the conversion of 4-methylumbelliferyl derivatives to the fluorescent product 4-methylumbelliferone (4-MU). To this end, senescent cells were generated as described above. Proliferating control cells were seeded at a density of 104 cells/cm2 2 d before the enzymatic analyses. At the day of analysis, cells were harvested by scraping, washed in ice-cold PBS and lysed in 3 µL of lysis buffer per cm2 of seeded cells at 4°C for 45 min. The lysis buffer contained 20 mM TRIS-HCl pH 7.4, 0.2% Triton X-100 and complete protease inhibitor cocktail (Roche). After centrifugation at 14,000 g and 4°C for 5 min, the supernatant was isolated, and the protein content was quantified using a BCA assay kit (Thermo Fischer Scientific). To measure hydrolase activities, 5 µL of the supernatant were incubated in 45 µL of hydrolase-specific reaction buffer containing hydrolase-specific 4-MU-glycosides for 1 h at 37°C. α-L-fucosidase was measured in 0.2 M sodium citrate pH 4.5, using 1 mM 4-MU-α-L-fucoside (Sigma), β-galactosidase in 66 mM NaCl, 66 mM Na2HPO4, 33 mM sodium citrate, pH 4.6, using 1 mM 4-MU-β-D-galactoside (Roth) as described.40 β-glucuronidase was measured in 200 mM sodium acetate buffer, pH 5.0, 10 mM EDTA, 0.01% BSA, 0.1% Triton X-100 using 2.5 mM 4-MU-β-D-glucuronide (Roth) according to Sperker et al.41 Enzymatic reactions were stopped by the addition of 0.2 mL Na2CO3, and reaction mixtures were centrifuged for 10 min at 2,000 g. The cleared supernatant was used to determine the concentration of 4-MU by fluorescence detection (excitation 355 nm, emission 460 nm) using an Infinite 200 Reader (Tecan, Männedorf, Switzerland). Absolute enzyme activities are given as substrate turnover per total protein in comparison to a 4-MU standard curve. Relative enzyme activities are given as fold control, whereas 1-fold was the average absolute enzyme activity of all three control samples harvested on days 3, 5 and 7 of senescence induction experiments. The competitive α-L-fucosidase inhibitor deoxyfuconojirimycin was obtained from Sigma, dissolved in ddH2O and used at the indicated concentrations.
Quantitative real-time PCR
Total RNA was isolated using the RNeasy mini kit from Qiagen, cDNA was obtained by reverse transcription (RT) of 5 µg total RNA using a two-step protocol: first, RNA was incubated with 50 µM random hexamer primers (Fermentas) and 40 units RNase inhibitor (RiboLock, Fermentas) at 65°C for 10 min. Subsequently, 200 units of reverse transcriptase (Revert Aid H Minus M-MuLV Reverse, Fermentas), 10 mM DTT and 400 µM dNTPs were added to a final volume of 25 µl, and samples were incubated at 42°C for 50 min followed by final heat inactivation at 72°C for 10 min. qPCR was performed in a LightCycler 480 instrument (Roche). Reactions contained Maxima SYBR Green qPCR Mastermix (Fermentas), 300 nM sense- and antisense primers and 2 µl cDNA. The qPCR program started with an initial denaturation step at 95°C for 10 min followed by 45 cycles at 95°C for 15 sec and 60°C for 1 min. Validated primers (QuantiTect Primer Assays) were acquired from Qiagen for human and murine β-actin (ACTB), aminolevulinate synthase-1 (ALAS), α-fucosidase (FUCA1), glyceraldehyde 3-phosphate dehydrogenase (GAPDH), β-galactosidase (GLB1) and β-glucuronidase (GUSB1). Results were normalized to GAPDH, AKTB and ALAS and analyzed with the ΔΔCt method to give fold-induction as compared with untreated control samples.
Acknowledgments
The authors wish to thank Francesco Cecconi, Stephen J. Elledge and Anna Kriebs for valuable materials. This work was supported by grants from the Deutsche Forschungsgemeinschaft (SFB773, SFB685, GRK1302), and the Deutsche Krebshilfe (Project No. 109894).
Glossary
Abbreviations:
- AZD
AZD1152-HQPA
- BrdU
5-bromo-2'-deoxyuridine
- DDR
DNA damage response
- DNA-SCARS
DNA segments with chromatin alterations reinforcing senescence
- FCS
fetal calf serum
- α-Fuc
α-L-fucosidase
- β-Gal
β-galactosidase
- β-Gluc
β-glucuronidase
- H3K9me
histone 3 at lysine 9 methylation
- MEF
murine embryonic fibroblast
- MU
4-methylumbelliferyl
- SA
senescence-associated
- SAHF
senescence-associated heterochromatin foci
- SASP
senescence-associated secretory phenotype
- X-Fuc
5-bromo-4-chloro-3-indolyl-α-L-fucopyranoside
- X-Gal
5-bromo-4-chloro-3-indolyl-β-D-galactopyranoside
Disclosure of Potential Conflicts of Interest
No potential conflicts of interest were disclosed.
Footnotes
Previously published online: www.landesbioscience.com/journals/cc/article/24944
References
- 1.Hayflick L, Moorhead PS. The serial cultivation of human diploid cell strains. Exp Cell Res. 1961;25:585–621. doi: 10.1016/0014-4827(61)90192-6. [DOI] [PubMed] [Google Scholar]
- 2.Mallette FA, Ferbeyre G. The DNA damage signaling pathway connects oncogenic stress to cellular senescence. Cell Cycle. 2007;6:1831–6. doi: 10.4161/cc.6.15.4516. [DOI] [PubMed] [Google Scholar]
- 3.Pospelova TV, Demidenko ZN, Bukreeva EI, Pospelov VA, Gudkov AV, Blagosklonny MV. Pseudo-DNA damage response in senescent cells. Cell Cycle. 2009;8:4112–8. doi: 10.4161/cc.8.24.10215. [DOI] [PMC free article] [PubMed] [Google Scholar]
- 4.Adams PD. Healing and hurting: molecular mechanisms, functions, and pathologies of cellular senescence. Mol Cell. 2009;36:2–14. doi: 10.1016/j.molcel.2009.09.021. [DOI] [PubMed] [Google Scholar]
- 5.Schmidt S, Essmann F, Cirstea IC, Kuck F, Thakur HC, Singh M, et al. The centrosome and mitotic spindle apparatus in cancer and senescence. Cell Cycle. 2010;9:4469–73. doi: 10.4161/cc.9.22.13684. [DOI] [PubMed] [Google Scholar]
- 6.Acosta JC, Gil J. Senescence: a new weapon for cancer therapy. Trends Cell Biol. 2012;22:211–9. doi: 10.1016/j.tcb.2011.11.006. [DOI] [PubMed] [Google Scholar]
- 7.Campisi J. Aging, cellular senescence, and cancer. Annu Rev Physiol. 2013;75:685–705. doi: 10.1146/annurev-physiol-030212-183653. [DOI] [PMC free article] [PubMed] [Google Scholar]
- 8.Braumüller H, Wieder T, Brenner E, Aßmann S, Hahn M, Alkhaled M, et al. T-helper-1-cell cytokines drive cancer into senescence. Nature. 2013;494:361–5. doi: 10.1038/nature11824. [DOI] [PubMed] [Google Scholar]
- 9.Witkiewicz AK, Knudsen KE, Dicker AP, Knudsen ES. The meaning of p16(ink4a) expression in tumors: functional significance, clinical associations and future developments. Cell Cycle. 2011;10:2497–503. doi: 10.4161/cc.10.15.16776. [DOI] [PMC free article] [PubMed] [Google Scholar]
- 10.Jänicke RU, Sohn D, Essmann F, Schulze-Osthoff K. The multiple battles fought by anti-apoptotic p21. Cell Cycle. 2007;6:407–13. doi: 10.4161/cc.6.4.3855. [DOI] [PubMed] [Google Scholar]
- 11.Quijano C, Cao L, Fergusson MM, Romero H, Liu J, Gutkind S, et al. Oncogene-induced senescence results in marked metabolic and bioenergetic alterations. Cell Cycle. 2012;11:1383–92. doi: 10.4161/cc.19800. [DOI] [PMC free article] [PubMed] [Google Scholar]
- 12.Collado M, Serrano M. The power and the promise of oncogene-induced senescence markers. Nat Rev Cancer. 2006;6:472–6. doi: 10.1038/nrc1884. [DOI] [PubMed] [Google Scholar]
- 13.Narita M, Nũnez S, Heard E, Narita M, Lin AW, Hearn SA, et al. Rb-mediated heterochromatin formation and silencing of E2F target genes during cellular senescence. Cell. 2003;113:703–16. doi: 10.1016/S0092-8674(03)00401-X. [DOI] [PubMed] [Google Scholar]
- 14.Sulli G, Di Micco R, d’Adda di Fagagna F. Crosstalk between chromatin state and DNA damage response in cellular senescence and cancer. Nat Rev Cancer. 2012;12:709–20. doi: 10.1038/nrc3344. [DOI] [PubMed] [Google Scholar]
- 15.Rodier F, Muñoz DP, Teachenor R, Chu V, Le O, Bhaumik D, et al. DNA-SCARS: distinct nuclear structures that sustain damage-induced senescence growth arrest and inflammatory cytokine secretion. J Cell Sci. 2011;124:68–81. doi: 10.1242/jcs.071340. [DOI] [PMC free article] [PubMed] [Google Scholar]
- 16.Lawless C, Wang C, Jurk D, Merz A, Zglinicki Tv, Passos JF. Quantitative assessment of markers for cell senescence. Exp Gerontol. 2010;45:772–8. doi: 10.1016/j.exger.2010.01.018. [DOI] [PubMed] [Google Scholar]
- 17.Kosar M, Bartkova J, Hubackova S, Hodny Z, Lukas J, Bartek J. Senescence-associated heterochromatin foci are dispensable for cellular senescence, occur in a cell type- and insult-dependent manner and follow expression of p16(ink4a) Cell Cycle. 2011;10:457–68. doi: 10.4161/cc.10.3.14707. [DOI] [PubMed] [Google Scholar]
- 18.Dimri GP, Lee X, Basile G, Acosta M, Scott G, Roskelley C, et al. A biomarker that identifies senescent human cells in culture and in aging skin in vivo. Proc Natl Acad Sci USA. 1995;92:9363–7. doi: 10.1073/pnas.92.20.9363. [DOI] [PMC free article] [PubMed] [Google Scholar]
- 19.Lee BY, Han JA, Im JS, Morrone A, Johung K, Goodwin EC, et al. Senescence-associated β-galactosidase is lysosomal β-galactosidase. Aging Cell. 2006;5:187–95. doi: 10.1111/j.1474-9726.2006.00199.x. [DOI] [PubMed] [Google Scholar]
- 20.Kurz DJ, Decary S, Hong Y, Erusalimsky JD. Senescence-associated (β)-galactosidase reflects an increase in lysosomal mass during replicative ageing of human endothelial cells. J Cell Sci. 2000;113:3613–22. doi: 10.1242/jcs.113.20.3613. [DOI] [PubMed] [Google Scholar]
- 21.Yang NC, Hu ML. The limitations and validities of senescence associated-β-galactosidase activity as an aging marker for human foreskin fibroblast Hs68 cells. Exp Gerontol. 2005;40:813–9. doi: 10.1016/j.exger.2005.07.011. [DOI] [PubMed] [Google Scholar]
- 22.Untergasser G, Gander R, Rumpold H, Heinrich E, Plas E, Berger P. TGF-beta cytokines increase senescence-associated beta-galactosidase activity in human prostate basal cells by supporting differentiation processes, but not cellular senescence. Exp Gerontol. 2003;38:1179–88. doi: 10.1016/j.exger.2003.08.008. [DOI] [PubMed] [Google Scholar]
- 23.Coates PJ. Markers of senescence? J Pathol. 2002;196:371–3. doi: 10.1002/path.1073. [DOI] [PubMed] [Google Scholar]
- 24.Severino J, Allen RG, Balin S, Balin A, Cristofalo VJ. Is beta-galactosidase staining a marker of senescence in vitro and in vivo? Exp Cell Res. 2000;257:162–71. doi: 10.1006/excr.2000.4875. [DOI] [PubMed] [Google Scholar]
- 25.Krishna DR, Sperker B, Fritz P, Klotz U. Does pH 6 beta-galactosidase activity indicate cell senescence? Mech Ageing Dev. 1999;109:113–23. doi: 10.1016/S0047-6374(99)00031-7. [DOI] [PubMed] [Google Scholar]
- 26.Yegorov YE, Akimov SS, Hass R, Zelenin AV, Prudovsky IA. Endogenous beta-galactosidase activity in continuously nonproliferating cells. Exp Cell Res. 1998;243:207–11. doi: 10.1006/excr.1998.4169. [DOI] [PubMed] [Google Scholar]
- 27.Itahana K, Itahana Y, Dimri GP. Colorimetric detection of senescence-associated β galactosidase. Methods Mol Biol. 2013;965:143–56. doi: 10.1007/978-1-62703-239-1_8. [DOI] [PMC free article] [PubMed] [Google Scholar]
- 28.Winchester B, Barker C, Baines S, Jacob GS, Namgoong SK, Fleet G. Inhibition of alpha-L-fucosidase by derivatives of deoxyfuconojirimycin and deoxymannojirimycin. Biochem J. 1990;265:277–82. doi: 10.1042/bj2650277. [DOI] [PMC free article] [PubMed] [Google Scholar]
- 29.Janssen K, Pohlmann S, Jänicke RU, Schulze-Osthoff K, Fischer U. Apaf-1 and caspase-9 deficiency prevents apoptosis in a Bax-controlled pathway and promotes clonogenic survival during paclitaxel treatment. Blood. 2007;110:3662–72. doi: 10.1182/blood-2007-02-073213. [DOI] [PubMed] [Google Scholar]
- 30.Collado M, Gil J, Efeyan A, Guerra C, Schuhmacher AJ, Barradas M, et al. Tumour biology: senescence in premalignant tumours. Nature. 2005;436:642. doi: 10.1038/436642a. [DOI] [PubMed] [Google Scholar]
- 31.Georgakopoulou EA, Tsimaratou K, Evangelou K, Fernandez Marcos PJ, Zoumpourlis V, Trougakos IP, et al. Specific lipofuscin staining as a novel biomarker to detect replicative and stress-induced senescence. A method applicable in cryo-preserved and archival tissues. Aging (Albany NY) 2013;5:37–50. doi: 10.18632/aging.100527. [DOI] [PMC free article] [PubMed] [Google Scholar]
- 32.Blagosklonny MV. Tumor suppression by p53 without apoptosis and senescence: conundrum or rapalog-like gerosuppression? Aging (Albany NY) 2012;4:450–5. doi: 10.18632/aging.100475. [DOI] [PMC free article] [PubMed] [Google Scholar]
- 33.Demidenko ZN, Zubova SG, Bukreeva EI, Pospelov VA, Pospelova TV, Blagosklonny MV. Rapamycin decelerates cellular senescence. Cell Cycle. 2009;8:1888–95. doi: 10.4161/cc.8.12.8606. [DOI] [PubMed] [Google Scholar]
- 34.Sardiello M, Palmieri M, di Ronza A, Medina DL, Valenza M, Gennarino VA, et al. A gene network regulating lysosomal biogenesis and function. Science. 2009;325:473–7. doi: 10.1126/science.1174447. [DOI] [PubMed] [Google Scholar]
- 35.Settembre C, Zoncu R, Medina DL, Vetrini F, Erdin S, Erdin S, et al. A lysosome-to-nucleus signalling mechanism senses and regulates the lysosome via mTOR and TFEB. EMBO J. 2012;31:1095–108. doi: 10.1038/emboj.2012.32. [DOI] [PMC free article] [PubMed] [Google Scholar]
- 36.Peña-Llopis S, Brugarolas J. TFEB, a novel mTORC1 effector implicated in lysosome biogenesis, endocytosis and autophagy. Cell Cycle. 2011;10:3987–8. doi: 10.4161/cc.10.23.18251. [DOI] [PMC free article] [PubMed] [Google Scholar]
- 37.Chauhan S, Goodwin JG, Chauhan S, Manyam G, Wang J, Kamat AM, et al. ZKSCAN3 Is a Master Transcriptional Repressor of Autophagy. Mol Cell. 2013;50:16–28. doi: 10.1016/j.molcel.2013.01.024. [DOI] [PMC free article] [PubMed] [Google Scholar]
- 38.Cecconi F, Alvarez-Bolado G, Meyer BI, Roth KA, Gruss P. Apaf1 (CED-4 homolog) regulates programmed cell death in mammalian development. Cell. 1998;94:727–37. doi: 10.1016/S0092-8674(00)81732-8. [DOI] [PubMed] [Google Scholar]
- 39.Meerbrey KL, Hu G, Kessler JD, Roarty K, Li MZ, Fang JE, et al. The pINDUCER lentiviral toolkit for inducible RNA interference in vitro and in vivo. Proc Natl Acad Sci USA. 2011;108:3665–70. doi: 10.1073/pnas.1019736108. [DOI] [PMC free article] [PubMed] [Google Scholar]
- 40.McGuire JB, James TJ, Imber CJ, St Peter SD, Friend PJ, Taylor RP. Optimisation of an enzymatic method for beta-galactosidase. Clin Chim Acta. 2002;326:123–9. doi: 10.1016/S0009-8981(02)00332-7. [DOI] [PubMed] [Google Scholar]
- 41.Sperker B, Mürdter TE, Backman JT, Fritz P, Kroemer HK. Expression of active human beta-glucuronidase in Sf9 cells infected with recombinant baculovirus. Life Sci. 2002;71:1547–57. doi: 10.1016/S0024-3205(02)01917-3. [DOI] [PubMed] [Google Scholar]