Abstract
During mouse antral follicle development, the oocyte chromatin gradually transforms from a less condensed state with no Hoechst-positive rim surrounding the nucleolus (NSN) to a fully condensed chromatin state with a Hoechst-positive rim surrounding the nucleolus (SN). Compared with SN oocytes, NSN oocytes display a higher gene transcription activity and a lower rate of meiosis resumption (G2/M transition), and they are mostly arrested at the two-cell stage after in vitro fertilization. To explore the differences between NSN and SN oocytes, and the maternal factors required for oocyte developmental competence, we compared the whole-transcriptome profiles between NSN and SN oocytes. First, we found that the NSN and SN oocytes were different in their metabolic pathways. In the phosphatidylinositol signaling pathway, the SN oocytes tend to produce diacylglycerol, whereas the NSN oocytes tend to produce phosphatidylinositol (3,4,5)-trisphosphate. For energy production, the SN oocytes and NSN oocytes differed in the gluconeogenesis and in the synthesis processes. Second, we also found that the key genes associated with oocyte meiosis and/or preimplantation embryo development were differently expressed in the NSN and SN oocytes. Our results illustrate that during the NSN-SN transition, the oocytes change their metabolic activities and accumulate maternal factors for further oocyte maturation and post-fertilization embryo development.
Keywords: oocyte, meiosis, NSN, SN, maternal effect
Introduction
During mammalian reproduction, genome transcription is silenced in oocytes before resumption of meiosis, and it is fully activated at the 2-cell stage after fertilization in the mouse. The biological processes of oocyte meiotic maturation, fertilization and early embryo development mainly depend on the oocyte maternal factors that accumulate in oocytes at the germinal vesicle (GV) stage. When the follicles develop to the antral follicle stage, the GV oocytes can be divided into two classes based on their chromatin configuration: the NSN oocytes, whose chromatin does not form a Hoechst-positive rim surrounding the nucleolus, and the SN oocytes, whose chromatin forms a Hoechst-positive rim surrounding the nucleolus.1
NSN oocytes occupy more than 90% of the GV oocytes before 16 d postpartum in C57/CBA mice, and SN oocytes first appear at 17 dpp and increase with the mouse age and the oocyte diameter2,3 (Fig. 1). When microinjecting BrUTP into the GV oocytes, NSN oocytes showed a high level fluorescence, whereas the fluorescence in SN oocytes was not obvious,3 indicating that the transcription in NSN oocytes was active but silenced in SN oocytes. Compared with SN oocytes, only 20–30% of the NSN oocytes were able to develop to the metaphase II stage and became mostly arrested at the 2-cell embryo stage after in vitro fertilization,4 indicating low developmental competence of the NSN oocytes. Recent data showed that the configuration of chromatin in GV oocytes was controlled by histone modifications,5 and the transcription silence of SN oocytes was controlled by the protein termed poly(rC) binding protein 1.6 However, how oocytes control the transition from NSN to SN is still not clear.
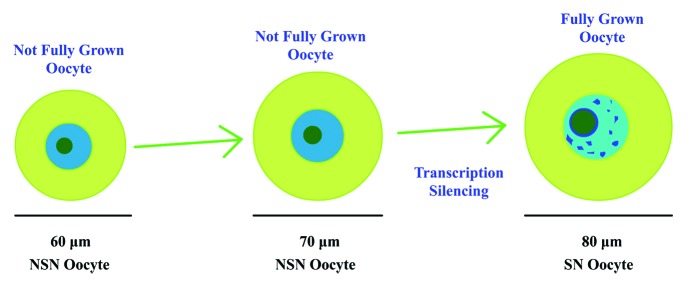
Figure 1. NSN oocytes and SN oocytes. The NSN oocytes represent not fully grown oocytes with a smaller diameter. The SN oocytes are fully grown oocytes whose diameters are about 80 μm.
To clarify the determining factors that support the NSN to SN transition state of oocytes, oocyte maturation and embryo development and to explore the mechanisms of oocyte gene expression regulation, we compared the transcriptomes of NSN and SN oocytes.
Results
Summary of the whole transcriptome of the NSN and SN oocytes
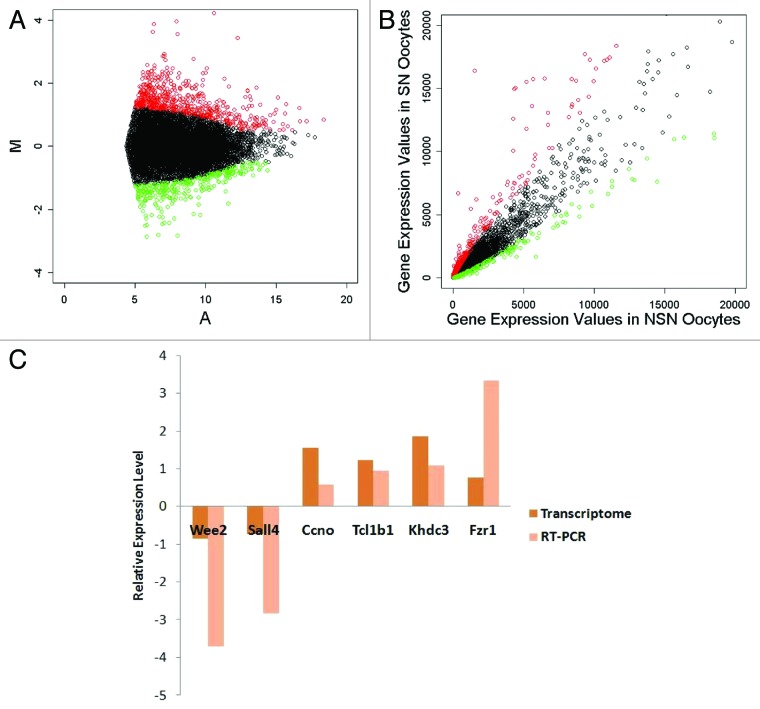
The whole transcriptomes of NSN and SN oocytes isolated from 8–9-wk-old female ICR strain mice were extracted and amplified. After sequencing the oocyte transcriptomes by the SOLiD RNA-Seq system, we mapped the 50 bp sequence reads to the mouse genome and obtained the gene expression values of the two groups of oocytes (for statistics of the data see Table 1). To evaluate the quality of the transcriptome data, an MA plot of the data was constructed (Fig. 2). We also compared the transcriptome data with the quantitative real-time PCR (qRT-PCR) result (Fig. 2). The correlation coefficient value was 0.79, indicating that the transcriptome data were reliable. By using the methods described in Materials and Methods and Figure 2, we filtered 627 upregulated genes and 332 downregulated genes in the SN oocyte group (Fig. 2; Table S1).
Table 1. Statistics of the transcriptome data of NSN and SN oocytes.
| Main gene class | Total gene number | NSN oocyte | SN oocyte | ||
|---|---|---|---|---|---|
| |
|
Gene detected |
Reads mapped |
Gene detected |
Reads mapped |
| Gene |
36 227 |
21 961 |
12 198 427 |
21 286 |
13 401 465 |
| mRNA |
15 274 |
10 355 |
6 054 686 |
10 061 |
6 860 882 |
| LincRNA |
469 |
382 |
114 380 |
372 |
116 032 |
| Retrotransposed |
349 |
132 |
15 764 |
152 |
19 980 |
| Pseudogene | 635 | 136 | 15 610 | 122 | 24 119 |
Figure 2. Transcriptome data evaluation and differentially expressed gene selection. (A) MA plot of the transcriptome data. (B) Scatter plot of the transcriptome data. (C) Quantitative RT-PCR evaluation of the transcriptome data, correlation coefficient = 0.79. Red, upregulated genes in SN oocytes; green, downregulated genes in SN oocytes.
Gene set enrichment analysis of the differentially expressed genes
The biological processes and cellular components in which the differentially expressed genes enriched were analyzed by DAVID (http://david.abcc.ncifcrf.gov/). The upregulated genes in SN oocytes were mainly enriched in biological processes, such as translation, cell division and oxidative phosphorylation, whereas about 58 genes associated with transcription were downregulated in SN oocytes. Based on the information about differentially expressed genes enrichment in cellular components, we found that the upregulated genes in SN oocytes were mainly located in mitochondria (49 genes) and the cytoskeleton (35 genes), and the downregulated genes in SN oocytes were mainly enriched in the nuclear lumen or the inner nuclear components (Tables 2 and 3). From the gene list in Table S1, we found that the upregulated genes in SN oocytes associated with translation mainly included the ribosomal proteins and the translation initiation factors; the downregulated genes in SN oocytes associated with transcription mainly included transcription factors such as GATA binding protein 3 (Gata3), CREB binding protein (Crebbp) and Notch gene homolog 1 (Notch1) as well as chromatin remodeling factors such as bromodomain containing 7 (Brd7) and chromodomain helicase DNA binding protein 7 (Chd7).
Table 2. Gene set enrichment analysis of differentially expressed genes (biological process).
| Differentially expressed genes | Gene ontology term | Gene count | p value |
|---|---|---|---|
| Upregulated genes in SN oocytes |
GO:0006412~translation |
21 |
3.23E-04 |
| GO:0051301~cell division |
19 |
4.94E-04 |
|
| GO:0006119~oxidative phosphorylation |
8 |
6.45E-04 |
|
| GO:0022904~respiratory electron transport chain |
6 |
7.45E-04 |
|
| GO:0022900~electron transport chain |
11 |
7.58E-04 |
|
| GO:0044265~cellular macromolecule catabolic process |
31 |
7.85E-04 |
|
| GO:0042773~ATP synthesis coupled electron transport |
5 |
0.001093 |
|
| GO:0009057~macromolecule catabolic process |
32 |
0.0011907 |
|
| GO:0006091~generation of precursor metabolites and energy |
17 |
0.0015853 |
|
| GO:0022618~ribonucleoprotein complex assembly |
6 |
0.001854 |
|
| GO:0040020~regulation of meiosis |
4 |
0.0019114 |
|
| GO:0051445~regulation of meiotic cell cycle |
4 |
0.002577 |
|
| GO:0000184~nuclear-transcribed mRNA catabolic process, nonsense-mediated decay |
5 |
0.0045214 |
|
| GO:0000280~nuclear division |
13 |
0.0046874 |
|
| GO:0007067~mitosis |
13 |
0.0046874 |
|
| GO:0006402~mRNA catabolic process |
6 |
0.0047719 |
|
| GO:0034622~cellular macromolecular complex assembly |
14 |
0.0051271 |
|
| GO:0042775~mitochondrial ATP synthesis coupled electron transport |
4 |
0.0053601 |
|
| GO:0000087~M phase of mitotic cell cycle |
13 |
0.0054213 |
|
| GO:0000278~mitotic cell cycle |
15 |
0.0054732 |
|
| GO:0048285~organelle fission |
13 |
0.0061819 |
|
| GO:0007049~cell cycle |
28 |
0.0062753 |
|
| GO:0022403~cell cycle phase |
18 |
0.0064598 |
|
| GO:0008380~RNA splicing |
13 |
0.0072332 |
|
| GO:0000279~M phase |
16 |
0.0083725 |
|
| GO:0006401~RNA catabolic process |
6 |
0.0084478 |
|
| Downregulated genes in SN oocytes | GO:0045449~regulation of transcription |
58 |
1.00E-04 |
| GO:0006350~transcription |
49 |
1.09E-04 |
|
| GO:0007017~microtubule-based process |
11 |
0.0019509 |
|
| GO:0060541~respiratory system development |
8 |
0.0035552 |
|
| GO:0006457~protein folding |
8 |
0.0040565 |
|
| GO:0030324~lung development |
7 |
0.0083707 |
|
| GO:0030323~respiratory tube development |
7 |
0.0091024 |
|
| GO:0035107~appendage morphogenesis |
7 |
0.0098787 |
|
| GO:0035108~limb morphogenesis | 7 | 0.0098787 |
Table 3. Gene set enrichment analysis of differentially expressed genes (cellular component).
| Differentially expressed genes | Gene ontology term | Gene count | p value |
|---|---|---|---|
| Upregulated genes in SN oocytes |
GO:0019866~organelle inner membrane |
26 |
4.22E-07 |
| GO:0005743~mitochondrial inner membrane |
25 |
5.83E-07 |
|
| GO:0070469~respiratory chain |
12 |
6.57E-07 |
|
| GO:0043228~non-membrane-bounded organelle |
80 |
6.25E-06 |
|
| GO:0043232~intracellular non-membrane-bounded organelle |
80 |
6.25E-06 |
|
| GO:0031967~organelle envelope |
33 |
7.88E-06 |
|
| GO:0005740~mitochondrial envelope |
27 |
8.07E-06 |
|
| GO:0031966~mitochondrial membrane |
26 |
8.26E-06 |
|
| GO:0031975~envelope |
33 |
8.59E-06 |
|
| GO:0031090~organelle membrane |
41 |
4.17E-05 |
|
| GO:0005829~cytosol |
31 |
7.01E-05 |
|
| GO:0030529~ribonucleoprotein complex |
26 |
3.30E-04 |
|
| GO:0044429~mitochondrial part |
28 |
4.12E-04 |
|
| GO:0031974~membrane-enclosed lumen |
48 |
0.0012262 |
|
| GO:0005840~ribosome |
14 |
0.0013113 |
|
| GO:0044430~cytoskeletal part |
35 |
0.0013578 |
|
| GO:0070013~intracellular organelle lumen |
46 |
0.0018264 |
|
| GO:0005819~spindle |
10 |
0.0018655 |
|
| GO:0031981~nuclear lumen |
38 |
0.0018765 |
|
| GO:0043233~organelle lumen |
46 |
0.0019646 |
|
| GO:0015630~microtubule cytoskeleton |
23 |
0.0027234 |
|
| GO:0005739~mitochondrion |
49 |
0.0076342 |
|
| Downregulated genes in SN oocytes | GO:0043228~non-membrane-bounded organelle |
51 |
3.10E-06 |
| GO:0043232~intracellular non-membrane-bounded organelle |
51 |
3.10E-06 |
|
| GO:0031981~nuclear lumen |
29 |
2.66E-05 |
|
| GO:0031974~membrane-enclosed lumen |
33 |
1.26E-04 |
|
| GO:0070013~intracellular organelle lumen |
32 |
1.53E-04 |
|
| GO:0043233~organelle lumen |
32 |
1.60E-04 |
|
| GO:0005694~chromosome |
15 |
7.31E-04 |
|
| GO:0000502~proteasome complex |
6 |
0.0011815 |
|
| GO:0005654~nucleoplasm |
18 |
0.0036785 |
|
| GO:0005730~nucleolus |
12 |
0.0037378 |
|
| GO:0044427~chromosomal part |
12 |
0.0045241 |
|
| GO:0044451~nucleoplasm part |
16 |
0.0047926 |
|
| GO:0031988~membrane-bounded vesicle |
14 |
0.0053389 |
|
| GO:0000777~condensed chromosome kinetochore |
5 |
0.0059936 |
|
| GO:0048770~pigment granule |
6 |
0.0062866 |
|
| GO:0042470~melanosome |
6 |
0.0062866 |
|
| GO:0000779~condensed chromosome, centromeric region | 5 | 0.0092689 |
KEGG pathway analysis of the differentially expressed genes
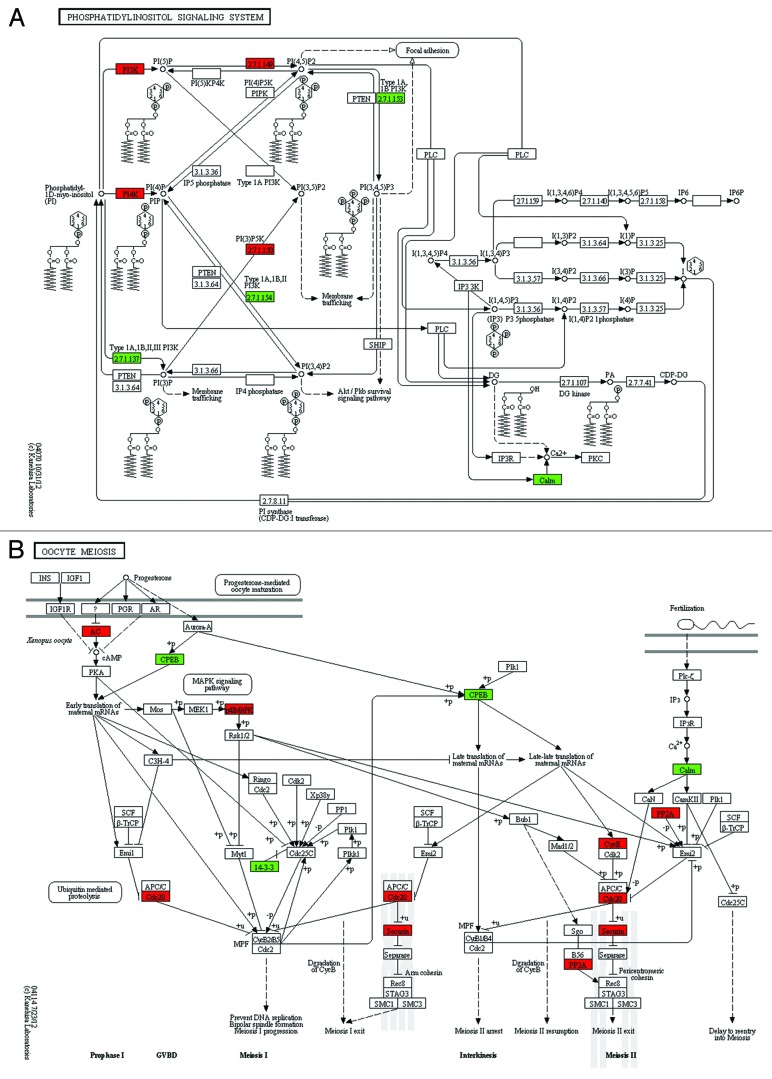
To investigate how the differentially expressed genes play a role in the biological pathways, we mapped these genes to the KEGG pathways in which upregulated genes in SN oocytes were marked red and downregulated genes were marked green. From the KEGG pathways, we picked out the pathways about the phosphatidylinositol signaling system and oocyte meiosis to illustrate the differences between NSN and SN oocytes (Fig. 3). From the phosphatidylinositol signaling system, we found that the metabolic pathway associated with diacylglycerol (DAG) was changed in SN oocytes. There were three substrates that could be lysed by phospholipase C (PLC) to produce DAG, including PI (phosphatidylinositol), PI(4)P (phosphatidylinositol 4-phosphate) and PI(4,5)P2 (phosphatidylinositol 4,5-bisphosphate). We found that enzymes like Pik3r1 (phosphatidylinositol 3-kinase regulatory subunit α) and Pik3c3 (phosphatidylinositol 3-kinase catalytic subunit type 3), which compete for substrates with PLC, were downregulated in SN oocytes, whereas enzymes like Pi4k2b (phosphatidylinositol 4-kinase type 2-β), Pikfyve (phosphoinositide kinase, FYVE finger containing), Pip4k2a (phosphatidylinositol-5-phosphate 4-kinase, type II, α) and Pip4k2c (phosphatidylinositol-5-phosphate 4-kinase, type II, gamma), which produce the substrates of PLC, were upregulated in SN oocytes.
Figure 3. KEGG pathway regarding the phosphatidylinositol signaling system and oocyte meiosis. (A) The diacylglycerol (DG or DAG) was produced by phospholipase C (PLC) lysing its substrates: phosphatidylinositol (PI), PI(4)P and PI(4,5)P2. The enzymes promoting the accumulation of these substrates, like PI4K (Pi4k2a), PI5K (Pikfyve), 2.7.1.149 (Pip4k2a, Pip4k2c), were upregulated in SN oocytes (red), whereas enzymes decreasing the PLC substrates like 2.7.1.137 (Pik3r1, Pik3r2, Pik3c3), 2.7.1.154 (Pik3r1, Pik3r2), 2.7.1.153 (Pik3r1, Pik3r2) were downregulated in SN oocytes (green). (B) AC, adenylate cyclase 1 (Adcy1); CPEB, cytoplasmic polyadenylation element binding protein 1 (Cpeb1); p42MAPK, mitogen-activated protein kinase 3 (Mapk3); Cdc20, cell division cycle 20 homolog; 14-3-3, tyrosine 3-monooxygenase/tryptophan 5-monooxygenase activation protein, epsilon polypeptide (Ywhae), β polypeptide (Ywhab); Securin, pituitary tumor-transforming gene 1 (Pttg1); PP2A, protein phosphatase 2, catalytic subunit, β isoform (Ppp2cb); CycE, cyclin E1 (Ccne1); and Calm, calmodulin 1 (Calm1). Upregulated genes in SN oocytes, red; downregulated genes in SN oocytes, green.
From the KEGG pathway during oocyte meiosis, we found that meiosis-associated key genes were differentially expressed in SN oocytes, in which downregulated genes included CPEB (Cpeb1, cytoplasmic polyadenylation element binding protein 1), 14-3-3 (Ywhae, tyrosine 3-monooxygenase/tryptophan 5-monooxygenase activation protein, epsilon polypeptide; and Ywhab) and Calm (Calm1, calmodulin 1). The genes whose mRNA level increased in SN oocytes included AC (Adcy1, adenylate cyclase 1), Cdc20 (Cdc20, cell division cycle 20 homolog), 14-3-3 (Ywhag), Securin (Pttg1, pituitary tumor-transforming gene 1), MAPK (Mapk3, mitogen-activated protein kinase 3), CycE (Ccne1, cyclin E1) and PP2A (Ppp2cb, protein phosphatase 2, catalytic subunit, β isoform).
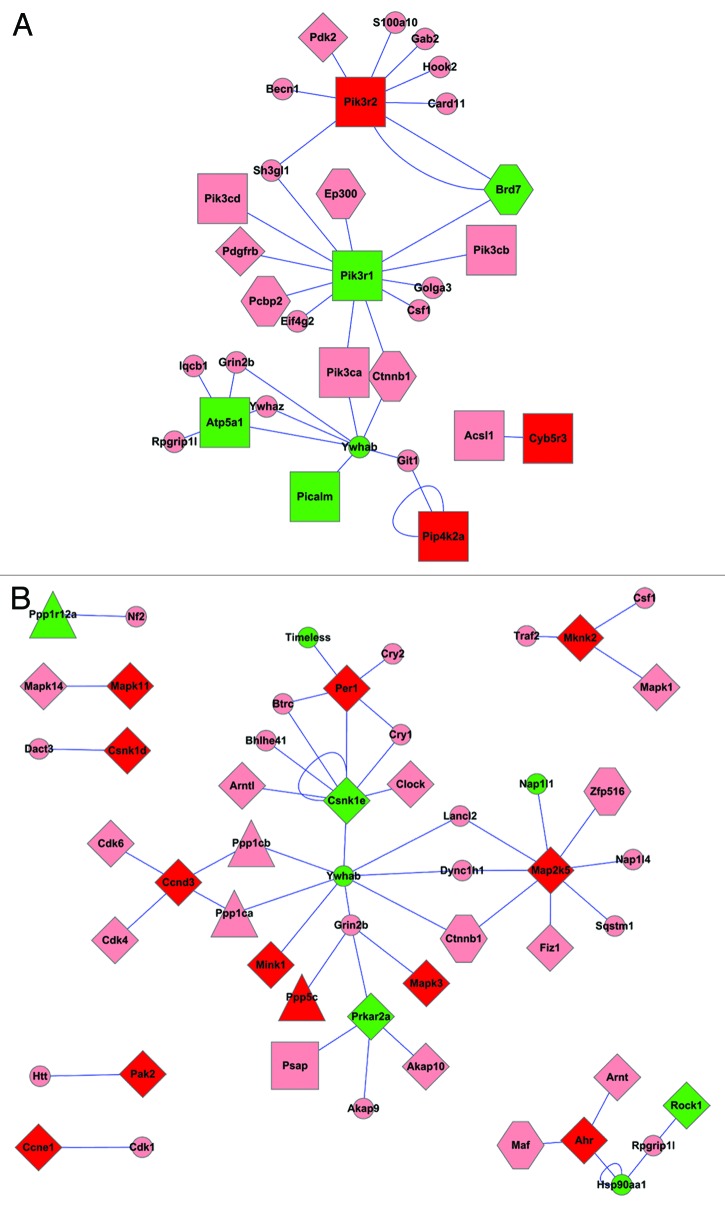
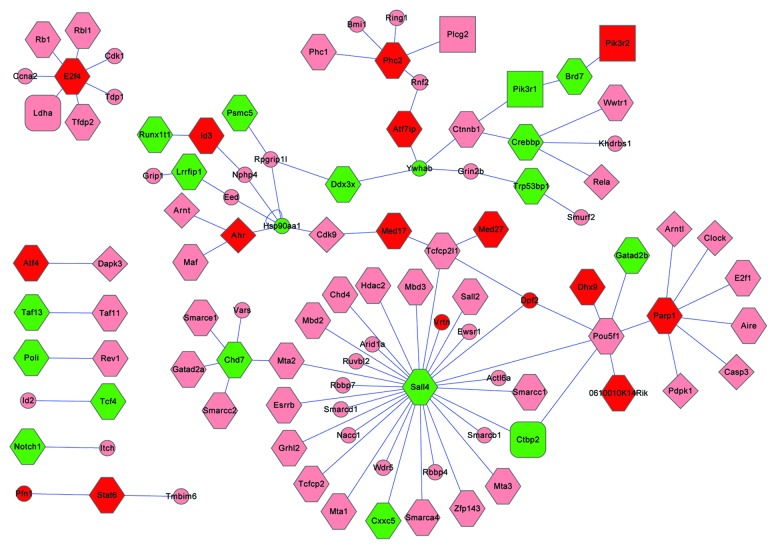
By using the methods described in the “Materials and Methods” section, we extracted the proteins that interact with the proteins encoded by the differentially expressed genes (Table S2). The protein interaction sub-networks of lipid metabolism, protein phosphatase and protein kinase and transcription factors with DNA binding proteins were extracted (Figs. 4 and 5).
Figure 4. The protein-protein interaction networks associated with lipid metabolic processes (A) and protein kinase and protein phosphatase (B). Red, upregulated; green, downregulated; light pink, proteins whose corresponding mRNAs show no obvious change. Rectangle, lipid metabolic processes associated protein; diamond, proteins associated with protein kinase; triangle, proteins associated with protein phosphatase; hexagon, proteins associated with transcription factors or BNA binding proteins; small ellipse, other proteins.
Figure 5. The protein-protein interaction networks associated with transcription factors and DNA binding. Red, upregulated; green, downregulated; light pink, proteins whose corresponding mRNAs show no obvious change. Round rectangle, glucose metabolic associated proteins; rectangle, lipid metabolic processes associated protein; diamond, proteins associated with protein kinase; triangle, proteins associated with protein phosphatase; hexagon, proteins associated with transcription factors or BNA binding proteins; small ellipse, other proteins.
Discussion
Metabolic differences between NSN and SN oocytes
The metabolic activities of mammalian oocytes are performed not only by the oocyte itself, but also by the surrounding granulosa cells. The cumulus cell-enclosed oocytes can take up pyruvate, but not glucose, from the environment.7,8 Previous data showed that the oocytes were able to obtain glucose from cumulus cells through gap junctions but not through the glucose transport proteins on the oocyte membrane.7 It is still not clear which approach is used by the oocyte to block glucose passing through its membrane. Recently, a report showed that cell insulin resistance was accompanied by an increase in DAG.9 Detailed investigations found that both liver and muscle insulin resistance was caused by DAG-induced activation of the protein kinase C.9-11 In our results, we found that the expression pattern changes of genes like Pik3r1, Pik3c3, Pi4k2b, Pikfyve, Pip4k2a and Pip4k2c might increase the PLC substrates: PI, PI(4)P and PI(4,5)P2.12,13 The increase in PLC substrates would lead to accumulation of DAG in SN oocytes. These results provide clues on the oocyte metabolism and on the question why oocytes cannot take up glucose directly; however, whether glucose transport is truly associated with the accumulation of DAG requires further investigation.
In addition to the metabolic pathways regarding DAG, the metabolic pathways related to glucose and pyruvate also changed (see Table S1; Fig. 6). Lactate dehydrogenase C (Ldhc) induced lactate transformation to pyruvate, and pyruvate carboxylase (Pcx) promoted the pyruvate carboxylation with CO2 to form oxaloacetate. Oxaloacetate is not only important for glyconeogenesis, but also important for the synthesis of amino acids. 6-phosphofructo-2-kinase/fructose-2,6-biphosphatase 3 (Pfkfb3) is a bifunctional enzyme: when the fructose-6-phosphate level is high, Pfkfb3 phosphorylates fructose-6-phosphate to form fructose-2,6-biphosphate through its 6-phosphofructo-2-kinase activity; otherwise, the Pfkfb3 can dephosphorylate the fructose-2,6-biphosphate to fructose-6-phosphate. The fructose-2,6-biphosphate is a strong activator of phosphofructokinase (Pfk), and Pfk is the key regulator of the glycolysis pathway. Thus, the level and activity of Pfkfb3 is important for the direction of the glucose metabolism. The glucose-6-phosphate dehydrogenase X-lined (G6pdx) induces glucose-6-phosphate entry to the pentose phosphate pathway, which is important for the synthesis of RNA or DNA. The glycogenin (Gyg) promotes the glycogen synthesis by which the oocyte can store energy materials for further development. The glycerol-3-phosphate acyltransferase 2, mitochondrial (Gpat2) induces the glycerol-3-phosphate to form glycerophospholipids, whereas the glycerol phosphate dehydrogenase 2, mitochondrial (Gpd2), located at the inner membrane of mitochondria, functions in the oxidative phosphorylation process. From the transcriptome analysis, we found that the mRNA levels of Ldhc, Pcx, Pfkfb3, G6pdx, Gyg and Gpat2 were upregulated in SN oocytes, whereas the mRNA level of Gpd2 was downregulated in SN oocytes. These results indicate that the gluconeogenesis process and the synthesis processes are significantly different between NSN and SN oocytes.
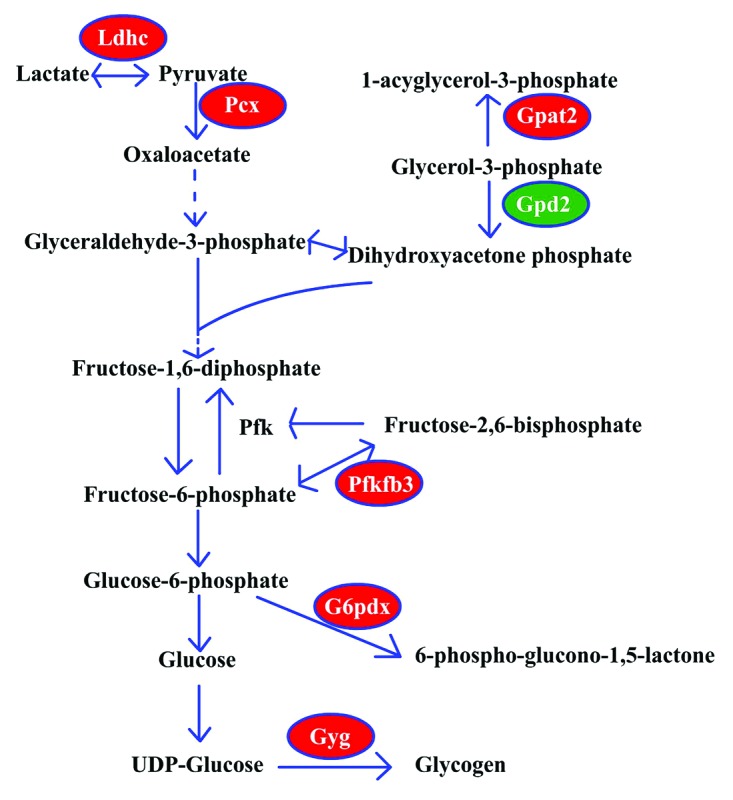
Figure 6. The metabolic pathway associated with pyruvate and glucose. Ldhc, lactate dehydrogenase C; Gpat2, glycerol-3-phosphate acyltransferase 2, mitochondrial; Gpd2, glycerol phosphate dehydrogenase 2, mitochondrial; Pcx, pyruvate carboxylase; Pfk, phosphofructokinase; Pfkfb3, 6-phosphofructo-2-kinase/fructose-2,6-biphosphatase 3; G6pdx, glucose-6-phosphate dehydrogenase X-linked; Gyg, glycogenin. Upregulated genes in SN oocytes, red; downregulated genes in SN oocytes, green.
Although deletion of Ldhc did not affect female mice, the Ldhc(−/−) male spermatozoa showed low motility and reduced ATP levels.14 The increase of Ldhc in SN oocytes might be associated with the energy production of oocytes. Pfk is the rate-limiting enzyme in glycolysis and shows high activity in cumulus cells.15 Because the glucose level is low in oocytes, the activity of Pfk in oocytes should be reduced, which might be regulated by the concentration of fructose-2,6-biphosphate. So the high level of Pfkfb3 might indicate more fructose-2,6-biphosphate activity than the 6-phosphofructo-2-kinase activity. The higher expression level of G6pdx in SN oocytes was consistent with the results in bovine oocytes,15 indicating that the glucose in oocytes could be directed toward the pentose phosphate pathway.
The differentially expressed genes associated with meiosis and with preimplantation embryo development
To prevent SN oocytes from resuming meiosis, a high level of cAMP concentration is maintained in oocytes. The increase of Adcy1 in SN oocytes indicates that meiosis resumption is strictly controlled. The Cpeb1 is also important for oocyte meiosis arrest, and when Cpeb1 was knocked out, oocytes could resume meiosis and undergo parthenogenetic cell division in the ovary.16 Although we detected a decrease of the Cpeb1 mRNAs in SN oocytes, Cpeb1 still expressed at a high level in SN oocytes. Unlike the key genes controlling meiosis resumption, the genes whose proteins participate in meiosis were found increased in SN oocytes, such as Cdc20; fizzy/cell division cycle 20 related 1 (Fzr1), budding uninhibited by benzimidazoles 1 homolog, β (Bub1b) and Pttg1. These results indicate that the SN oocytes are ready for meiosis and further development.
The MAP kinase kinase kinase (MAP3K) cascade pathway is essential for cells to respond the extracellular factors such as Kit. The MAP3Ks (such as MOS in the oocyte) phosphorylate MAP2Ks (such as MAP2K1 and MAP2K2), which further phosphorylate the MAPKs (such as MAPK1 and MAPK3). In fully grown mouse GV oocytes, the proteins of MAPK1, MAPK3, MAP2K1 and MAP2K2 are all synthesized, and all of them are in an inactive state.17,18 After polyadenylation of the Mos mRNA and before GVBD, the MOS protein is synthesized,19 and the MAP3K cascade is gradually activated. Although the MAP3K pathway is important for meiosis maturation and subsequent spindle assembly and accurate chromosome separation,17 the activation of MAPK is not essential for meiosis resumption. In our data, we detected an mRNAs increase of the MAP3K cascade-associated genes encoding MAP2Ks (Map2k7 and Map2k5) and MAPKs (Mapk11 and Mapk3). The increase of the MAP3K cascade pathway-associated mRNAs in SN oocytes indicates that these mRNAs might still not be sufficient in the NSN oocytes. So when NSN oocytes resumed meiosis, the quality of oocytes would be decreased.
In addition to the MAP3K cascade pathway, the phosphatidylinositol 3-kinase (PI3K) cascade pathway is also important to amplify the extracellular signals, like fibroblast growth factors, to support cell survival.20-22 In the PI3K pathway, the extracellular signals indirectly activate the PI3Ks: phosphatidylinositol 3-kinase, regulatory subunit, polypeptide 2 (Pik3r2) and Pik3r1. The PI3Ks promote the synthesis of PI(3,4,5)P3 (phosphatidylinositol (3,4,5)-trisphosphate), which further activates the protein kinase B (Pkb or AKT). Hyperactivation of AKT in oocytes would induce primordial follicle activation and premature ovary failure,23,24 whereas the inactivation of maternal AKT in early embryos would induce zygotic genome activation failure and embryo arrest at the 2-cell stage.25 Here we found that the mRNA level of Pik3r2 was upregulated in SN oocytes, whereas the mRNA level of Pik3r1 was downregulated. The changes of Pik3r1 and Pik3r2 may indicate different responses of NSN and SN oocytes to the extracellular signals. Previous reports also showed that Pik3r1 could decrease the ubiquitination of PTEN (phosphatase and tensin homolog deleted on chromosome ten), a negative regulator of the PI3K pathway.26 The detailed functions of PI3Ks in oocyte meiosis resumption still need further analysis.
For the mRNAs encoding maternal effects, factors may reduce their poly(A) tail length to prevent degradation,27 which could affect the reverse transcription efficiency when synthesizing the first strand of cDNAs. So the mRNAs whose levels decreased in SN oocytes may be induced by the short poly(A) tails. On the other hand, the mRNAs levels which increased in the SN oocytes may represent the changes of these mRNAs in the oocytes. From the published reports we found that numerous genes whose mRNAs increased in SN oocytes were important for oocyte maturation and early embryo development. The profiling 1 (Pfn1) was critical for actin de novo assembly, and the homozygous Pfn1−/− embryos died before the 2-cell stage.28 The KH domain containing 3, subcortical maternal complex member (Khdc3) is a component of the subcortical maternal complex, and it is essential for cleavage and embryo development.29 The oocyte-expressed protein homolog (Ooep) homozygous mutation mouse grew normally, whereas embryos from Ooep-null female mice arrested at the 2-cell or 4-cell stage.30 In addition, both the maternal XPA binding protein 2 (Xab2) and developmental pluripotency-associated 3 (Dppa3) were essential for the early embryo development.31,32 All the mRNA levels of the above genes were upregulated in SN oocytes, indicating that the SN stage is critical for the oocyte to prepare materials for early embryo development. In addition, we also found that the levels of mRNAs that encode the POU domain, class 5, transcription factor 1 (Pou5f1)-associated proteins changed significantly in SN oocytes (Fig. 4). These data may provide important information on how the zygote acquires totipotency for development.
Taken together, the transcriptome information of the NSN and SN oocytes revealed important genes associated with the oocyte developmental competence and others associated with the oocyte energy metabolism. Our data could provide valuable information for future investigations on oocyte meiosis regulation and oocyte metabolism.
Materials and Methods
Ethics statement
This study was approved by the Animal Care and Use Committee of the Institute of Zoology, Chinese Academy of Sciences and all animal manipulations were according to the guidelines of the Animal Care and Use Committee. For specific details and steps see the oocyte collection section.
NSN and SN oocyte collection
GV oocytes were collected from 8–9-wk-old ICR mice. Oocyte chromatin was stained with 10−5 M Hoechst 33342 diluted in PBS for 15 min. SN and NSN oocytes were distinguished and sorted under the fluorescence microscope. The NSN oocytes and SN oocytes were used for whole-transcriptome sequencing.
RNA amplification and SOLiD whole-transcriptome sequencing
Whole-transcriptome libraries of 10 SN and 10 NSN oocytes were established according to the instructions of Applied Biosystems SOLiD single-cell whole-transcriptome analysis procedure33 with some adjustments, which are summarized as follows. Each group of 10 oocytes was lysed in one tube, and the total mRNAs were reversely transcripted to cDNAs by UP1 adaptor primers including oligo(dT). The remaining primers were removed, and poly(A) tails were added to the 3′ terminal of the cDNAs. UP2 primers including oligo(dT) were used for the synthesis of the second cDNA strand. The cDNA library was amplified by UP1 and UP2 for 18 cycles and by AUP1 and AUP2 (amine-blocked UP1 and UP2) for 14 cycles. The final amplified cDNA libraries were used for sequencing in the Beijing Genome Institute and for real-time PCR analysis.
Data analysis and qRT-PCR verification
The 50 bp reads sequenced from the NSN and SN oocytes cDNA libraries were mapped to the ensembl 58 (mm9) version mouse genome. The normalization of mapping reads numbers of each single gene and the evaluation of NSN and SN transcriptome data was completed using DEGSeq software.34 Real-time PCR were used for further verification of data quality. Genes and primers used in qRT-PCR are listed in Table 4.
Table 4. Primers used in quantitative real-time PCR.
| Primers | Sequences |
|---|---|
| Wee2_F |
GCTGCAGGAGCAGAGTCTTT |
| Wee2_R |
TCTCCAAGAAAGGCCAGAGA |
| Ccno_F |
TCCAGTCAGGAGGCTGAGTT |
| Ccno_R |
CAAAAGGCATTCCAGCATTT |
| Khdc3_F |
GTGCAGGTTTGCCAGGAG |
| Khdc3_R |
ACTCTGTTCTTCCCGATTCCT |
| Fzr1_F |
GTATTCCCTCAGCAGCAAGC |
| Fzr1_R |
ACCAGTCCACCAAGTTGAGG |
| Sall4_F |
CATCTCCCACAAACCACCTT |
| Sall4_R |
TGAAGGTCTTTGGGTCTTGG |
| Tcl1b1_F |
CTGACCGTTCTCCCTAGCTG |
| Tcl1b1_R |
GGGGCAAATCTCCTACCACT |
| Ppia_F |
CGCGTCTCCTTCGAGCTGTTTG |
| Ppia_R | TGTAAAGTCACCACCCTGGCACAT |
Selection of differentially expressed genes
To eliminate the low quality data, the genes whose expression value (reads number) less than 20 were removed. For selection of the differentially expressed genes between SN oocytes and NSN oocytes, we focused on the gene max expression value (Max) and the fold change of gene expression value (FoldChange) in SN oocytes vs. NSN oocytes. We multiplied the rank of the absolute value of the log2(FoldChange): R1 = rank{abs[log2(FoldChange)]}; and the rank of square root of Max, R2 = rank[sqrt(Max)]. By this method, we combined the fold change and the expression value of each gene as M = R1*R2. After that, we ordered the M by ascending manner, and from the first 1,000 genes, we selected genes whose abs[log2(FoldChange)] value > 0.5 as differentially expressed genes for further analysis.
Gene ontology, KEGG pathway analysis and protein interaction analysis
To analyze the enrichment of the differentially expressed gene set, we used the methods from the DAVID website (http://david.abcc.ncifcrf.gov/). KEGG pathway graphs were constructed from the KEGG Mapper website (http://www.genome.jp/kegg/tool/color_pathway.html). The downregulated and upregulated genes were marked by green and red color, respectively.
To further analyze the effects of the differentially expressed genes on the oocytes, we searched the protein-protein interaction database IntAct (EBI)35 and extracted the proteins which interact with the proteins encoded by the differentially expressed genes. We analyzed the interaction of proteins in oocytes by three criteria: first, we extracted the proteins whose corresponding mRNAs exist in both SN and NSN oocytes (reads number > 20); second, we also extracted the proteins which interact directly with the differentially expressed genes encoded proteins; and third, we classified the selected proteins only by six classes: glucose metabolic processes associated proteins, lipid metabolic processes associated proteins, protein kinases, protein phosphatases, transcription factors or DNA binding proteins and others. For visualization of the protein-protein interaction data, we used the Cytoscape software.36
Supplementary Material
Acknowledgments
We thank Hua Qin for the preparation of quantitative RT-PCR and we also thank the students in Dr Sun’s Lab for insightful discussions. This study was supported by the Major Basic Research Program (2012CB944404, 2011CB944501) and National Natural Science Foundation of China (30930065) to Q.Y.S.
Glossary
Abbreviations:
- NSN
no Hoechst-positive rim surrounding the nucleolus
- SN
Hoechst-positive rim surrounding the nucleolus
- GV
germinal vesicle
- MAP3K
MAP kinase kinase kinase
- PI3K
phosphoinositide 3-kinase
Disclosure of Potential Conflicts of Interest
No potential conflicts of interest were disclosed.
Supplemental Materials
Supplemental materials may be found here: www.landesbioscience.com/journals/cc/article/24991
Footnotes
Previously published online: www.landesbioscience.com/journals/cc/article/24991
References
- 1.Tan JH, Wang HL, Sun XS, Liu Y, Sui HS, Zhang J. Chromatin configurations in the germinal vesicle of mammalian oocytes. Mol Hum Reprod. 2009;15:1–9. doi: 10.1093/molehr/gan069. [DOI] [PubMed] [Google Scholar]
- 2.Zuccotti M, Piccinelli A, Giorgi Rossi P, Garagna S, Redi CA. Chromatin organization during mouse oocyte growth. Mol Reprod Dev. 1995;41:479–85. doi: 10.1002/mrd.1080410410. [DOI] [PubMed] [Google Scholar]
- 3.Bouniol-Baly C, Hamraoui L, Guibert J, Beaujean N, Szöllösi MS, Debey P. Differential transcriptional activity associated with chromatin configuration in fully grown mouse germinal vesicle oocytes. Biol Reprod. 1999;60:580–7. doi: 10.1095/biolreprod60.3.580. [DOI] [PubMed] [Google Scholar]
- 4.Luo YB, Ma JY, Zhang QH, Lin F, Wang ZW, Huang L, et al. MBTD1 is associated with Pr-Set7 to stabilize H4K20me1 in mouse oocyte meiotic maturation. Cell Cycle. 2013;12:1142–50. doi: 10.4161/cc.24216. [DOI] [PMC free article] [PubMed] [Google Scholar]
- 5.Xia M, He H, Wang Y, Liu M, Zhou T, Lin M, et al. PCBP1 is required for maintenance of the transcriptionally silent state in fully grown mouse oocytes. Cell Cycle. 2012;11:2833–42. doi: 10.4161/cc.21169. [DOI] [PubMed] [Google Scholar]
- 6.Bellone M, Zuccotti M, Redi CA, Garagna S. The position of the germinal vesicle and the chromatin organization together provide a marker of the developmental competence of mouse antral oocytes. Reproduction. 2009;138:639–43. doi: 10.1530/REP-09-0230. [DOI] [PubMed] [Google Scholar]
- 7.Wang Q, Chi MM, Schedl T, Moley KH. An intercellular pathway for glucose transport into mouse oocytes. Am J Physiol Endocrinol Metab. 2012;302:E1511–8. doi: 10.1152/ajpendo.00016.2012. [DOI] [PMC free article] [PubMed] [Google Scholar]
- 8.Sutton-McDowall ML, Gilchrist RB, Thompson JG. The pivotal role of glucose metabolism in determining oocyte developmental competence. Reproduction. 2010;139:685–95. doi: 10.1530/REP-09-0345. [DOI] [PubMed] [Google Scholar]
- 9.Amati F. Revisiting the diacylglycerol-induced insulin resistance hypothesis. Obes Rev. 2012;13(Suppl 2):40–50. doi: 10.1111/j.1467-789X.2012.01036.x. [DOI] [PubMed] [Google Scholar]
- 10.Jornayvaz FR, Shulman GI. Diacylglycerol activation of protein kinase Cε and hepatic insulin resistance. Cell Metab. 2012;15:574–84. doi: 10.1016/j.cmet.2012.03.005. [DOI] [PMC free article] [PubMed] [Google Scholar]
- 11.Erion DM, Shulman GI. Diacylglycerol-mediated insulin resistance. Nat Med. 2010;16:400–2. doi: 10.1038/nm0410-400. [DOI] [PMC free article] [PubMed] [Google Scholar]
- 12.Rhee SG, Choi KD. Regulation of inositol phospholipid-specific phospholipase C isozymes. J Biol Chem. 1992;267:12393–6. [PubMed] [Google Scholar]
- 13.Crooke ST, Bennett CF. Mammalian phosphoinositide-specific phospholipase C isoenzymes. Cell Calcium. 1989;10:309–23. doi: 10.1016/0143-4160(89)90057-2. [DOI] [PubMed] [Google Scholar]
- 14.Odet F, Duan C, Willis WD, Goulding EH, Kung A, Eddy EM, et al. Expression of the gene for mouse lactate dehydrogenase C (Ldhc) is required for male fertility. Biol Reprod. 2008;79:26–34. doi: 10.1095/biolreprod.108.068353. [DOI] [PMC free article] [PubMed] [Google Scholar]
- 15.Cetica P, Pintos L, Dalvit G, Beconi M. Activity of key enzymes involved in glucose and triglyceride catabolism during bovine oocyte maturation in vitro. Reproduction. 2002;124:675–81. doi: 10.1530/rep.0.1240675. [DOI] [PubMed] [Google Scholar]
- 16.Racki WJ, Richter JD. CPEB controls oocyte growth and follicle development in the mouse. Development. 2006;133:4527–37. doi: 10.1242/dev.02651. [DOI] [PubMed] [Google Scholar]
- 17.Ou XH, Li S, Xu BZ, Wang ZB, Quan S, Li M, et al. p38α MAPK is a MTOC-associated protein regulating spindle assembly, spindle length and accurate chromosome segregation during mouse oocyte meiotic maturation. Cell Cycle. 2010;9:4130–43. doi: 10.4161/cc.9.20.13389. [DOI] [PMC free article] [PubMed] [Google Scholar]
- 18.Yu LZ, Xiong B, Gao WX, Wang CM, Zhong ZS, Huo LJ, et al. MEK1/2 regulates microtubule organization, spindle pole tethering and asymmetric division during mouse oocyte meiotic maturation. Cell Cycle. 2007;6:330–8. doi: 10.4161/cc.6.3.3805. [DOI] [PubMed] [Google Scholar]
- 19.Gebauer F, Xu W, Cooper GM, Richter JD. Translational control by cytoplasmic polyadenylation of c-mos mRNA is necessary for oocyte maturation in the mouse. EMBO J. 1994;13:5712–20. doi: 10.1002/j.1460-2075.1994.tb06909.x. [DOI] [PMC free article] [PubMed] [Google Scholar]
- 20.Hart KC, Robertson SC, Donoghue DJ. Identification of tyrosine residues in constitutively activated fibroblast growth factor receptor 3 involved in mitogenesis, Stat activation, and phosphatidylinositol 3-kinase activation. Mol Biol Cell. 2001;12:931–42. doi: 10.1091/mbc.12.4.931. [DOI] [PMC free article] [PubMed] [Google Scholar]
- 21.Ueki K, Fruman DA, Yballe CM, Fasshauer M, Klein J, Asano T, et al. Positive and negative roles of p85 alpha and p85 beta regulatory subunits of phosphoinositide 3-kinase in insulin signaling. J Biol Chem. 2003;278:48453–66. doi: 10.1074/jbc.M305602200. [DOI] [PubMed] [Google Scholar]
- 22.Troutman TD, Bazan JF, Pasare C. Toll-like receptors, signaling adapters and regulation of the pro-inflammatory response by PI3K. Cell Cycle. 2012;11:3559–67. doi: 10.4161/cc.21572. [DOI] [PMC free article] [PubMed] [Google Scholar]
- 23.Sobinoff AP, Sutherland JM, McLaughlin EA. Intracellular signalling during female gametogenesis. Mol Hum Reprod. 2013;19:265–78. doi: 10.1093/molehr/gas065. [DOI] [PubMed] [Google Scholar]
- 24.Jagarlamudi K, Liu L, Adhikari D, Reddy P, Idahl A, Ottander U, et al. Oocyte-specific deletion of Pten in mice reveals a stage-specific function of PTEN/PI3K signaling in oocytes in controlling follicular activation. PLoS One. 2009;4:e6186. doi: 10.1371/journal.pone.0006186. [DOI] [PMC free article] [PubMed] [Google Scholar]
- 25.Zheng W, Gorre N, Shen Y, Noda T, Ogawa W, Lundin E, et al. Maternal phosphatidylinositol 3-kinase signalling is crucial for embryonic genome activation and preimplantation embryogenesis. EMBO Rep. 2010;11:890–5. doi: 10.1038/embor.2010.144. [DOI] [PMC free article] [PubMed] [Google Scholar]
- 26.Cheung LW, Hennessy BT, Li J, Yu S, Myers AP, Djordjevic B, et al. High frequency of PIK3R1 and PIK3R2 mutations in endometrial cancer elucidates a novel mechanism for regulation of PTEN protein stability. Cancer Discov. 2011;1:170–85. doi: 10.1158/2159-8290.CD-11-0039. [DOI] [PMC free article] [PubMed] [Google Scholar]
- 27.Vasudevan S, Seli E, Steitz JA. Metazoan oocyte and early embryo development program: a progression through translation regulatory cascades. Genes Dev. 2006;20:138–46. doi: 10.1101/gad.1398906. [DOI] [PubMed] [Google Scholar]
- 28.Witke W, Sutherland JD, Sharpe A, Arai M, Kwiatkowski DJ. Profilin I is essential for cell survival and cell division in early mouse development. Proc Natl Acad Sci USA. 2001;98:3832–6. doi: 10.1073/pnas.051515498. [DOI] [PMC free article] [PubMed] [Google Scholar]
- 29.Li L, Baibakov B, Dean J. A subcortical maternal complex essential for preimplantation mouse embryogenesis. Dev Cell. 2008;15:416–25. doi: 10.1016/j.devcel.2008.07.010. [DOI] [PMC free article] [PubMed] [Google Scholar]
- 30.Tashiro F, Kanai-Azuma M, Miyazaki S, Kato M, Tanaka T, Toyoda S, et al. Maternal-effect gene Ces5/Ooep/Moep19/Floped is essential for oocyte cytoplasmic lattice formation and embryonic development at the maternal-zygotic stage transition. Genes Cells. 2010;15:813–28. doi: 10.1111/j.1365-2443.2010.01420.x. [DOI] [PubMed] [Google Scholar]
- 31.Yonemasu R, Minami M, Nakatsu Y, Takeuchi M, Kuraoka I, Matsuda Y, et al. Disruption of mouse XAB2 gene involved in pre-mRNA splicing, transcription and transcription-coupled DNA repair results in preimplantation lethality. DNA Repair (Amst) 2005;4:479–91. doi: 10.1016/j.dnarep.2004.12.004. [DOI] [PubMed] [Google Scholar]
- 32.Bortvin A, Goodheart M, Liao M, Page DC. Dppa3/Pgc7/stella is a maternal factor and is not required for germ cell specification in mice. BMC Dev Biol. 2004;4:2. doi: 10.1186/1471-213X-4-2. [DOI] [PMC free article] [PubMed] [Google Scholar]
- 33.Lao KQ, Tang F, Barbacioru C, Wang Y, Nordman E, Lee C, et al. mRNA-sequencing whole transcriptome analysis of a single cell on the SOLiD system. J Biomol Tech. 2009;20:266–71. [PMC free article] [PubMed] [Google Scholar]
- 34.Wang L, Feng Z, Wang X, Wang X, Zhang X. DEGseq: an R package for identifying differentially expressed genes from RNA-seq data. Bioinformatics. 2010;26:136–8. doi: 10.1093/bioinformatics/btp612. [DOI] [PubMed] [Google Scholar]
- 35.Aranda B, Achuthan P, Alam-Faruque Y, Armean I, Bridge A, Derow C, et al. The IntAct molecular interaction database in 2010. Nucleic Acids Res. 2010;38(Database issue):D525–31. doi: 10.1093/nar/gkp878. [DOI] [PMC free article] [PubMed] [Google Scholar]
- 36.Cline MS, Smoot M, Cerami E, Kuchinsky A, Landys N, Workman C, et al. Integration of biological networks and gene expression data using Cytoscape. Nat Protoc. 2007;2:2366–82. doi: 10.1038/nprot.2007.324. [DOI] [PMC free article] [PubMed] [Google Scholar]
Associated Data
This section collects any data citations, data availability statements, or supplementary materials included in this article.


