

Abstract
Purpose
To establish relationships between quantitative magnetic resonance imaging (qMRI) and biomechanical parameters to help inform and interpret alterations of human intervertebral discs (IVD) with different grades of degeneration.
Materials and Methods
The properties of the nucleus pulposus (NP) and annulus fibrosus (AF) tissues of each IVD of 10 lumbar spines (range 32–77 years) were analyzed by qMRI (relaxation times T1 and T2, magnetization transfer ratio MTR and apparent diffusion coefficient ADC), and tested in confined compression and dynamic shear.
Results
T1 and T2 significantly decreased in both the NP and AF with increasing degeneration grades while the MTR increased significantly with grade 4. In contrast with the others qMRI parameters, the ADC had a tendency to decrease with increasing grade. Disc degeneration caused a decrease in the aggregate modulus, hydraulic permeability and shear modulus magnitude along with an increase in phase angle in the AF. On the other hand, disc degeneration of NPs decreased the shear modulus and the phase angle.
Conclusion
Our studies indicate that qMRI can be used as a non-invasive diagnostic tool in the detection of IVDs properties with potential to help interpret and to detect early, middle and late stages of degeneration. QMRI of the human IVD can therefore become a very important diagnostic assessment tool in determining the functional state of the disc.
Keywords: Quantitative MRI, intervertebral disc degeneration, biomechanics, permeability, shear modulus
INTRODUCTION
Despite a relentless search for adequate and effective treatment, low back pain is one of the most prevalent (1) and costly illnesses in today’s society (2). Moreover, due to the lack of quantitative approaches in determining disc integrity, most of the diagnosis refers to idiopathic etiology of the clinical condition. It has long been recognized that the integrity of the intervertebral disc (IVD), part of a three-joint complex that comprises the motion segment of the spine, is an essential component of normal spine function. Alterations in the IVD’s architecture, biochemistry and biomechanics can cause back pain and referred pain with or without neurological impairment (3, 4). While disc degeneration has been implicated as a major etiologic component of low back pain (5), few studies have been directed towards developing an objective, accurate, non-invasive diagnostic tool to detect and quantify structural and biochemical matrix changes in early disc degeneration. Such diagnostics are increasingly important with the development of novel and minimally invasive therapy (6).
IVDs are composed of four components: the outer annulus fibrosus (AF) is a fibrocartilage composed predominantly of type I collagen organized with the fibroblast-like cells in dense concentric lamellae; the inner AF and the transition zone are composed of increasing amounts of type II collagen and chondrocyte-like cells; and the central nucleus pulposus (NP) is a gelatinous substance rich in proteoglycans in a randomly oriented type II collagen matrix with chondrocyte-like cells (7). The IVD is separated from the adjacent vertebral bodies by cartilaginous endplates. Normal adult discs are characterized by their abundant extracellular matrix and low cell density, coupled with an absence of blood vessels, lymphatics, nerves, and mechanoreceptors in all but the most peripheral AF layers (7). In many respects, this absence leaves the disc prone to degeneration because the cells have a large matrix to maintain with no source of repair through vasculature and decreased nutrient supply early in life (8). Additionally, the lack of nerves in the IVD renders early stages of degeneration largely asymptomatic.
The IVD allows 6 degrees of freedom motion between adjacent vertebrae while carrying large loads on the trunk and dissipating energy (4). IVD mechanical behavior is highly non-linear (4,9,10) and is dependent on loading history and hydration (11). The IVD may be considered as a biphasic tissue with a porous and permeable, fiber-reinforced solid phase and a fluid phase of water mixed with ions (4). As the composition and structure varies with region, so do the mechanical properties. Proteoglycans of the solid phase provide much of the compressive stiffness through electrostatic repulsion of the abundant glycosaminoglycan (GAG) negative charges, whereas collagen helps to immobilize proteoglycans within the tissue and provides tensile and shear properties. Fluid flow through the solid matrix is governed by the tissue porosity and permeability. The dramatic changes in morphology, composition and structure that occur in the IVD with aging and degeneration have been simulated by enzymatic digestions, and are accompanied by specific changes in the disc material properties (12–15), including alteration of the compressive modulus, hydraulic permeability, and tensile properties of the AF, and alteration of the elastic modulus, shear modulus, and swelling pressure of the NP.
Quantitative magnetic resonance imaging (qMRI) analysis is an important technique with the potential to objectively and non-invasively assess the disc matrix composition, integrity and biomechanics. QMRI uses the relaxation times T1 and T2, the magnetic transfer ratio MTR, and the diffusion coefficient ADC to correlate MRI signal to disc tissue degeneration. Our group has identified correlations and multiple linear regressions between qMRI parameters, biochemical and mechanical parameters of targeted enzyme matrix denaturation and buffer-treated bovine IVDs (14). We have shown that qMRI parameters (T1, T2, T1rho, MTR, and ADC) are influenced by both IVD matrix composition (water, proteoglycan, and collagen) and matrix integrity (percent collagen denaturation) (14). Targeted enzyme matrix denaturation allowed us to determine the effect of altered matrix integrity on qMRI while maintaining the matrix content constant (15). Our work has also led us to demonstrate that qMRI is highly influenced by the application of a mechanical load upon IVDs (14). We have recently shown that qMRI can be used to describe regional alterations in material properties, specifically the hydraulic permeability and compressive modulus, of the discs (12, 14). The purpose of the present study was to examine changes in human IVD qMRI parameters and mechanical properties in relation to increasing grades of degeneration. The overall goal is to establish a noninvasive technique with the ability to predict relevant and specific compositional and functional changes in the IVD with degeneration.
Materials and methods
Experimental Groups
Ten whole lumbar spine specimens with 5 discs per spine (discs L1-L2 through L5-S1), were obtained through organ donations via Héma-Québec within 24 hours after death ranging in age from 32 to 77 years following approval from our Institutional Review Board (IRB). The 5-disc spines were vacuum sealed in plastic bags for qMRI assessment.
Quantitative MRI Analysis
The MRI examinations were carried out in a 1.5T whole-body Siemens’ Avanto system using the standard circularly polarized head coil. The samples were placed in a sagittal orientation and T1, T2, MTR, and ADC were measured for NP and AF as described previously (16) with the phase-encoding in an anteroposterior direction to account for the effect of the collagen fibril orientation on MRI determinations (17).
T1, T2, and MT images were obtained with a field-of-view (FOV) of 200 ×100 mm, a slice thickness of 3 mm and an acquisition image of 256 × 256 pixels. Briefly, T1 and T2 were determined using the standard Siemens quantification packages based on multiple inversion recovery images for T1 (repetition time (TR)/echo time (TE) = 2100/11 msec, 16 inversion time (TI) from 25 to 1900 msec) and multiple echo trains for T2 (TR = 2000ms, 16 TE every 15 msec). MTR data were obtained using a gradient echo sequence (TR/TE = 300/10 msec) with dual acquisition (pulse off/pulse on at 1.5 kHz away from the central water frequency) using the standard Siemens’ MT pulse. Diffusion images were determined along the anterior/posterior axis using a segmented stimulated echo sequence (acquisition matrix of 128 ×128 pixel, TE/TR = 70/2000 msec and four b-value coefficients of 0, 200, 400, and 600 s/mm2). The ADC values were determined in all three orthogonal directions, with the slice select ADC in the lateral axis (ADCx), the phase encode ADC in the posteroanterior axis (ADCy), and the readout ADC in cranio-caudal axis (ADCz).
Numerical analysis of qMRI was performed using a custom code written in MATLAB (Mathworks, Natick, MA) allowing the selection of the regions of interest and the calculation of average signal intensities from all images. Two regions of interest (ROI) were manually traced as polygonal shapes to represent both NP and AF regions omitting endplate tissue. These ROIs were reproduced identically on all qMRI images from the 50 specimens (Fig.1) All qMRI parameters (T1, T2, MTR, and ADCs) were calculated as described before (14, 16). The inter assay coefficient of variability of the MRI techniques determined from the standard solutions of 0.1 mM and 0.2 mM MnCl2 was 4.59% for T1, 1.76% for T2, 0.19% for MTR, and 5.64% for diffusion, while the intra assay coefficient of variability determined from all standard solutions was 6.61% for T1, 7.06% for T2, 6.94% for MTR, and 3.35% for diffusion. After MRI scanning all discs (n=50) were graded from T2-weighted images according to the classification system described by Pfirrmann (18). Because of the great variability and limited accessibility to the human IVDs our study group consisted of 11 IVDs grade 2, 24 IVDs grade 3, 9 IVDs grade 4 and 6 IVDs grade 5 (Table 1).
Figure 1.
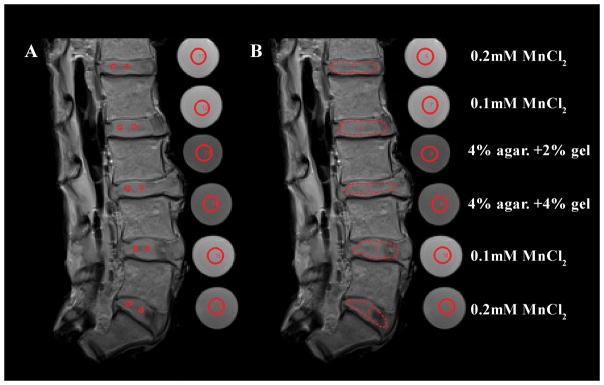
Representative T2 images of the 5-disc human lumbar spines and the four standard solutions used to determine the variability of the MRI technique (0.2 mmol/L MnCl2, 0.1 mmol/L MnCl2, 2% agarose with 2% gelatin, and 4% agarose with 2% gelatin). The regions of interest (ROI) were traced manually as red polygonal shapes with no contact with the endplate tissues and were reproduced identically on all T1, T2, MTR ratio, and diffusion images on all specimens: (A) ROI traced separately for AF and NP; (B) ROI traced for the entire disc.
Table 1.
Experimental groups for qMRI analysis, histological evaluation, mechanical testing and statistical analysis.
| Experimental Group | |||||||||
|---|---|---|---|---|---|---|---|---|---|
| Total number IVDs | Quantitative MRI analysis | Histological evaluation | Mechanical testing | Statistical analysis | |||||
| IVD grade | NP | AF | NP | AF | NP | AF | NP | AF | |
| Grade 2 | 11 | 11 | 11 | 2 | 2 | 11 | 11 | 11 | 11 |
| Grade 3 | 24 | 24 | 24 | 2 | 2 | 24 | 24 | 24 | 24 |
| Grade 4 | 9 | 9 | 9 | 2 | 2 | 9 | 9 | 9 | 9 |
| Grade 5 | 6 | 6 | 6 | - | - | - | - | - | - |
Histological examination of IVDs with different Pfirrmann grades of degeneration
We opted for a multichromatic staining procedure (Alcian blue, Safranin-O and Fast green as a counterstain) developed by Leung et al. which has proven useful in assessing changes in proteoglycan content within disc compartments following degeneration (19). Highly negatively charged glycosaminoglycans (GAGs) are first stained by Alcian blue, subsequent staining with Safranin-O reveals the remaining proteoglycans. Alterations in Alcian blue/ Safranin-O staining correspond with changes in the IVD matrix. Two IVDs of each Pfirrmann grade of degeneration were evaluated. All tissues were fixed in Accustain (Sigma-Aldrich, St Louis, MO), paraffin embedded and sectioned into 4-μm-thick sagittal sections. After dewaxing in xylene and stepwise rehydration in ethanol: 100%, 95%, 70%, 50%, distilled water, the sections were first stained with 1% Alcian blue 8GX (pH 1.0) for 2.5 min and then 0.1% Safranin-O for 3 min, followed by color differentiation in 50% ethanol for 1 min. The sections were finally counterstained in 0.001% fast green for 5 min. A brief rinse in distilled water was applied after each of the above staining steps. Sections were dehydrated and mounted in Permount (Fisher Scientific, USA). Images were captured on an upright light microscope Leica DM LB2 microscope (Leica Microsystems GmbH, Wetzlar, Germany).
Mechanical Testing Procedure
Mechanical tests were performed to evaluate the effects of degeneration on material properties of the human IVD. Specimens were prepared by roughly dissecting a portion of the disc consisting of anterior AF and NP (Fig. 2, red line); the anterior region was used to minimize the influence of existing AF tears which are known to be more prevalent in posterior and posterolateral regions. The tissue was trimmed transversely with a cryostat to a thickness of 1.6±0.45mm. A 5 mm diameter biopsy punch was used to remove two plugs from the AF, though the NP was only large enough to yield a single plug (Fig. 2, green circles). The AF was tested in confined compression and shear, while tested the single NP specimen in shear because of the known sensitivity of NP shear behaviors to degenerative levels (4, 20). Mechanical testing on grade 5 IVDs was not performed due to an insufficient sampling number, as grade 5 NPs were largely absent or indistinguishable from AF (Table 1).
Figure 2.
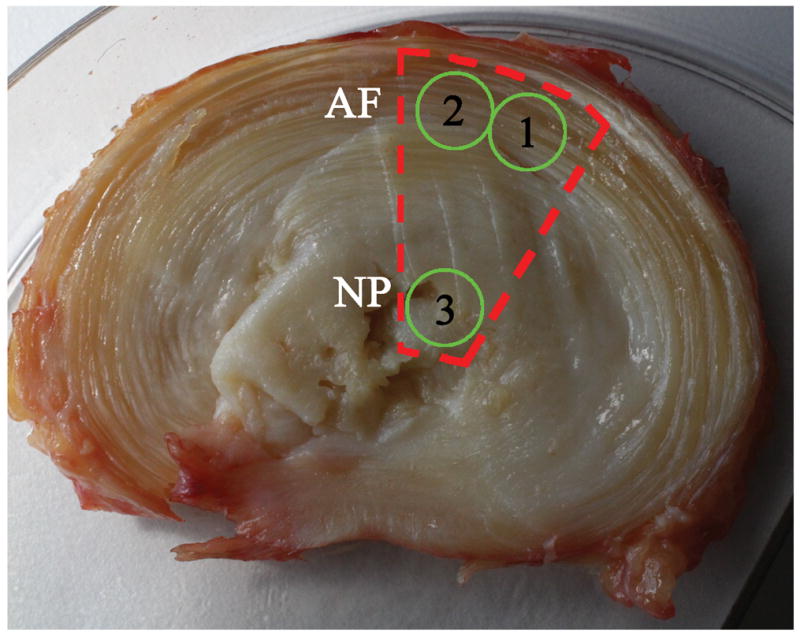
Sample procurement for mechanical testing showing rough dissection (red line) and locations of final specimens (green circles). Specimens were prepared by roughly dissecting (red line) a portion of the disc consisting of anterior AF and NP. A 5 mm diameter biopsy punch was used to remove two plugs from the AF while the NP was only large enough to yield a single plug (green circles).
Confined compression
AF specimens were tested in confined compression using a custom built axial testing machine. The specimen was placed in an impermeable, cylindrical chamber, and a porous upper platen was lowered until contact was established (0.15N). Specimen thickness was calculated from the difference between the point of contact and the bottom of the chamber. The test protocol then consisted of a thirty minute equilibration dwell in phosphate buffered saline at initial height followed by a single ramp to 5% strain at 0.01%/s and a four thousand second dwell. A linear biphasic model was fit to the data from the ramp and final dwell to determine aggregate modulus, HA, and permeability, k (21).
Dynamic shear
Shear dynamic mechanical tests were carried out on AF and NP specimens using a rheometer (AR2000, TA Instruments) equipped with flat platens covered with 100 grit sand paper and a humidified chamber, with a protocol adapted from Bron et al. (22). Specimens were compressed between the platens with 0.1N axial force in order to ensure full contact and allowed to equilibrate for 20 minutes. A dynamic frequency sweep was performed at 10% shear strain and logarithmically spaced frequencies from 0.03 to 30Hz. Dynamic modulus magnitude, |G*|, and phase angle, δ, with inertial compensation for the mass of the upper platen, were calculated by the TA software at each point of the sweep. Shear mechanical properties for AF and NP specimens closely followed power law relationships and were characterized by fitting the relationships [1] using a least squares routine in MATLAB (23).
| [1] |
Frequency sweep results are presented as the magnitude of the dynamic modulus at 1Hz (|G*|1Hz) and its exponential dependence on frequency (α|G*|). Phase angle was likewise characterized by its value at 1 Hz (δ1Hz) and its power law exponent (αδ).
Statistical analysis
All statistical analyses were performed using Graphpad Prism software (GraphPad Software, La Jolla, CA, USA). Our study group included 11 NPs and AFs grade 2, 24 NPs and AFs grade 3 and 9 NPs and AFs grade 4 (Table 1). All MRI and mechanical values were recorded in a spreadsheet program according to grade of degeneration, and disc region. The significance of degeneration on qMRI and biomechanical parameters were determined with one-way analysis of variance. All significant results (p < 0.05) were further analyzed by grades of degeneration using Tukey’s multiple comparisons test. Correlations coefficients between qMRI and mechanical parameters in the same region of the disc were calculated using Pearson tests. Multiple linear regressions were performed between dependent mechanical properties and independent qMRI parameters. The relative importance (> 10%) of each independent variable on the dependent variables was evaluated using standardized b coefficients and the corresponding p-values.
Results
Histological assessment of IVDs with different grades of degeneration
The histological evaluation confirms the gradual alteration of the NP and AF matrix with the progression of Pfirrmann grades of degeneration (Fig. 3). At the early stages of degeneration (Pfirrmann grade 2), the IVD matrix is uniformly positive for Alcian blue (Fig. 3A and C) and a clear separation between NP and the inner annulus fibrosus (IAF) regions can be observed (Fig. 3B). With increasing degeneration, this boundary between NP and AF deteriorates progressively until it disappears (Fig. 3F and J). At Pfirrmann grade 3, the NP matrix is more fibrous similar to the IAF (Fig. 3E and 3I) while the Alcian blue reactivity is significantly reduced in the AF (Fig. 3G). At Pfirrmann grade 4, the AF matrix becomes predominantly positive for Safranin-O with slight Alcian blue reactivity (Fig. 3K), suggesting the degeneration is associated with an alteration in proteoglycan content. A decrease in cellularity with an apparent reduction of Alcian blue reactivity in pericellular regions of the remnant cells (Fig. 3H and L), indicating a decline in IVD cell metabolism is observed.
Figure 3.

Histological assessment of human IVDs with different Pfirrmann grades of degeneration. Disc degeneration grading was assessed using MRI sagittal T2-weighted images according to the Pfirrmann scale and histological evaluation was performed using Alcian blue, Safranin-O and fast green staining: (A–D) histological evaluation of IVDs Pfirrmann grade 2, (E–H) histological evaluation of IVDs Pfirrmann grade 3 and (I–L) histological evaluation of IVDs Pfirrmann grade 4; (A, E, I) nucleus pulposus region (objective, 10×); (B, F, J) transition region between nucleus pulposus and annulus fibrosus (objective, 10×); (C, G, K) annulus fibrosus region (objective, 10×) and (D, H, L) higher magnification of the annulus fibrosus region (objective, 20×). Outlined areas on MRI figures indicate IVD degeneration grade 2, 3 and 4 according to the Pfirrmann grading scale. AF = annulus fibrosus, IAF = inner annulus fibrosus (transition region), NP = nucleus pulposus.
Changes in qMRI parameters
T1 and T2 relaxation times are useful imaging techniques for observing morphological changes of the IVD (6, 24). Both relaxation times decreased in both NP and AF tissues with degeneration (Fig. 4, Table 2). However, T1 changes were significant just between grade 2 and 4 in both NP (p =0.0222) and AF (p =0.0312) while the T2 decreased significantly for all groups (p < 0.01, Fig. 4b, Table 2).
Figure 4.

Effect of IVD degeneration (classification system described by Pfirrmann) on the qMRI parameters (a) T1 and (b) T2 relaxation times (ms) of the NP and AF tissues. The results are presented as mean ± standard error of the mean. Significant differences between experimental groups are indicated by * p < 0.05, § p < 0.01 or # p < 0.001. In both tissues NP and AF, T1 of grade 2 is *significantly different (p < 0.05) from grade 4, while T2 of grade 2 is § significantly different (p < 0.01) from grade 3 and # significantly different (p < 0.001) from grade 4.
Table 2.
Variation of the qMRI parameters and changes in mechanical properties of human IVDs with degeneration
| Variables | Annulus Fibrosus | Nucleus Pulposus | ||||
|---|---|---|---|---|---|---|
| G2 vs. G3 | G3 vs. G4 | G2 vs. G4 | G2 vs. G3 | G3 vs. G4 | G2 vs. G4 | |
| T1 | 21.4% ± 2.00% | 9.5% ± 1.20% |
32.9% ± 3.39% p = 0.0312 |
20.9% ± 0.11% | 12.2% ± 0.22% |
35.7% ± 0.09% p = 0.0222 |
| T2 |
60.9% ± 3.92% p = 0.0062 |
10.0% ± 0.51% |
77.0% ± 4.82% p = 0.0001 |
57.3% ± 2.11% p = 0.0097 |
19.2% ± 0.52% | 87.4% ± 3.03% p = 0.0002 |
| MTR | −2.0% ± 0.14% | −18.0% ± 1.44% p = 0.0011 |
−19.7% ± 1.55% | 3.2% ± 7.22% | −17.4% ± 1.75% p = 0.0006 |
−14.7% ± 4.21% |
| ADC | 3.6% ± 2.16% | 2.0% ± 3.97% | 5.7% ± 1.76% | 13.4% ± 2.59% | 6.0% ± 1.09% |
20.2% ± 1.66% p = 0.0485 |
| HA | 41.5% ± 6.06% | 7.5% ± 9.48% | 52.1% ± 2.97% | |||
| k | 56.0% ± 8.29% | 120.2% ± 11.10% | 243.6% ± 7.17% | |||
| |G*|1Hz | 23.9% ± 5.02% | 16.2% ± 5.26% | 43.9% ± 11.09% | −41.1% ± 6.37% | −18.2% ± 27.05% | −51.8% ± 32.26% |
| δ1Hz | −4.6% ± 0.49% | −29.1% ± 0.67% p = 0.0296 |
−32.4% ± 0.33% p = 0.0427 |
−3.5% ± 3.96% | −18.9% ± 8.64% | −21.8% ± 11.86% |
| α|G*| |
56.7% ± 1.36% p = 0.0212 |
82.6% ± 4.09% | 186.0% ± 1.61% | 2.4% ± 2.17% | 3.9% ± 14.81% | 6.4% ± 12.55% |
| αδ | −32.2% ± 9.51% | −2.6% ± 74.56% | −34.0% ± 65.29% | 33.4% ± 5.51% | 48.0% ± 2.38% | 97.5% ± 10.53% |
The positive values (%) indicate a decrease of the parameter with degeneration while the negative values (%) indicate the increase of the parameter with degeneration. Only the significant p-values (p < 0.05) are specified; (G2 – grade 2 of degeneration, G3 - grade 3 of degeneration and G4 - grade 4 of degeneration).
Collagen fibrils allow the IVD to entrap proteoglycan aggregates and provide tensile strength to the tissue. MTR it is predominantly dependent upon collagen concentration while diffusion imaging (ADC) can detect molecular mobility and therefore the microscopic changes in tissue organization (25, 26). The MTR did not change significantly between grade 2 and 3 in the NP and AF (Fig. 5a). However, there was a marked increase in the MTR with grade 4 (p = 0.0006 for NP and p = 0.0011 for AF). Contrary to the MTR, the diffusion (Fig. 5b) had a tendency to decrease with degeneration. This decrease was statistically significant in grade 4 NPs (p =0.0485; Fig. 5b), while in the AF the decrease was less evident and significant.
Figure 5.

Effect of IVD degeneration (classification system described by Pfirrmann) on the qMRI parameters (a) magnetization ratio (MTR) and (b) apparent diffusion coefficient (ADC) of the NP and AF tissues. The results are presented as mean ± standard error of the mean. Significant differences between experimental groups are indicated by * p < 0.05, § p < 0.01 or # p < 0.001. In NP tissue the MTR of grade 3 is #significantly different (p < 0.001) from grade 4, while in AF tissue the MTR of grade 3 is § significantly different (p < 0.01) from grade 4. MTR did not change significantly between grade 2 and 3 in the both tissues. The ADC of grade 2 for NP tissue is *significantly different (p < 0.05) from grade 4. In AF, ADC changes were less evident.
Changes in mechanical properties
Aggregate modulus (HA) and permeability (k), as measured in the axial direction, give an indication of how much compressive load is being borne by the AF and how readily water may transport through the AF. IVD degeneration caused a non-significant decrease in both of these parameters from grades 2 to grade 4 (Fig. 6). Shear modulus magnitude (|G*|1Hz), which gives a measure of fiber integrity, decreased in the AF and increased in the NP (Fig. 7a). Phase angle (δ), which describes a relative measure of viscous versus elastic behavior increased significantly with degeneration in the AF, and to a lesser extent with more variability in the NP (Fig. 7b). The power law exponents (α|G*| and αδ) describe the nonlinear frequency sensitivity of both elastic and viscous behaviors (Fig. 8). The nonlinear frequency sensitivity of shear modulus, which is dependent on collagen fiber recruitment, decreased significantly with degeneration in the AF but was not altered in the NP. Phase angle remained similarly sensitive to shearing frequency in the AF but exhibited a decrease in decreasing trend in αδ in the NP with degenerative grade.
Figure 6.

Effect of IVD degeneration (classification system described by Pfirrmann) on the compressive modulus (HA) and hydraulic permeability (k) of the AF tissue. The results are presented as mean ± standard deviation. No significant differences were observed between experimental groups.
Figure 7.
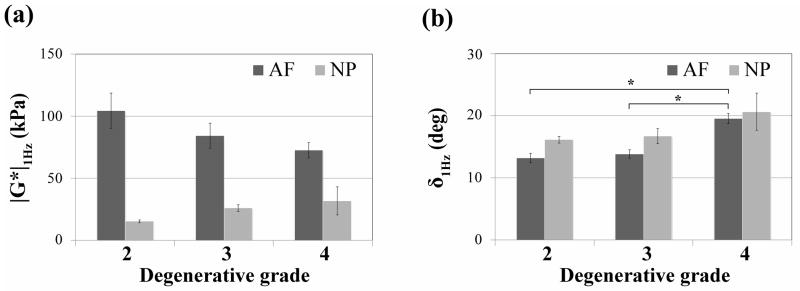
Effect of IVD degeneration (classification system described by Pfirrmann) on (a) shear modulus (|G*|) and (b) phase angle (δ) of the AF and NP tissues. The results are presented as mean ± standard deviation. Significant differences (* p < 0.05) were observed for phase angle (δ 1Hz) between grades 2 and 4 and grades 3 and 4 in AF tissues.
Figure 8.
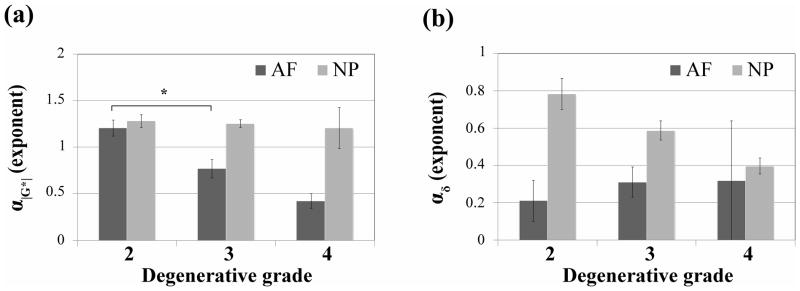
Effect of IVD degeneration (classification system described by Pfirrmann) on power law exponents of (a) shear modulus (α|G*|) and (b) phase angle (αδ) of the AF and NP tissues. The results are presented as mean ± standard deviation. Significant differences (* p < 0.05) were observed for α|G*| between grade 2 and 3 in AF tissues.
Correlations between qMRI parameters and the mechanical properties
The plots of the most significant correlations between qMRI and mechanical properties are shown in Fig. 9. When the tissues were analyzed separately, for the NP tissue significant correlations were found between T2 and shear modulus |G*|1Hz (r square = 21.66%, p = 0.022), and between diffusion ADC and αδ (r square = 12.68%, p = 0.048). For the AF tissue significant correlation were found between T1 and αδ (r square = 13.81%, p = 0.047) and between T1 and permeability, k (r square = 12.77%, p = 0.043). Furthermore, the analysis for the entire disc showed significant correlations between T1 and α|G*|, T1 and αδ, T1 and k and T2 and hydraulic modulus HA. Nocorrelations were found between MTR and any mechanical parameters for both AF and NP tissues.
Figure 9.

Correlations plots between qMRI and mechanical parameters of AF and NP tissues. For the AF tissue significant correlation were found between T1 and αδ (r2 = 13.81%, p = 0.047) and between T1 and permeability k (r2 = 12.77%, p =0.043), with the variables related by the regression equations: αδ AF = −0.5092 + 0.001039 * T1 AF and k AF = 1.051 – 0.0009136* T1 AF. For the NP tissue significant correlations were found between T2 and shear modulus |G*| (r2 = 21.66%, p = 0.022), and between diffusion ADC and αδ (r2 = 12.68%, p = 0.048), with the variables related by the regression equations: |G*|1Hz NP = 46859 − 193.54 * T2 NP and αδ NP = −0.2486 + 0.7251* ADC NP. No correlations were found between MTR and any mechanical parameters for both AF and NP tissues.
Multiple linear regression analysis
Multiple linear regression analysis between mechanical properties and qMRI parameters was aimed to identify a specific set of qMRI predictor variables which might provide a useful estimate score on each mechanical criterion variable. The possible predictors of each mechanical parameter of IVDs tissues are shown in Table 3.
Table 3.
Predictions between qMRI and mechanical parameters in AF and NP
| Predictor Variables | Criterion variables (mechanical parameters) | |||||||||
|---|---|---|---|---|---|---|---|---|---|---|
|
| ||||||||||
| (qMRI parameters) | Annulus Fibrosus | Nucleus Pulposus | ||||||||
|
| ||||||||||
| T2 | T1 | MTR | ADC | |G*|1Hz AF | δ1Hz AF | HAAF | kAF | |G*|1Hz NP | δ1Hz NP | |
| T2 | r2 | 2.08% | 1.16% | 7.20% | 4.00% | 21.66% | 2.88% | |||
| p | 0.4550 | 0.5789 | 0.1850 | 0.3274 | 0.0219 | 0.4173 | ||||
|
| ||||||||||
| T1 | r2 | 1.24% | 0.95% | 4.26% | 12.77% | 7.31% | 1.18% | |||
| p | 0.5651 | 0.6143 | 0.3117 | 0.0431 | 0.2014 | 0.6046 | ||||
|
| ||||||||||
| MTR | r2 | 0.67% | 3.00% | 0.90% | 2.89% | 0.06% | 2.28% | |||
| p | 0.6733 | 0.3687 | 0.6456 | 0.4064 | 0.9133 | 0.4712 | ||||
|
| ||||||||||
| ADC | r2 | 6.20% | 5.34% | 0.63% | 0.02% | 3.59% | 4.59% | |||
| p | 0.2012 | 0.237 | 0.7071 | 0.9417 | 0.3749 | 0.3036 | ||||
|
| ||||||||||
| T2 | T1 | r2 | 2.08% | 1.21% | 7.22% | 13.60% | 24.43% | 3.20% | ||
| p | 0.7605 | 0.8533 | 0.4223 | 0.1861 | 0.0528 | 0.6992 | ||||
|
| ||||||||||
| T2 | MTR | r2 | 2.25% | 3.35% | 11.07% | 5.19% | 22.80% | 3.78% | ||
| p | 0.7438 | 0.6420 | 0.2594 | 0.5421 | 0.0660 | 0.6547 | ||||
|
| ||||||||||
| T2 | ADC | r2 | 6.73% | 7.76% | 10.44% | 6.55% | 29.00% | 6.39% | ||
| p | 0.4185 | 0.3644 | 0.2973 | 0.4746 | 0.0274 | 0.4834 | ||||
|
| ||||||||||
| T1 | MTR | r2 | 1.33% | 3.02% | 10.92% | 12.94% | 8.29% | 2.42% | ||
| p | 0.8399 | 0.6712 | 0.2646 | 0.2032 | 0.4032 | 0.7641 | ||||
|
| ||||||||||
| T1 | ADC | r2 | 6.61% | 6.23% | 5.51% | 21.04% | 11.68% | 5.41% | ||
| p | 0.4254 | 0.4476 | 0.5363 | 0.0744 | 0.2716 | 0.5423 | ||||
|
| ||||||||||
| MTR | ADC | r2 | 6.21% | 10.55% | 2.83% | 7.09% | 3.60% | 7.42% | ||
| p | 0.4487 | 0.2483 | 0.7290 | 0.4455 | 0.6808 | 0.4283 | ||||
|
| ||||||||||
| T2 | T1 | MTR | r2 | 2.29% | 3.56% | 12.79% | 13.90% | 24.70% | 4.81% | |
| p | 0.8989 | 0.8196 | 0.3800 | 0.3388 | 0.1213 | 0.7871 | ||||
|
| ||||||||||
| T2 | T1 | ADC | r2 | 6.76% | 7.81% | 10.50% | 21.32% | 32.84% | 6.53% | |
| p | 0.6338 | 0.5743 | 0.4967 | 0.1611 | 0.0430 | 0.6935 | ||||
|
| ||||||||||
| T2 | MTR | ADC | r2 | 6.74% | 12.98% | 12.69% | 13.56% | 31.31% | 7.97% | |
| p | 0.6353 | 0.3335 | 0.4050 | 0.3719 | 0.0529 | 0.6183 | ||||
|
| ||||||||||
| T1 | MTR | ADC | r2 | 6.67% | 10.66% | 11.04% | 22.49% | 13.41% | 7.42% | |
| p | 0.6390 | 0.4300 | 0.4730 | 0.1403 | 0.3995 | 0.6466 | ||||
|
| ||||||||||
| T2 | T1 | MTR | ADC | r2 | 6.78% | 14.40% | 13.66% | 22.52% | 33.67% | 8.81% |
| p | 0.7937 | 0.4443 | 0.5447 | 0.2534 | 0.0850 | 0.7479 | ||||
|
| ||||||||||
| predictor MRI variables with best score to predict the mechanical variable | - | ADC & MTR | T2 & MTR | T1, MTR &ADC | T2, T1 &ADC | - | ||||
R square (r2) indicates how good a prediction of the criterion variables (mechanical parameters) can be made by knowing the predictor variables (qMRI parameters); p indicates the statistical significance of the model.
Overall, the regression analysis exhibits weak relationships among qMRI variables and mechanical parameters of AF and NP tissues. The univariate regression analyses indicate that shear modulus of the NP was significantly associated with T2 (r square = 21.66%, p = 0.0219) while T1 was the main predictor of hydraulic permeability (k) of the AF (r square = 12.44%, p = 0.0431). Weak and not significant (r square < 10%, p > 0.05) predictions were detected for the phase angle (δ) of both AF and NP tissues and for the aggregate modulus (HA) and shear modulus of the AF (Table 3). Multiple linear regression analyses displayed ADC and MTR as combined determinants for phase angle (δ) and T2 and MTR as determinants for aggregate modulus (HA) of AF. The best predictor relations were identified for AF where T1, MTR and ADC explain 22.5% of the variance of permeability [2] and for NP where T2, T1 and ADC explain 33% of the variance of share modulus [3]:
| [2] |
| [3] |
DISCUSSION
Human IVD degeneration involves processes accumulated from development, remodeling, injury, and attempted repair. Quantifying and interpreting such complex processes requires several MRI and functional biomechanical parameters. The goal of the present work was to establish relationships between qMRI parameters (T1, T2, MTR, ADC) and biomechanical parameters (aggregate modulus, hydraulic permeability, dynamic shear modulus and phase angle) to help inform and interpret alterations of human discs with different grades of degeneration. In this report we demonstrate that quantitative MRI and functional tissue biomechanical changes are specific and can be explained based on the sensitivity of these measurements to three stages of degenerative changes. First, early stage degeneration involves loss of water, proteoglycans, IVD height and increased tissue compaction. Second, middle stage degeneration involves adaptation with reduced anisotropy and reduced heterogeneity between AF and NP. Lastly, late stage degeneration involves structural disruption including loss of integrity as observed with fissures and other structural defects.
The ultimate goal of this work is to develop a noninvasive technique to describe and predict compositional and functional changes in the IVD that may be associated with painful conditions. We identified sensitivity of qMRI parameters to functional and compositional changes of the IVD found with degeneration. This sensitivity can immediately be used to help interpret MRI analyses and may eventually identify with greater specificity the structural or compositional changes that may be associated with painful conditions in the spine.
T1 has been predominantly correlated to water content, while T2 is influenced by tissue anisotropy (orientation of collagen fibers), collagen concentration, and water content in tissues (27). T2 has also been correlated with proteoglycan content in tissues, an important feature of disc degeneration, but reports vary between studies (28, 29). The similarities found between qMRI parameters for AF and NP suggest that they are affected uniformly across the disc with degeneration, and may represent early and middle stages of degeneration with loss of water and reduced anisotropy, respectively.
Magnetization transfer (MT) imaging is a phenomenon in which the proton spins of free- and macromolecule-bound water exchange their magnetization via cross-relaxation and chemical exchange processes (30). One of the main applications of MT is the computation of the MTR, which is predominantly dependent upon collagen concentration in the tissue, but the structural integrity of the matrix also plays a role (21). In this study we show that MT increases with degeneration in the disc, and the greater increase in MTR with advancing degeneration to grade 4 is likely associated with greater increase in structural disruptions found with later stages of degeneration.
MRI can measure molecular diffusion resulting from random thermal or so-called Brownian, translational motion of molecules (16, 31). Since freedom of motion is restricted by interactions with other molecules, diffusion imaging can reflect molecular mobility and hence, microscopic changes in tissue organization (25, 26). Diffusion, measured as the ADC, is independent of the magnetic field strength, and MRI is the only in vivo technique presently capable of measuring diffusion directly from molecular displacements. It has been shown that the ADC decreases in degenerated discs (25, 26). Moreover, the ADCs correlate in a direction-dependent manner with disc water, proteoglycan content, and disc matrix integrity (25, 26). ADC is the only qMRI parameter with degenerative changes that were not uniform between AF and NP, and can be explained by the well known and large loss of GAG in the NP and subsequent water retention capacity found in early and middle stages of degeneration (24).
A shear stress is defined as a stress which is applied parallel or tangential to a face of a material, as opposed to a normal stress which is applied perpendicularly. It is believed that annular tears (circumferential and radial tears) which are present by early adulthood and are associated with long-term development of disc degeneration, may originate in response to variations in regional intra-discal shear strains (32). The trends of decreased shear modulus of AF with advancing degeneration are consistent with diminished collagen organization that develops due to remodeling changes in middle stages of degeneration and development of structural defects in late stages. The increase in shear modulus in the NP is also suggestive of collagen remodeling with increased fiber content in the degenerated NP, and consistent with previous studies (20). It is interesting to note that the reduced heterogeneity that develops in the inter-related AF and NP behaviors were detectable biomechanically and with qMRI. Specifically, in the grade 2 state, the shear modulus of AF tissue was nearly 7 times greater than that of the NP, however, only 2 times greater in grade 4 IVDs suggesting that in middle stages of degeneration remodeling occurs so that the NP bears a larger portion of shear loading in the IVD. The strong biomechanical findings representing diminished water content and anisotropy are highly consistent with the reduced T1 and T2, respectively, and are changes representative of early and middle stages of degeneration. Hence, disc degeneration affects the structural integrity of the disc, as measured biomechanically, which in turn, correlates to qMRI parameters.
Structural disruption in later stages of degeneration was also detectable biomechanically. The trend of increased phase angle was largest in both NP and AF regions for grade 4 samples and may reflect microstructural defects present in later stage degeneration. For example, there trend of an increased phase angle found in the NP with degeneration in this study contrasts the significant decrease in phase angle of NP previously reported from Thompson grade I to more advanced levels of degeneration (20). We infer that a reduced phase angle which was reported to occur in early stages of degeneration is associated with loss of water content while the increased phase angle at grade 4 in this study is more associated with structural disruption at late stages of degeneration.
When considering the different stages of degeneration in the samples tested in this and prior studies, we may explain apparent differences in mechanical results (Table 4). There was a non significant decrease in HA with degeneration grade in this study which could be associated with remodeling or structural disruption found in middle or later stages of degeneration. This contrasts a previous study indicating HA of the AF increased significantly from early degenerative changes from healthy (i.e., grades 1–2) to degenerated (i.e., grades 3–5) states which is associated with loss of water content and tissue compaction (41) in early degeneration. The trend of decreased permeability found in this study contrasts a prior study using similar methods (41), and is similarly explained when accounting for structural disruption in advanced degeneration. Together, these biomechanical results suggest functional alterations occurring distinctly in AF and NP regions, as well as distinct patterns of tissue degradation that are likely to occur at early, middle, and late stages of degeneration.
Table 4.
Summary of the studies on human intervertebral discs correlating MRI and material properties
| Study | Specimens | Age | Grading Scale | Degeneration Grades | MRI | Biomechanics | Regressions/ Correlations | Results | ||||||
|---|---|---|---|---|---|---|---|---|---|---|---|---|---|---|
| I | II | III | IV | V | Scanner | Sequences | ||||||||
| LM Benneker et al. (33) Eur Spine J 2005 |
39 IVDs (L1-S1) 8 spines |
54 yrs (range 19–86 ) | Thompson Pfirrmann |
IVD | 3 | 8 | 14 | 9 | 5 | 1.5T | T1, T2 | X-Ray combined with MRI, correlates with morphometrical assessment of degen. | ||
| EC Krueger et al. (34) Am J Neuroradiol 2007 |
4 asym | 3 yrs ( <10) | Pfirrmann | IVD | 20 | - | - | - | - | N/A | T2 | T2 increases between first and second decades of life | ||
| 5 asym | 20 yrs (range 19–20) | - | 24 | - | - | - | ||||||||
| G Blumenkrantz et al. (35) Magn Reson Med 2010 |
80 IVDs(L1-S1) 16 sym, 6 asym |
40.2 ± 12.4 (range 25–60) | Pfirrmann | IVD | 12 | 39 | 22 | 3 | 1 | 3T | 77 IVDs: T1ρ | Spearman: T1ρ vs. T2; T1ρ, T2 vs. degen; T1ρ, T2, degen vs. age | T1ρ vs. T2, moderate correlated degen, age vs. T1ρ: inverse strong correlated; degen vs. T2: inverse moderate correlated; | |
| - | 28 | 12 | 3 | 1 | 44 IVDs: T2 | |||||||||
| B B Zobel et al. (36) Spine 2010 |
315 IVDs (L1-S1) 63 sym |
22.95 ± 1.8 (range: 19–25) | Pfirrmann | IVD | 158 | 108 | 37 | 11 | 1 | 1.5T | T1, T2, T1ρ | Spearman: T1ρ, BMI, degen | T1ρ vs. degen: moderate inverse correlated; T1ρ vs. BMI: no correlation | |
| G. Niu et al. (37) Am J Neuroradiol 2011 |
325 IVDs 37 asym, 28 sym |
44 (range 20–74) | Pfirrmann | IVD | 43 | 136 | 89 | 49 | 8 | 1.5T | ADC, T2 | Pearson: T2, ADC vs. age | T2 vs. age: inverse strong correlated; ADC vs. age: inverse weak correlated | |
| GH Welsch et al. (38) Skeletal Radiol 2011 |
150 IVDs 30 sym |
38.1±9.1 yrs (range 21–51) | Pfirrmann | IVD | 4 | 96 | 37 | 13 | - | 3T | T1, T2, T2* | Pearson: T2 vs. T2*; T2 vs. age, degen. | T2 vs. T2*: weak correlated; degen vs. age: no correlation; T2 vs. degen: medium inverse correlated; T2*vs. degen: low inverse correlated | |
| H Takashima et al. (39) Skeletal Radiol. 2012 |
300 IVDs 60 sym |
53.3 (range 23–83) | Pfirrmann | IVD | 42 | 61 | 67 | 77 | 53 | 1.5T | T2 | T2 decreased with increasing degen | ||
| S Ebara et al. (40) Spine 1996 |
15 IVDs (L3-L4) 15 spines |
- (range: 26–53) | Thompson | AF | normal | degenerate | E, SED, ε | age nondegen. vs. material parameters | Tensile prop. vs. age: weak correlated | |||||
| 15 | - | - | - | |||||||||||
| JC Iatridis et al. (41) J Biomech 1998 |
22 IVDs (L2-L3) 22 spines |
38.5 (range 12–83) | Thompson | AF | normal | degenerate | σoffset, HA, β, k, M | degen vs. age age,; degen. vs. all material properties | σoffset, HA vs. age: weak correlated; σoffset, HA, β vs. degen: weak correlated; degen vs. stiffness: significant effects, degen vs. permeability: no effect | |||||
| 13 | 1 | 4 | 3 | 1 | ||||||||||
| W Johannessen et al. (42) Spine 2005 |
19 IVDs 10 spines |
57.5 yrs (range 19–80) | Thompson modified | NP | < 2.5 | > 2.5 | Psw, HA, ka | age, degen vs. mechanical behavior | Psw vs. age: strong inverse correlated; Psw vs. degen: moderate inverse correlated; HA vs. age: moderate inverse correlated; HA vs. degen: weak inverse correlated | |||||
| 8 | 11 | |||||||||||||
| AM Nguyen et al. (43) J Bone Joint Surg 2008 |
33 IVDs (L1-S1) 8 spines |
51.8 (range 15–79) | Pfirrmann | NP | < 2.5 | > 2.5 | 1.5T | 33 IVDs: T2, T1ρ | 26 IVDs: Psw, HA, ka | degen, age, T1ρ, mechanical characteristics | T1ρ vs. degen, age: strong inverse correlated; T1ρ vs. Psw: moderate correlated; T1ρ vs. compression modulus, ka: not correlated | |||
| 15 | 18 | |||||||||||||
| Our study |
50 IVDs (L1-S1) 10 spines |
- (range 32–77) | Pfirrmann | IVD | - | 11 | 24 | 9 | - | 1.5T | 50 IVDs: T1, T2, MTR, ADC | 44 IVDs: HA, k, G*, δ | Pearson: MRI vs. mechanical parameters | Weak correlations between different MRI and mechanical parameters |
Sym = symptomatic patients suffering from low back pain, Asym = asymptomatic volunteers with no history of chronic back pain, spines = human cadaveric spines, MRI parameters: T2 and T2*= spin-spin or transverse relaxation times, T1ρ = spin-lattice relaxation time in the rotating frame, T1 = spin-lattice or longitudinal relaxation time, ADC = diffusion coefficient, MTR = magnetic transfer ratio,; Mechanical parameters: E = tensile modulus, SED = strain energy density, ε = failure strain, σoffset = stress offset, HA = aggregate modulus, β = stiffening coefficient, k = permeability, M = strain-dependent permeability coefficient, Psw = swelling pressure, ka = apparent permeability, G* = dynamic shear modulus, δ = phase angle. BMI = body mass index. The correlation was considered strong when the r value was >0.7, moderate if it was 0.5 < r ≤ 0.7, and weak if it was r ≤ 0.5.
The effects of degeneration on the biomechanical properties and qMRI parameters indicate sensitivity to distinct changes at varying levels of degeneration. The greater significance of the qMRI parameters than biomechanical parameters are likely associated with differences in ‘sampling’ with larger regions of interest taken for qMRI than for biomechanical testing. Furthermore the qMRI parameters included assessment of posterior regions of the IVD which are known to have greater structural failure (44, 45). This larger sampling area with qMRI was designed to provide average values for each IVD region in order to augment traditional MR imaging which is well known to be sensitive to local structural defects.
In conclusion, this study examined changes in human IVD qMRI and mechanical properties in relation to increasing grades of degeneration. The effect of degeneration on the biomechanical properties and qMRI parameters show that these parameters are related and can together provide a comprehensive picture of the changes that occur in early, middle and late stages of degeneration. Therefore, we can conclude that qMRI can be used as a non-invasive diagnostic tool in the detection and quantification of composition, structure and biomechanical alterations to the human IVD and can therefore become a very important diagnostic and treatment assessment tool in determining the functional state of the disc.
Acknowledgments
Grant Support: Funding for this work was provided by the Canadian Institutes of Health Research, the McGill William Dawson Scholar Award, the Whitaker Foundation, and the AO Foundation (Switzerland, Funding #F-06-31A), and NIH Grant (R01 AR051146 & R01 AR057397).
References
- 1.Biering-Sorensen F. Low back trouble in a general population of 30-, 40-, 50-, and 60-year-old men and women. Study design, representativeness and basic results. Dan Med Bull. 1982;29:289–299. [PubMed] [Google Scholar]
- 2.Katz JN. Lumbar disc disorders and low-back pain: socioeconomic factors and consequences. J Bone Joint Surg Am. 2006;88 (Suppl 2):21–24. doi: 10.2106/JBJS.E.01273. [DOI] [PubMed] [Google Scholar]
- 3.Brisby H. Pathology and possible mechanisms of nervous system response to disc degeneration. J Bone Joint Surg Am. 2006;88(Suppl 2):68–71. doi: 10.2106/JBJS.E.01282. [DOI] [PubMed] [Google Scholar]
- 4.Stokes IAF, Iatridis JC. Mechanical conditions that accelerate intervertebral disc degeneration: overload versus immobilization. Spine. 2004;29:2724–2732. doi: 10.1097/01.brs.0000146049.52152.da. [DOI] [PMC free article] [PubMed] [Google Scholar]
- 5.Luoma K, Riihimaki H, Luukkonen R, Raininko R, Viikari-Juntura E, Lamminen A. Low back pain in relation to lumbar disc degeneration. Spine. 2000;25:487–492. doi: 10.1097/00007632-200002150-00016. [DOI] [PubMed] [Google Scholar]
- 6.Mwale F, Roughley P, Antoniou J. Distinction between the extracellular matrix of the nucleus pulposus and hyaline cartilage: a requisite for tissue engineering of intervertebral disc. European cells & materials. 2004;8:58–63. doi: 10.22203/ecm.v008a06. [DOI] [PubMed] [Google Scholar]
- 7.Oegema TR., Jr Biochemistry of the intervertebral disc. Clin Sports Med. 1993;12:419–439. [PubMed] [Google Scholar]
- 8.Urban JP, Smith S, Fairbank JC. Nutrition of the intervertebral disc. Spine. 2004;29:2700–2709. doi: 10.1097/01.brs.0000146499.97948.52. [DOI] [PubMed] [Google Scholar]
- 9.Nerurkar NL, Elliott DM, Mauck RL. Mechanical design criteria for intervertebral disc tissue engineering. J Biomech. 2012;43:1017–1030. doi: 10.1016/j.jbiomech.2009.12.001. [DOI] [PMC free article] [PubMed] [Google Scholar]
- 10.Panjabi MM, Oxland TR, Yamamoto I, Crisco JJ. Mechanical behavior of the human lumbar and lumbosacral spine as shown by three-dimensional load-displacement curves. J Bone Joint Surg Am. 1994;76:413–424. doi: 10.2106/00004623-199403000-00012. [DOI] [PubMed] [Google Scholar]
- 11.Race A, Broom ND, Robertson P. Effect of loading rate and hydration on the mechanical properties of the disc. Spine. 2000;25:662–669. doi: 10.1097/00007632-200003150-00003. [DOI] [PubMed] [Google Scholar]
- 12.Perie D, Iatridis JC, Demers CN, et al. Assessment of compressive modulus, hydraulic permeability and matrix content of trypsin-treated nucleus pulposus using quantitative MRI. J Biomech. 2006;39:1392–1400. doi: 10.1016/j.jbiomech.2005.04.015. [DOI] [PubMed] [Google Scholar]
- 13.Mwale F, Iatridis JC, Antoniou J. Quantitative MRI as a diagnostic tool of intervertebral disc matrix composition and integrity. Eur Spine J. 2008;17 (Suppl 4):432–440. doi: 10.1007/s00586-008-0744-4. [DOI] [PMC free article] [PubMed] [Google Scholar]
- 14.Mwale F, Demers CN, Michalek AJ, et al. Evaluation of quantitative magnetic resonance imaging, biochemical and mechanical properties of trypsin-treated intervertebral discs under physiological compression loading. J Magn Reson Imaging. 2008;27:563–573. doi: 10.1002/jmri.21242. [DOI] [PMC free article] [PubMed] [Google Scholar]
- 15.Antoniou J, Mwale F, Demers CN, et al. Quantitative magnetic resonance imaging of enzymatically induced degradation of the nucleus pulposus of intervertebral discs. Spine. 2006;31:1547–1554. doi: 10.1097/01.brs.0000221995.77177.9d. [DOI] [PubMed] [Google Scholar]
- 16.Antoniou J, Demers CN, Beaudoin G, et al. Apparent diffusion coefficient of intervertebral discs related to matrix composition and integrity. Magn Reson Imaging. 2004;22:963–972. doi: 10.1016/j.mri.2004.02.011. [DOI] [PubMed] [Google Scholar]
- 17.Rubenstein JD, Kim JK, Morova-Protzner I, Stanchev PL, Henkelman RM. Effects of collagen orientation on MR imaging characteristics of bovine articular cartilage. Radiology. 1993;188:219–226. doi: 10.1148/radiology.188.1.8511302. [DOI] [PubMed] [Google Scholar]
- 18.Pfirrmann CW, Metzdorf A, Zanetti M, Hodler J, Boos N. Magnetic resonance classification of lumbar intervertebral disc degeneration. Spine. 2001;26:1873–1878. doi: 10.1097/00007632-200109010-00011. [DOI] [PubMed] [Google Scholar]
- 19.Leung VY, Chan WC, Hung SC, Cheung KM, Chan D. Matrix remodeling during intervertebral disc growth and degeneration detected by multichromatic FAST staining. J Histochem Cytochem. 2009;57:249–256. doi: 10.1369/jhc.2008.952184. [DOI] [PMC free article] [PubMed] [Google Scholar]
- 20.Iatridis JC, Setton LA, Weidenbaum M, Mow VC. Alterations in the mechanical behavior of the human lumbar nucleus pulposus with degeneration and aging. J Orthop Res. 1997;15:318–322. doi: 10.1002/jor.1100150224. [DOI] [PubMed] [Google Scholar]
- 21.Perie D, Korda D, Iatridis JC. Confined compression experiments on bovine nucleus pulposus and annulus fibrosus: sensitivity of the experiment in the determination of compressive modulus and hydraulic permeability. J Biomech. 2005;38:2164–2171. doi: 10.1016/j.jbiomech.2004.10.002. [DOI] [PubMed] [Google Scholar]
- 22.Bron JL, Koenderink GH, Everts V, Smit TH. Rheological characterization of the nucleus pulposus and dense collagen scaffolds intended for functional replacement. J Orthop Res. 2009;27:620–626. doi: 10.1002/jor.20789. [DOI] [PubMed] [Google Scholar]
- 23.Schek RM, Michalek AJ, Iatridis JC. Genipin-crosslinked fibrin hydrogels as a potential adhesive to augment intervertebral disc annulus repair. Eur Cell Mater. 2011;21:373–383. doi: 10.22203/ecm.v021a28. [DOI] [PMC free article] [PubMed] [Google Scholar]
- 24.Antoniou J, Steffen T, Nelson F, et al. The human lumbar intervertebral disc: evidence for changes in the biosynthesis and denaturation of the extracellular matrix with growth, maturation, ageing, and degeneration. J Clin Invest. 1996;98:996–1003. doi: 10.1172/JCI118884. [DOI] [PMC free article] [PubMed] [Google Scholar]
- 25.Kerttula LI, Jauhiainen JP, Tervonen O, Suramo IJ, Koivula A, Oikarinen JT. Apparent diffusion coefficient in thoracolumbar intervertebral discs of healthy young volunteers. J Magn Reson Imaging. 2000;12:255–260. doi: 10.1002/1522-2586(200008)12:2<255::aid-jmri7>3.0.co;2-t. [DOI] [PubMed] [Google Scholar]
- 26.Kerttula L, Kurunlahti M, Jauhiainen J, Koivula A, Oikarinen J, Tervonen O. Apparent diffusion coefficients and T2 relaxation time measurements to evaluate disc degeneration. A quantitative MR study of young patients with previous vertebral fracture. Acta Radiol. 2001;42:585–591. doi: 10.1080/028418501127347241. [DOI] [PubMed] [Google Scholar]
- 27.Xia Y. Magic-angle effect in magnetic resonance imaging of articular cartilage: a review. Invest Radiol. 2000;35:602–621. doi: 10.1097/00004424-200010000-00007. [DOI] [PubMed] [Google Scholar]
- 28.Weidenbaum M, Foster RJ, Best BA, et al. Correlating magnetic resonance imaging with the biochemical content of the normal human intervertebral disc. J Orthop Res. 1992;10:552–561. doi: 10.1002/jor.1100100410. [DOI] [PubMed] [Google Scholar]
- 29.Tertti M, Paajanen H, Laato M, Aho H, Komu M, Kormano M. Disc degeneration in magnetic resonance imaging. A comparative biochemical, histologic, and radiologic study in cadaver spines. Spine. 1991;16:629–634. doi: 10.1097/00007632-199106000-00006. [DOI] [PubMed] [Google Scholar]
- 30.Paajanen H, Komu M, Lehto I, Laato M, Haapasalo H. Magnetization transfer imaging of lumbar disc degeneration. Correlation of relaxation parameters with biochemistry. Spine. 1994;19:2833–2837. doi: 10.1097/00007632-199412150-00018. [DOI] [PubMed] [Google Scholar]
- 31.Boos N, Wallin A, Gbedegbegnon T, Aebi M, Boesch C. Quantitative MR imaging of lumbar intervertebral disks and vertebral bodies: influence of diurnal water content variations. Radiology. 1993;188:351–354. doi: 10.1148/radiology.188.2.8327677. [DOI] [PubMed] [Google Scholar]
- 32.Costi JJ, Stokes IA, Gardner-Morse M, Laible JP, Scoffone HM, Iatridis JC. Direct measurement of intervertebral disc maximum shear strain in six degrees of freedom: motions that place disc tissue at risk of injury. J Biomech. 2007;40:2457–2466. doi: 10.1016/j.jbiomech.2006.11.006. [DOI] [PMC free article] [PubMed] [Google Scholar]
- 33.Benneker LM, Heini PF, Anderson SE, Alini M, Ito K. Correlation of radiographic and MRI parameters to morphological and biochemical assessment of intervertebral disc degeneration. Eur Spine J. 2005;14:27–35. doi: 10.1007/s00586-004-0759-4. [DOI] [PMC free article] [PubMed] [Google Scholar]
- 34.Krueger EC, Perry JO, Wu Y, Haughton VM. Changes in T2 relaxation times associated with maturation of the human intervertebral disk. AJNR Am J Neuroradiol. 2007;28:1237–1241. doi: 10.3174/ajnr.A0546. [DOI] [PMC free article] [PubMed] [Google Scholar]
- 35.Blumenkrantz G, Zuo J, Li X, Kornak J, Link TM, Majumdar S. In vivo 3.0-tesla magnetic resonance T1rho and T2 relaxation mapping in subjects with intervertebral disc degeneration and clinical symptoms. Magn Reson Med. 2010;63:1193–200. doi: 10.1002/mrm.22362. [DOI] [PMC free article] [PubMed] [Google Scholar]
- 36.Zobel BB, Vadalà G, Del Vescovo R, Battisti S, Martina FM, Stellato L, Leoncini E, Borthakur A, Denaro V. T1ρ magnetic resonance imaging quantification of early lumbar intervertebral disc degeneration in healthy young adults. Spine. 2012;37:1224–1230. doi: 10.1097/BRS.0b013e31824b2450. [DOI] [PMC free article] [PubMed] [Google Scholar]
- 37.Niu G, Yang J, Wang R, Dang S, Wu EX, Guo Y. MR imaging assessment of lumbar intervertebral disk degeneration and age-related changes: apparent diffusion coefficient versus T2 quantitation. AJNR Am J Neuroradiol. 2011;32:1617–1623. doi: 10.3174/ajnr.A2556. [DOI] [PMC free article] [PubMed] [Google Scholar]
- 38.Welsch GH, Trattnig S, Paternostro-Sluga T, Bohndorf K, Goed S, Stelzeneder D, Mamisch TC. Parametric T2 and T2* mapping techniques to visualize intervertebral disc degeneration in patients with low back pain: initial results on the clinical use of 3.0 Tesla MRI. Skeletal Radiol. 2011;40:543–551. doi: 10.1007/s00256-010-1036-8. [DOI] [PubMed] [Google Scholar]
- 39.Takashima H, Takebayashi T, Yoshimoto M, Terashima Y, Tsuda H, Ida K, Yamashita T. Correlation between T2 relaxation time and intervertebral disk degeneration. Skeletal Radiol. 2012;41:163–167. doi: 10.1007/s00256-011-1144-0. [DOI] [PubMed] [Google Scholar]
- 40.Ebara S, Iatridis JC, Setton LA, Foster RJ, Mow VC, Weidenbaum M. Tensile Properties of Nondegenerate Human Lumbar Anulus Fibrosus. Spine. 1996;21:452–461. doi: 10.1097/00007632-199602150-00009. [DOI] [PubMed] [Google Scholar]
- 41.Iatridis JC, Setton LA, Foster RJ, Rawlins BA, Weidenbaum M, Mow VC. Degeneration affects the anisotropic and nonlinear behaviors of human anulus fibrosus in compression. J Biomech. 1998;31:535–544. doi: 10.1016/s0021-9290(98)00046-3. [DOI] [PubMed] [Google Scholar]
- 42.Johannessen W, Elliott DM. Effects of Degeneration on the Biphasic Material Properties of Human Nucleus Pulposus in Confined Compression. Spine. 2005;30:E724–9. doi: 10.1097/01.brs.0000192236.92867.15. [DOI] [PubMed] [Google Scholar]
- 43.Nguyen AM, Johannessen W, Yoder JH, Wheaton AJ, Vresilovic EJ, Borthakur A, Elliott DM. Noninvasive quantification of human nucleus pulposus pressure with use of T1rho-weighted magnetic resonance imaging. J Bone Joint Surg Am. 2008;90:796–802. doi: 10.2106/JBJS.G.00667. [DOI] [PMC free article] [PubMed] [Google Scholar]
- 44.Marchand F, Ahmed AM. Investigation of the laminate structure of lumbar disc anulus fibrosus. Spine. 1990;15:402–410. doi: 10.1097/00007632-199005000-00011. [DOI] [PubMed] [Google Scholar]
- 45.Tsuji H, Hirano N, Ohshima H, Ishihara H, Terahata N, Motoe T. Structural variation of the anterior and posterior anulus fibrosus in the development of human lumbar intervertebral disc. A risk factor for intervertebral disc rupture. Spine. 1993;18:204–210. [PubMed] [Google Scholar]