

Abstract
Varicella-zoster virus (VZV) is a human herpesvirus. Primary infection causes varicella (chickenpox), a viremic illness typified by an exanthem consisting of several hundred vesicles. When VZV reactivates from latency in the spinal ganglia during late adulthood, the emerging virus causes a vesicular dermatomal rash (herpes zoster or shingles). To expand investigations of autophagy during varicella and zoster, newer 3D imaging technology was combined with laser scanning confocal microscopy to provide animations of autophagosomes in the vesicular rash. First, the cells were immunolabeled with antibodies against VZV proteins and the LC3 protein, an integral autophagosomal protein. Antibody reagents lacking activity against the human blood group A1 antigen were selected. After laser excitation of the samples, optimized emission detection bandwidths were configured by Zeiss Zen control software. Confocal Z-stacks comprising up to 40 optical slices were reconstructed into 3D animations with the aid of Imaris software. With this imaging technology, individual autophagosomes were clearly detectable as spheres within each vesicular cell. To enumerate the number of autophagosomes, data sets from 50 cells were reconstructed as 3D fluorescence images and analyzed with MeasurementPro software. The mean number of autophagosomes per infected vesicular cell was >100, although over 200 autophagosomes were seen in a few cells. In summary, macroautophagy was easily quantitated within VZV-infected cells after immunolabeling and imaging by 3D confocal animation technology. These same 3D imaging techniques will be applicable for investigations of autophagy in other virus-infected cells.
Keywords: autophagosome, varicella-zoster virus, 3D imaging software, confocal microscopy
1. Introduction
Autophagy is a subject of intense current investigation in several areas of infectious disease research(Deretic and Levine, 2009; Grose, 2010; Knodler and Celli, 2011; Kudchodkar and Levine, 2009). Macroautophagy (hereafter referred to as autophagy) is a process by which the cell regulates protein and organelle turnover(Reggiori and Klionsky, 2002). Autophagy was recognized initially as a survival mechanism for cells during periods of starvation. One of the oft cited studies of autophagy was carried out in neonatal mice; results from that pivotal study delineated clearly the induction of autophagy following brief periods of starvation(Kuma et al., 2004). Numerous investigations have demonstrated a low baseline level of autophagy in all healthy cells under both in vitro and in vivo conditions. But when cells are stressed, autophagy is upregulated quickly, in order to remove any accumulation of potentially damaging cytoplasmic proteins and thereby maintain homeostasis(Dunn, 1990a, b).
As noted in above citations, the sentinel organelle of autophagy is the autophagosome. The autophagosome is recognizable by transmission electron microscopy because of its characteristic double-walled outer membrane(Fengsrud et al., 2000). Within the double membrane resides a microtubule-associated protein called light chain 3 (LC3), a mammalian homolog of yeast autophagy-related protein 8 (Atg8)(Kabeya et al., 2000). The LC3 form integrated within the wall of the autophagosome is called LC3-II; LC3-II represents the lipidated form of the cytosolic LC3-I protein. The LC3-II protein within an autophagosome is detected easily by antibody fluoroprobes, because of the distinctive punctate appearance of the organelle. Therefore, the degree of autophagy can be assessed by enumeration of autophagosome formation by techniques such as laser scanning confocal microscopy (Klionsky, 2013).
In 2009, autophagy was detected in cultured cells after infection with varicella-zoster virus (VZV), the human herpesvirus that causes varicella (chickenpox) in children and herpes zoster (shingles) in older adults(Takahashi et al., 2009). Autophagy has been investigated further under experimental conditions in VZV-infected cultured cells(Carpenter et al., 2011). In prior papers, autophagy was observed in a limited number of human vesicle samples. In this investigation, newer imaging methods facilitated an expanded survey of autophagosome formation in human varicella and zoster vesicles. In particular, the application of the latest version of Imaris software for 3D rendering of Z-stacks of confocal images was very informative. Therefore, this imaging methodology is described in detail below because the same technology also should be applicable to studies of autophagy in other virus-cell systems.
2. Materials and Methods
2.1. Laser scanning confocal microscopy and reconstruction of 3D images
The confocal images of the varicella skin vesicles were collected on an upright Zeiss LSM710 Spectral confocal microscope using 40X and 63X high numerical-aperture oil immersion objective lenses. Image size was set to either 512 × 512 or 1024 × 1024 pixels. Multitrack sequential acquisition settings were used to avoid inter-channel cross-talk. Excitation was via a 561 nm diode-pumped solid-state laser and the 488 nm line of an argon ion laser. Optimized emission detection bandwidths were configured by Zeiss Zen control software. The confocal pinhole was set to 1 Airy unit. Z-stack acquisition intervals were selected to satisfy Nyquist sampling criteria. As described in the Imaris version 7.6 Reference Manual (Bitplane, South Windsor, CT), Imaris software provides 8 different viewing functions for the visualization and production of high quality confocal images. In this project, confocal Z-stacks comprising up to 40 images were reconstructed into 3D animations with the aid of Imaris software Slice and Easy 3D modes. The Spot function in Imaris automatically locates autophagosomes based on size and intensity thresholds. Each autophagosome is represented by a sphere of arbitrary size determined by the user. The displayed sphere is positioned at the center of mass of the identified autophagosome.
2.2. Immunolabeling of the vesicle samples
Murine monoclonal antibodies (MAbs) against individual VZV proteins were produced and characterized by this laboratory(Friedrichs and Grose, 1986; Grose et al., 1983). All MAbs were derived from secreted IgG purified from cell culture medium. Antibody reagents against the LC3 protein were purchased from the companies listed in Table 1. Secondary antibodies included Alexa 488 and 546 fluoroprobes conjugated to goat anti-rabbit IgG or goat anti-mouse IgG F(ab′)2 fragment (Invitrogen). Previously fixed samples of human skin vesicles from de-identified children with varicella or herpes zoster were obtained from archived samples collected as part of an earlier investigation to characterize anti-VZV monoclonal antibodies produced in this laboratory(Weigle and Grose, 1983). The primary antibody was added onto the samples for 2 hr at ambient temperature and overnight at 4°C. After washing (3 times for 5 min each), the samples were incubated with the secondary antibody for 2 hr at ambient temperature, before washing (3 times for 5 min each) and mounting on slides for viewing by confocal microscopy.
Table 1.
Antibody reagents against LC3 and their properties
| Antibody | Catalog # | Company | Animal | Type | Rating |
|---|---|---|---|---|---|
| 1 | L7543 | Sigma, St. Louis, MO | Rabbit | Poly | 1+ |
| 2 | sc-28266 | Santa Cruz Biotechnology, Dallas, TX | Rabbit | Poly | 2+ |
| 3 | 2057-1 | Epitomics, Burlingame, CA | Rabbit | Mono | 1+ |
| 4 | 38685 | Cell Signaling Technology, Danvers, MA | Rabbit | Mono | 1+ |
| 5 | M186-3 | MBL, Woburn, MA | Mouse | Mono | 2+ |
3. Results
3.1. Selection of the antibody probe to detect the LC3 protein
The first goal of this imaging project was to define a superior antibody probe for detection of autophagosomes. In an earlier publication, Carpenter et al (2011) had purchased a rabbit polyclonal anti-LC3 antibody from Sigma (Table 1). However, when samples with the same catalog number were purchased in 2012, lower dilutions were required in order to detect autophagosomes in cultured cells by confocal microscopy (1:100 vs 1:500). Therefore, testing was conducted on a panel of anti-LC3 antibodies purchased from 4 other companies (Table 1). An additional goal was to verify the specificity of the anti-LC3 rabbit antibody reagents, because of a recent publication that demonstrated endogenous reactivity of rabbit polyclonal antibodies as well as mouse MAbs derived from mouse ascites with the human blood group A antigen (Zerboni et al., 2012). In other words, if any of our archival varicella and zoster skin samples were obtained from a patient belonging to blood group A1, there may be reactivity of the contaminating anti-A antibody against the skin sample irrespective of any anti-LC3 activity. That is one reason why a mouse anti-LC3 MAb derived from IgG-purified cell culture medium was selected, since it would have no reactivity against blood group A1 antigen. In addition, two rabbit monoclonal antibodies against the LC3 protein were tested. In an initial set of screening experiments, all five antibody reagents detected puncta in vesicles samples from the same subject (Table 1). Similar studies on uninfected skin samples confirmed, as expected, that puncta representing autophagosomes were difficult to detect by confocal microscopy in normal tissues (Fig. S1).
3.2. Detection of autophagosomes within a varicella vesicle
In the first set of experiments to enumerate autophagosomes, the mouse anti-LC3 MAb was chosen as the probe (Table 1). As noted above, a mouse MAb derived from cell culture medium does not cross-react with human blood group A1 antigen present in human biopsy samples. In past experiments, Takahashi et al (2009) and Carpenter et al (2011) had used a rabbit anti-LC3 polyclonal antibody(Carpenter et al., 2011; Takahashi et al., 2009), even though the blood group antigen status of each human sample was not known. When the vesicle cells were inspected by confocal microscopy after immunolabeling with mouse anti-LC3 MAb, not all cells contained autophagosomes (Fig. 1). In fact, a minority of cells contained puncta, but the positive cells contained large numbers of puncta. These results both confirmed prior observations with a polyclonal anti-LC3 antibody and indicated that the earlier results were not confounded by activity against the blood group A antigen(Takahashi et al., 2009). No major differences were observed after examination of 8 different sets of archived samples. The tally of autophagosomes within 20 infected vesicular cells from a representative sample showed a mean of 52+/− 9, with a range of 38 to 72.
Figure 1.

Autophagosomes in human vesicles. Vesicle cell samples were prepared for confocal microscopic analysis after immunolabeling with murine anti-LC3 MAb as described in Methods and Table 1. Green signal represent LC3 protein. Panels A and B (100×) show scattered clusters of LC3-II expressing cells (arrows) among a much larger number of vesicular cells without LC3-II immunoreactivity. Panels C and D (630×) illustrate a higher magnification of autophagosomes resident within the clustered cells that are shown in panels A and B. Individual puncta are clearly visible in the cytoplasm of individual cells in panels C and D. Micron bars are shown on panels A and C. Also see negative control experiment in normal skin in Supplemental Fig. S1.
3.3. Imaging of autophagosomes and VZV structural proteins in vesicles
Weigle and Grose (1983) first investigated the distribution of viral proteins within a VZV vesicle as part of a project to produce and characterize anti-VZV specific monoclonal antibodies 30 years ago. Vesicle cells were selected because they are the site of final viral assembly and envelopment and therefore should harbor a broad spectrum of viral proteins. The biosynthesis of VZV proteins, as with those in other herpesviruses, is regulated in a series of kinetic phases, designated as immediate-early (IE), early and late; in turn, the late proteins are subdivided into early-late and true late(Honess and Roizman, 1974). In the initial studies as well as subsequent experiments, VZV gE is the predominant viral glycoprotein produced in VZV infected cells(Grose, 2002). VZV gE (ORF68) is placed within the early-late kinetic phase of VZV proteins, also called the gamma-1 phase. Within a vesicle sample examined by Z-stack imaging, VZV gE was detected throughout the cytoplasm of virtually all cells within a vesicle, while a smaller number contained LC3 positive autophagosomes (Fig. 2, panels A–F). A total of 50 autophagosomes were measured; the average diameter was 590 nm +/− 240 nm.
Figure 2.

Autophagosomes in VZV vesicular cells immunolabeled with an anti-VZV gE antibody. Vesicular cell samples were prepared for confocal microscopic analysis after immunolabeling with rabbit anti-LC3 MAb and a murine anti-gE MAb, designated clone 3B3. Both antibodies were derived from cell culture medium; therefore they could not attach to the human blood group A1 antigen. Green signal represents LC3 protein; red signal represents the VZV gE glycoprotein. A total of 10 slices were obtained. Panels A C represent slice 3 and panels D–F represent slice 4. The generally red background indicated that the majority of vesicular cells contained the VZV gE glycoprotein, while a smaller number of cells contained LC3-positive puncta (green). Red immunolabeled cells lacking green-colocalization are marked with white arrows. Also see 3D animation of the entire Z-stack in Supplemental Fig. S2.
Based on earlier observations that VZV-induced autophagy appeared to be an early event in the VZV infectious cycle in cultured cells, we postulated that the infected vesicle cells lacking autophagosomes may be cells in the very late phase of infection. To further investigate this hypothesis, we performed an experiment in cultured cells in which we carried out autophagy analyses at early infection (24 hpi) and late infection (72 hpi). Puncta representing autophagosomes were easily detectable at 24 hpi but not at 72 hpi (Fig. 3). Of note, syncytia formation is a late event and correlated with the absence of autophagosomes (Fig. 3B). Based on this experiment, we postulate that autophagosomes in vesicles also would be found more commonly in early infected cells rather than in later appearing polykaryons.
Figure 3.

Autophagosomes in VZV infected cultured cells. Two monolayers of human melanoma cells were inoculated with VZV infected cells; one was immunolabeled with mouse anti-LC3 MAb at 24 hpi (panel A) and the second was immunolabeled at 72 hpi (panel B), when syncytial formation was advanced and easily apparent because of the large polykaryons evident after staining the nuclei. Autophagosomes in panel A are designated by arrows. LC3 = green; VZV gE = red; nuclei = blue.
3.4. Imaging of autophagosomes within vesicles by 3D confocal microscopy
In earlier sections of Results, an unusually large number of autophagosomes were observed in vesicle cells by traditional 2D confocal microscopy. Because of the potential of the sophisticated Imaris 3D software program for visualization of subcellular components, the quantitation data obtained from a 2D image of one slice of a cell were extended to include a tally of all autophagosomes within an entire cell. To this end, a larger number of confocal Z-stacks of the vesicle samples labeled with the murine LC3 antibody were obtained. In turn, these data sets were loaded into Imaris for a true 3D reconstruction and analysis using the Imaris MeasurementPro module. Parameters based on both pixel intensity threshold and target object size were selected, in order to identify putative superimposed autophagosomes within the maximum intensity projection images of the raw confocal data sets. Subsequently, 50 individual cells containing fluorescent structures were cropped from the data sets and then visualized within a boundary frame. Six representative animations were created with Imaris software; images from each of the six the animations are shown in Fig. 4. Of importance, software-identified locations of individual autophagosomes were clearly demarcated as distinct spheres within each cell and were readily enumerated by the MeasurementPro software. The average number of autophagosomes was 118 per cell, although a few cells had over 200 (Fig. 5). Two illustrative 3D animations are shown in Supplemental Fig. S3 and S4.
Figure 4.

Images of autophagosomes in vesicular cells as reconstructed with Imaris 3D software. Vesicle cells were immunolabeled with murine anti-LC3 MAb and a fluoroprobe as described in previous legends. A Z-stack series was collected with a Zeiss LSM710 laser scanning microscope and 3D animations were assembled using Imaris software. Individual puncta (autophagosomes) were detected with the Imaris software and the center of each autophagosome was represented by a green sphere, as described in more detail in Methods and Results. Fifty cells were examined. Representative images of 6 individual cells are shown in panels A–F. Also see representative 3D animations in Fig. S3–S4.
Figure 5.
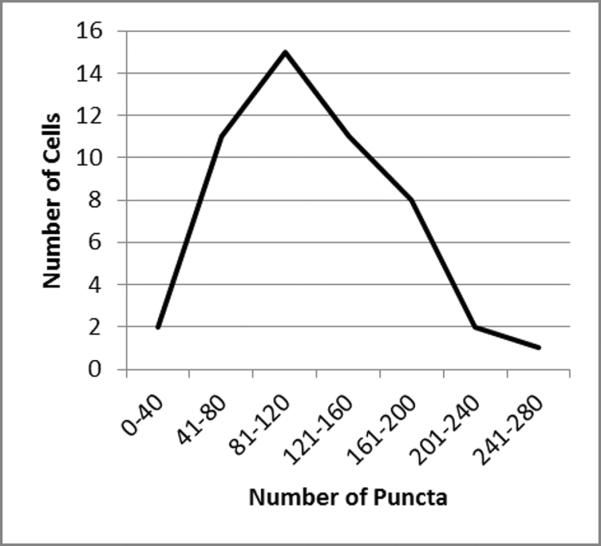
Enumeration of puncta in single vesicular cells using Imaris 3D software. As noted in the legend to Fig. 4, Z-stacks of LC3-labeled vesicle cells were collected on a Zeiss LSM710 confocal microscope. Z-stacks were opened with the Imaris software and a 3D projection was assembled. A total of 50 single cells or small groups of cells were selected using the “crop 3D” command. Puncta within each of the 50 cell sets were counted using the “add new spots” command. When the distribution of puncta was plotted, the peak subset of infected vesicular cells contained between 81 and 120 puncta.
4. Discussion
A new approach for 3D imaging and enumeration of autophagosomes is described in this report. The model for investigation was VZV infection, a known inducer of autophagy. VZV has coevolved with and continues to infect human populations throughout the world (Quinlivan and Breuer, 2005). The results herein with 3D imaging clearly show that autophagy is an abundant and easily detectable response to VZV infection in the skin vesicle, the final site of VZ virion assembly. The methodology in this report also should be applicable to investigations of autophagy in other virus-cell systems. The source of the autophagosome membrane remains a subject of investigation, but the ER and Golgi membranes are prime candidates(Dunn, 1990b; Yen et al., 2010). The process begins with vesicle nucleation, followed by vesicle elongation and closure of double walled outer membrane to form the autophagosome. As previously noted, the LC3-II protein is incorporated into the double-walled membrane of the autophagosome. Subsequently the autophagosome fuses with a lysosome, to form an autolysosome. At this stage, the inner membrane of the autophagosome is disrupted and the LC3-II protein is digested.
In this study, 5 different commercial antibodies to the LC3 protein were examined, in order to investigate autophagy in the VZV vesicle and validate prior results. Polyclonal antibodies with the same catalog number from the same company varied in anti-LC3 reactivity when purchased in different years. Therefore, antibodies of a different production lot need to be retitrated. When testing human samples, the investigator needs to be cognizant that rabbit polyclonal antibodies or mouse ascites antibodies may react with the human blood group A1 antigen, which is present even in non-hematological samples obtained from a human subject belonging to the A1 blood group (Zerboni et al., 2012). This problem can be avoided in one of 3 ways: (i) probing for LC3-positive autophagosomes with a MAb derived from culture medium and not from mouse ascites, (2) removing the anti-A reactivity of the antisera by adsorption, or (3) testing the human subject for blood group antigen status. In human samples obtained from individuals not belonging to the A blood group, any polyclonal antiserum reagent can be used without concern for this contaminating activity. In the initial experiments described in this report, the problem was avoided by selecting a mouse MAb purified from hybridoma cell medium and not ascites.
Enumeration of autophagosomes has been considered the gold standard for confirmation that autophagy is occurring within a cell. The number of autophagosomes per cell in a varicella vesicle is extraordinarily high, a result indicating greatly enhanced autophagy(Kabeya et al., 2000). VZV infection may induce polykaryons among the skin cells, so the increased number of easily detectable autophagosomes may include a population within a small cluster of fused cells. However, an experiment in cultured cells suggested that autophagosomal formation had ceased in syncytia, probably due to all autophagosomes having transitioned into lysosomes during the final phase of the infectious cycle. Increased autophagosomes have been observed also in tissues infected with nonfusogenic RNA viral infections, eg, hepatitis C (Sir et al., 2008). Other investigators have counted autophagosomes in cultured cells under normal nutrient conditions, including the authors of the original report that identified the LC3-II protein. The number of punctate autophagosomes per healthy mammalian cultured cell is small, with a range of 0–4 and a mean of 1–2(Kabeya et al., 2000; Tra et al., 2011). Likewise, cells within human and murine organs such as liver and pancreas, when not stressed, harbor 0–4 punctate autophagosomes per cell(Rosenfeldt et al., 2012). Similarly, punctate autophagosomes are difficult to detect in healthy human skin tissue(Carpenter et al., 2011). Even within a Z-stack, however, enumeration of all autophagosomes within a single cell or field of cells is extremely tedious if each slice is tabulated separately. Thus, the 3D animation capabilities provided by the latest version of Imaris software offer an entirely new perspective towards visualizing and quantitating macroautophagy within a stressed mammalian cell, e.g. after virus infection(Rueden and Eliceiri, 2007).
Supplementary Material
Highlights
Varicella zoster infection induces autophagy
The autophagosome is the sentinel organelle of autophagy
The number of autophagosomes correlates with the degree of autophagy
Autophagosomes within an entire cell can be enumerated by 3D imaging
Acknowledgements
This research was supported by NIH grant AI89716.
Footnotes
Publisher's Disclaimer: This is a PDF file of an unedited manuscript that has been accepted for publication. As a service to our customers we are providing this early version of the manuscript. The manuscript will undergo copyediting, typesetting, and review of the resulting proof before it is published in its final citable form. Please note that during the production process errors may be discovered which could affect the content, and all legal disclaimers that apply to the journal pertain.
REFERENCES
- Carpenter JE, Jackson W, Benetti L, Grose C. Autophagosome formation during varicella-zoster virus infection following endoplasmic reticulum stress and the unfolded protein response. J. Virol. 2011;85:9414–9424. doi: 10.1128/JVI.00281-11. [DOI] [PMC free article] [PubMed] [Google Scholar]
- Deretic V, Levine B. Autophagy, immunity, and microbial adaptations. Cell Host Microbe. 2009;5:527–549. doi: 10.1016/j.chom.2009.05.016. [DOI] [PMC free article] [PubMed] [Google Scholar]
- Dunn WA., Jr. Studies on the mechanisms of autophagy: formation of the autophagic vacuole. J Cell Biol. 1990a;110:1923–1933. doi: 10.1083/jcb.110.6.1923. [DOI] [PMC free article] [PubMed] [Google Scholar]
- Dunn WA., Jr. Studies on the mechanisms of autophagy: maturation of the autophagic vacuole. J Cell Biol. 1990b;110:1935–1945. doi: 10.1083/jcb.110.6.1935. [DOI] [PMC free article] [PubMed] [Google Scholar]
- Fengsrud M, Erichsen ES, Berg TO, Raiborg C, Seglen PO. Ultrastructural characterization of the delimiting membranes of isolated autophagosomes and amphisomes by freeze-fracture electron microscopy. Europ J Cell Biol. 2000;79:871–882. doi: 10.1078/0171-9335-00125. [DOI] [PubMed] [Google Scholar]
- Friedrichs WE, Grose C. Varicella-zoster virus p32/p36 complex is present in both the viral capsid and the nuclear matrix of the infected cell. J. Virol. 1986;57:155–164. doi: 10.1128/jvi.57.1.155-164.1986. [DOI] [PMC free article] [PubMed] [Google Scholar]
- Grose C. The predominant varicella-zoster virus gE and gI glycoprotein complex. In: Holzenburg A, editor. Structure-Function Relationships of Human Pathogenic Viruses. Kluwer Academic Press; New York, N.Y.: 2002. pp. 195–223. [Google Scholar]
- Grose C. Autophagy during common bacterial and viral infections of children. Pediatr. Infect. Dis. J. 2010;29:1040–42. doi: 10.1097/INF.0b013e3181e77f43. [DOI] [PMC free article] [PubMed] [Google Scholar]
- Grose C, Edwards DP, Friedrichs WE, Weigle KA, McGuire WL. Monoclonal antibodies against three major glycoproteins of varicella-zoster virus. Infect Immun. 1983;40:381–388. doi: 10.1128/iai.40.1.381-388.1983. [DOI] [PMC free article] [PubMed] [Google Scholar]
- Honess RW, Roizman B. Regulation of herpesvirus macromolecular synthesis. I. Cascade regulation of the synthesis of three groups of viral proteins. J. Virol. 1974;14:8–19. doi: 10.1128/jvi.14.1.8-19.1974. [DOI] [PMC free article] [PubMed] [Google Scholar]
- Kabeya Y, Mizushima N, Ueno T, Yamamoto A, Kirisako T, Noda T, Kominami E, Ohsumi Y, Yoshimori T. LC3, a mammalian homologue of yeast Apg8p, is localized in autophagosome membranes after processing. EMBO J. 2000;19:5720–5728. doi: 10.1093/emboj/19.21.5720. [DOI] [PMC free article] [PubMed] [Google Scholar]
- Klionksy DJ. Finding autophagy: it's a question of how you look at it. Autophagy. 2013;9:267. doi: 10.4161/auto.23483. [DOI] [PMC free article] [PubMed] [Google Scholar]
- Knodler LA, Celli J. Eating the strangers within: host control of intracellular bacteria via xenophagy. Cellular Microbiol. 2011;13:1319–1327. doi: 10.1111/j.1462-5822.2011.01632.x. [DOI] [PMC free article] [PubMed] [Google Scholar]
- Kudchodkar SB, Levine B. Viruses and autophagy. Rev Med Virol. 2009;19:359–378. doi: 10.1002/rmv.630. [DOI] [PMC free article] [PubMed] [Google Scholar]
- Kuma A, Hatano M, Matsui M, Yamamoto A, Nakaya H, Yoshimori T, Ohsumi Y, Tokuhisa T, Mizushima N. The role of autophagy during the early neonatal starvation period. Nature. 2004;432:1032–1036. doi: 10.1038/nature03029. [DOI] [PubMed] [Google Scholar]
- Quinlivan M, Breuer J. Molecular and therapeutic aspects of varicella-zoster virus infection. Expert Rev Mol Med. 2005;7:1–24. doi: 10.1017/S146239940500966X. [DOI] [PubMed] [Google Scholar]
- Reggiori F, Klionsky DJ. Autophagy in the eukaryotic cell. Eukaryotic cell. 2002;1:11–21. doi: 10.1128/EC.01.1.11-21.2002. [DOI] [PMC free article] [PubMed] [Google Scholar]
- Rosenfeldt MT, Nixon C, Liu E, Mah LY, Ryan KM. Analysis of macroautophagy by immunohistochemistry. Autophagy. 2012;8:963–969. doi: 10.4161/auto.20186. [DOI] [PMC free article] [PubMed] [Google Scholar]
- Rueden CT, Eliceiri KW. Visualization approaches for multidimensional biological image data. Biotechniques. 2007;43:31, 33–36. doi: 10.2144/000112511. [DOI] [PubMed] [Google Scholar]
- Sir D, Chen WL, Choi J, Wakita T, Yen TS, Ou JH. Induction of incomplete autophagic response by hepatitis C virus via the unfolded protein response. Hepatology. 2008;48:1054–1061. doi: 10.1002/hep.22464. [DOI] [PMC free article] [PubMed] [Google Scholar]
- Takahashi MN, Jackson W, Laird DT, Culp TD, Grose C, Haynes JI, 2nd, Benetti L. Varicella-zoster virus infection induces autophagy in both cultured cells and human skin vesicles. J. Virol. 2009;83:5466–5476. doi: 10.1128/JVI.02670-08. [DOI] [PMC free article] [PubMed] [Google Scholar]
- Tra T, Gong L, Kao LP, Li XL, Grandela C, Devenish RJ, Wolvetang E, Prescott M. Autophagy in human embryonic stem cells. PloS one. 2011;6:e27485. doi: 10.1371/journal.pone.0027485. [DOI] [PMC free article] [PubMed] [Google Scholar]
- Weigle KA, Grose C. Common expression of varicella-zoster viral glycoprotein antigens in vitro and in chickenpox and zoster vesicles. J. Infect. Dis. 1983;148:630–638. doi: 10.1093/infdis/148.4.630. [DOI] [PubMed] [Google Scholar]
- Yen WL, Shintani T, Nair U, Cao Y, Richardson BC, Li Z, Hughson FM, Baba M, Klionsky DJ. The conserved oligomeric Golgi complex is involved in double-membrane vesicle formation during autophagy. J Cell Biol. 2010;188:101–114. doi: 10.1083/jcb.200904075. [DOI] [PMC free article] [PubMed] [Google Scholar]
- Zerboni L, Sobel RA, Lai M, triglia R, Steain M, Abendroth A, Arvin Apparent expression of varicella-zoster virus proteins in laency resulting from reactivity of murine and rabbit antibodies with human blood group A determinants in sensory neurons. J Virol. 2012;86:578–83. doi: 10.1128/JVI.05950-11. [DOI] [PMC free article] [PubMed] [Google Scholar]
Associated Data
This section collects any data citations, data availability statements, or supplementary materials included in this article.