Abstract
Background
Low-voltage termination of VT and atrial fibrillation has shown promising results, however the mechanisms and full range of applications remain unexplored.
Objective
This study aimed to elucidate the mechanisms for low-voltage cardioversion and defibrillation, and to develop an optimal low-voltage defibrillation protocol.
Methods
We developed a detailed MRI-based computational model of the rabbit right ventricular wall. We applied multiple low-voltage far-field stimuli of various strengths (≤1 V/cm) and stimulation rates in VT and VF.
Results
Out of the five stimulation rates tested, stimuli applied at 16 or 88% of VT cycle length (CL) were most effective in cardioverting VT, the mechanism being consecutive excitable gap decreases. Stimuli given at 88% of VF CL defibrillated successfully, whereas a faster stimulation rate (16%) often failed because the fast stimuli did not capture enough tissue. In this model, defibrillation threshold (DFT) energy for multiple low-voltage stimuli at 88% VF CL was 0.58% of the DFT energy for a single strong biphasic shock. Based on the simulation results, a novel two-stage defibrillation protocol was proposed. The first stage converted VF into VT by applying low-voltage stimuli at times of maximal excitable gap, capturing large tissue volume and synchronizing depolarization; the second stage terminated VT. The energy required for successful defibrillation using this protocol was 57.42% of the energy for low-voltage defibrillation when stimulating at 88% CL.
Conclusion
A novel two-stage low-voltage defibrillation protocol using the excitable gap extent to time multiple stimuli defibrillated VF with the least energy by first converting VF into VT, then terminating VT.
Keywords: cardioversion, computers, defibrillation, fibrillation, tachycardia
Introduction
Defibrillation by strong electric shock remains the only known effective way of terminating ventricular fibrillation (VF) and, thus, preventing sudden cardiac death. However, strong shocks are associated with adverse effects including cellular injury from electroporation,1 cardiac conduction disturbances,2 mechanical dysfunction,3 increased mortality,4 and pain and psychological trauma.5 More than 100,000 implantable cardioverter-defibrillators (ICDs) are implanted annually in the United States alone.6 Regrettably, inappropriately delivered shocks remain common and over 13% of patients with an ICD receive one or more inappropriate shocks.7 The adverse effects of high-voltage shocks could be avoided or diminished if VF could be terminated reliably by defibrillation shocks of significantly lower voltage and energy.
Recent experimental studies have shown that applied electric fields delivering multiple far-field stimuli can terminate ventricular tachycardia (VT), atrial flutter, and atrial fibrillation (AF) with less total energy than a single strong shock.8-13 Some of these studies used stimulation rates close to the arrhythmia cycle length (CL),8,9 whereas others used stimulation rates much faster than that CL.10-13 Since the mechanisms by which multiple far-field stimuli terminate arrhythmias are not well understood, it remains unknown which stimulation protocol would present the optimal benefit. Furthermore, it is unclear whether VF can also be terminated by multiple low-voltage, far-field stimuli.
The aims of this study were to use a computational modeling approach to: 1) elucidate the mechanisms for low-voltage cardioversion and defibrillation, 2) demonstrate that low-voltage defibrillation (of VF) can be achieved, and 3) use the knowledge of the mechanisms uncovered here to develop an optimal low-voltage defibrillation protocol.
Methods
A brief overview of the methods is presented here, and detailed information is provided in the Supplementary Methods section. In short, a computational bidomain model of a rabbit right ventricle (RV) was developed, featuring cardiac microstructure such as trabeculations and major coronary vessels (Fig.1).14 Four different electric field directions were used in the simulations (“setups” in Fig.1C).
Figure 1.
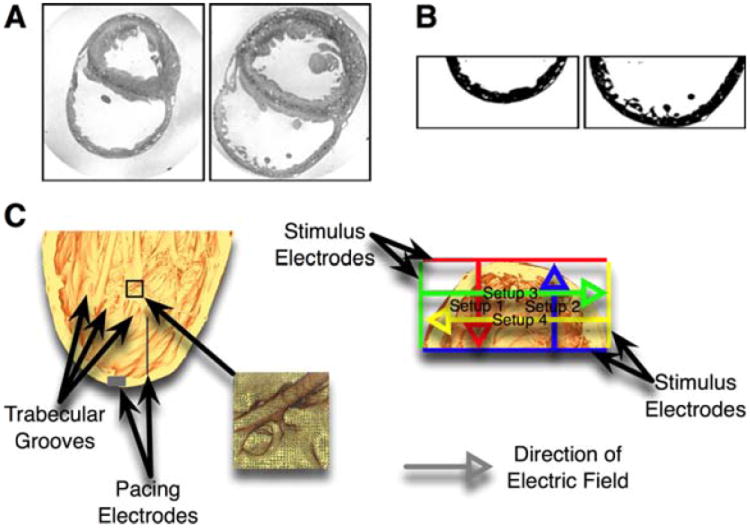
A: Sample MRI slices. Left image taken from apical, right image from basal position. B: The same MRI slices as in panel A after bath removal, segmentation, and cropping of RV wall. C: Long (left) and short (right) axis views of the high-resolution rabbit RV model. Grey boxes mark the pacing electrodes, colored lines mark the far-field electrodes, and colored arrows mark the electric field directions. The long axis view shows the endocardial microstructures (especially trabecular grooves). The inset provides a detailed view of the high-resolution finite-element mesh.
Both sustained VT and VF were induced in the model and low-voltage stimuli (all strengths were ≤1V/cm) were delivered to terminate the arrhythmias. To terminate VT, we applied multiple (up to 12) far-field stimuli of strengths above and below the diastolic activation threshold (3 strengths in the interval 173–289mV/cm, and one strength at 116mV, respectively) at different stimulation rates. The stimulation rates were chosen to closely match experimental protocols, with stimulation rates either close to the arrhythmia CL8,9 (75, 88, 100% of VT CL), or faster than it10-12 (16, 33% of VT CL). To terminate VF, far-field stimuli of strengths below (50–130mV, depending on electrode setup and waveform; see Supplementary Methods) and above (3 strengths in the interval 250–1000mV/cm) the activation threshold were applied at stimulation rates of 16 and 88% of VF CL. Stimuli were monophasic and rectangular (10ms duration), except when explicitly denoted as biphasic (then 50% duration per phase, exponentially truncated, 50% tilt). No stimuli were applied in the control case. Tissue was considered excitable when transmembrane potential (Vm) was ≤−70mV.15
Results
Cardioversion with Multiple Low-Voltage Far-Field Stimuli
Figure 2A shows the success rate of VT cardioversion following the application of multiple low-voltage far-field stimuli. Of the slower stimulation rates (75, 88, 100% VT CL), 75% and 88% VT CL had the highest VT termination success rates. Of these two stimulation rates, stimuli at 88% VT CL cardioverted with, on average, fewer far-field stimuli (3.53vs.5.53) and less energy (2.94vs.4.38μJ) than at 75% VT CL. Stimulation at 16% VT CL had the higher success rate among the two faster rates (16&33% VT CL). Cardioversion at strengths just below the diastolic activation threshold was always successful at 88% VT CL. For stimuli with strengths above the diastolic activation threshold, cardioversion was always successful at 16% VT CL and was successful in all but one case at 88% VT CL (see Suppl.Fig.S3 for this unsuccessful cardioversion attempt). Figure 2B shows that as the strength of the stimuli increased, the number of stimuli required for successful cardioversion decreased, while the overall stimulation energy required increased due to the higher strength of the stimuli.
Figure 2.
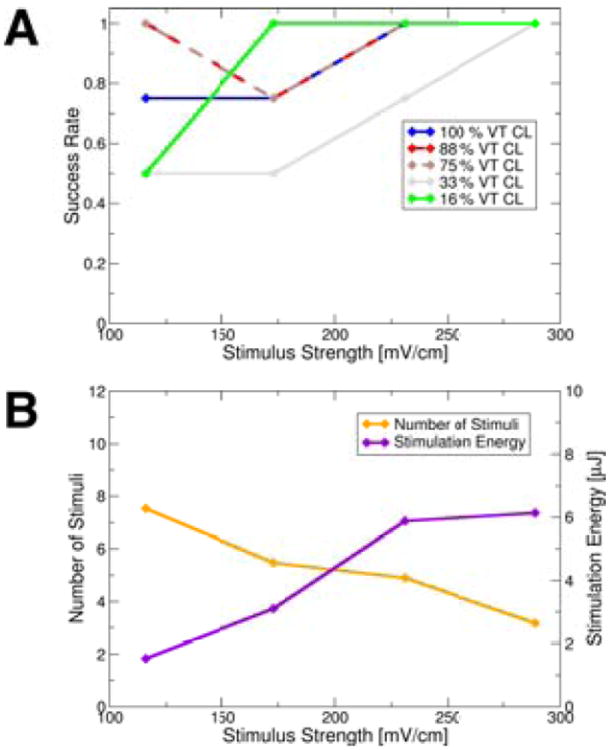
A: Mean cardioversion success rates for different stimulation rates and strengths (means taken over electrode setups to better differentiate between outcomes from stimulation rates). Data points representing means are shown as diamonds. B: Mean number of stimuli and stimulation energy required for successful cardioversion at different stimulation strengths (means taken over electrode setups and stimulation rates to illustrate trend). Data points representing means shown as diamonds.
Virtual electrode polarizations (VEPs; depolarizing and hyperpolarizing changes in Vm in response to an applied electric field)16 were strongest at the trabecular grooves (Suppl.Figs.S1A&S1C) and at the tip of the preexisting wavefront (Suppl.Fig.S1C). Consistent with our preliminary results,17 earliest endocardial activations after a field stimulus occurred at the trabecular grooves (Suppl.Fig.S1B). These observations underscore the significance of the endocardial structures—in particular, the trabecular grooves—in the tissue response to low-voltage far-field stimuli.
VEPs Cause Wavefront Advancement and Consecutive Reduction of the Excitable Gap, Leading to VT Termination
Even when VEPs did not elicit new activations (sub-threshold stimuli), the propagation of the reentrant wave was altered. Figure 3 shows maps of the activation time difference (Δt) between control activation times (VT activation times in the absence of far-field stimuli) and activation times after the application of multiple far-field stimuli. Blue areas in the Δt maps are those where the post-stimuli VT wavefront was advanced in comparison to that in control, and thus indicate a reduction in the extent of the spiral wave excitable gap. Red color in the Δt maps marks areas where the post-stimuli VT wavefront was retarded as compared to that in control, representing an increase in the excitable gap. For the first 110ms or 60% of VT CL after stimulus onset (areas enclosed by yellow and pink lines in Fig.3A), both VEP-induced wavefront advancement (blue) and retardation (red) were observed. However, at the end of the post-stimulus VT cycle (areas enclosed by green lines in Fig.3A), the wavefront was advanced compared to control throughout, regardless of electrode setup; additional information is provided in the Supplementary Results section. Consecutive far-field stimuli caused a consecutive reduction of the spiral wave excitable gap due to VEP-induced wavefront advancement. Figure 3B shows an example where this consecutive excitable gap reduction led to successful cardioversion.
Figure 3.
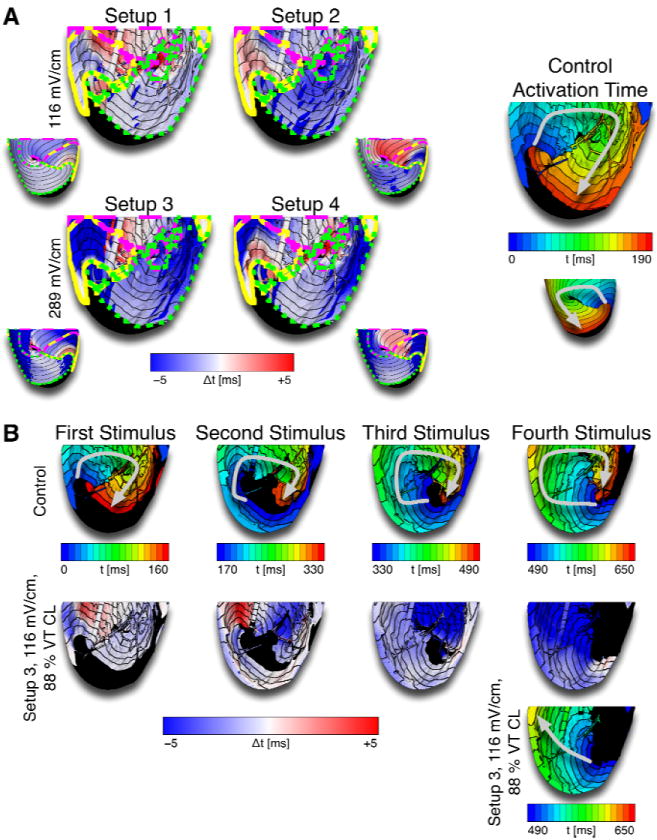
A: Differences in activation time (Δt) between control and cardioversion simulations after the first stimulus. Blue colors represent earlier activation after stimulation compared to control (i.e., wavefront advancement), red colors mark later activation after stimulation than control. Areas enclosed by the yellow lines were activated 0–40ms or 0–22% of VT CL after the stimulus, areas enclosed by the dashed pink lines were activated 40–110ms or 22–60% of VT CL after the stimulus, and areas enclosed by the dotted green lines were activated at the end of the post-stimulus VT cycle. Small insets show epicardial maps. The activation map on the right shows control activation time. Arrows mark the direction of propagation. At the end of the cycle, the wavefront was advanced after stimulation compared to control (blue areas enclosed by dotted green lines in Δt maps), regardless of electrode configuration. B: Activation maps and Δt maps over several cycles show the accumulation of wavefront advancement effects leading to the consumption of the excitable gap after several stimuli.
VT Termination by Collision with New VEP-Induced Wavefronts
Another cardioversion mechanism was the direct annihilation of the original VT wavefront when it collided with a new, VEP-induced wavefront. This mechanism was prevalent primarily at stimuli of comparatively higher strengths (e.g., 289mV/cm) and was not observed at strengths below or near the activation threshold. Figure 4 shows an example of such VT termination, where a new wavefront originated from VEPs in the trabecular grooves. Our simulations demonstrated that VEP-induced activations did not originate at the coronary vasculature, which is in contrast to the assertion made in the study by Luther et al.9
Figure 4.
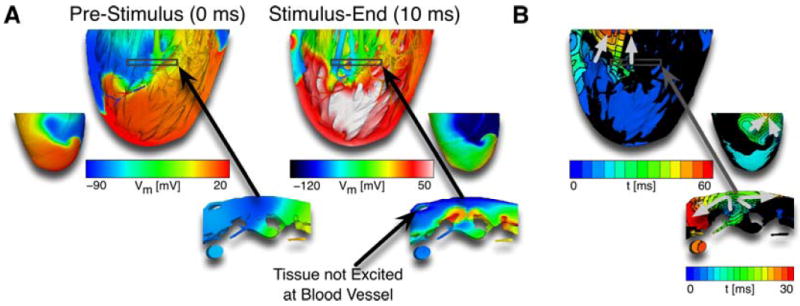
A: Vm maps before (left) and after (right) VEPs induced a new wavefront following one stimulus of 289mV/cm strength given from setup 1. The transmural views show post-stimulus excited tissue in the trabecular grooves, caused by VEPs, but no excited tissue at the coronary vasculature. B: Activation maps show VT termination due to collision of VT wavefront with the new VEP-induced wavefront for the same simulation as in panel A. The transmural view shows that the shock-induced wavefront originated in the trabecular grooves. Light grey arrows mark direction of propagation.
Additional examples of successful and unsuccessful low-voltage cardioversion are presented in Supplementary Figs.S2 and S3.
Defibrillation with Multiple Low-Voltage Far-Field Stimuli
Figure 5A presents a summary of the outcomes of defibrillation with multiple low-voltage far-field stimuli. A low-voltage defibrillation protocol where stimuli were applied at a rate of 88% VF CL was more successful than a protocol delivering stimuli at a faster rate (16% VF CL). No difference in the success rates of biphasic and monophasic stimuli was found. Stimuli above the diastolic activation threshold always defibrillated successfully at 88% VF CL stimulation rate, but were successful in one case only at 16% VF CL. Figure 5B shows that the number of stimuli required for successful defibrillation decreased with the increase in the strength of the stimuli, whereas the overall required energy increased. Figure 5C establishes that stimulation at 88% VF CL achieved defibrillation irrespective of the timing of the first stimulus and, therefore, irrespective of the “phase” of VF. Figure 5D compares the defibrillation threshold (DFT) of a single biphasic shock, today’s clinical standard defibrillation waveform, to the DFT of multiple low-voltage far-field stimuli. The average total DFT energy for multiple low-voltage far-field stimuli at 88% VF CL was 0.58% of the DFT energy of a single high-voltage biphasic shock. The leading edge voltage of the field stimuli at DFT was 1.42% of the leading edge voltage of the single biphasic shock at the respective DFT.
Figure 5.
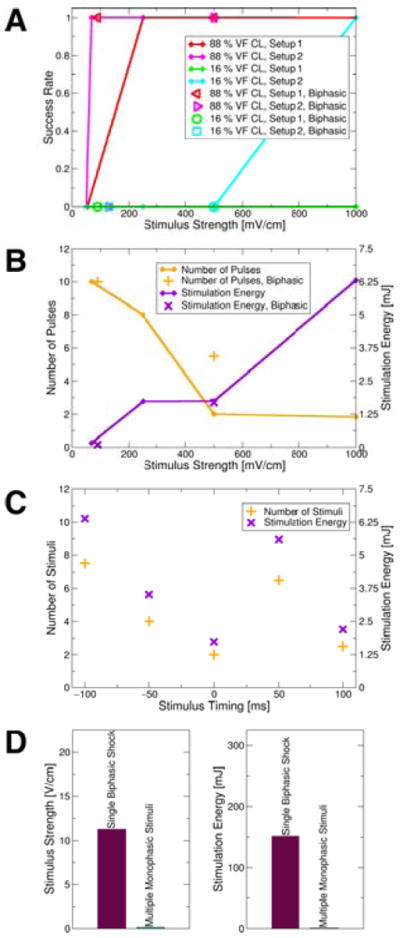
A: Defibrillation success rates for monophasic (lines; data points shown as diamonds) and biphasic (non-diamond symbols) stimuli as a function of stimulus strength and at 16% and 88% of VF CL. B: Mean number of stimuli and stimulation energy required for successful defibrillation attempts (means taken over electrode setups and stimulation rates). Diamonds show data points representing means for monophasic stimuli. C: Mean number of stimuli and mean stimulation energy required for defibrillation attempts at different “phases” of VF after 500mV/cm stimuli administered at 88% VF CL (means taken over electrode setups). Defibrillation was successful regardless of the timing of the initial stimulus. D: Mean DFTs of single biphasic shocks and of multiple low-voltage monophasic stimuli (means over electrode setups).
Tissue Capture by Low-Voltage Defibrillation Stimuli
Figure 6A shows the time course of the volume of excitable tissue in the model preparation during two defibrillation attempts (88%&16% VF CL). Defibrillation was successful after only two stimuli in the 88% case, but was unsuccessful in the 16% case. In both cases, the cumulative effects of positive and negative VEPs caused a decrease in the amount of excitable tissue immediately after a stimulus, as tissue was depolarized by positive VEPs, and as propagation quickly captured tissue made excitable by negative VEPs. In the 88% case, excitable volume subsequently increased, as tissue repolarized, and the next stimulus of the train was able to capture a large amount of excitable tissue. However, when the stimulation rate was 16% of VF CL, the tissue did not have time to recover from the previous stimulus, and no significant increase in excitable volume took place before the next stimulus. Thus, the faster stimuli (16% VF CL) were not able to capture large amounts of tissue and thus eliminate the excitable gap for propagation, which ultimately led to the reduced defibrillation success rate in this case (Fig.5A) as compared to that for the slower stimulation rate (88% VF CL).
Figure 6.
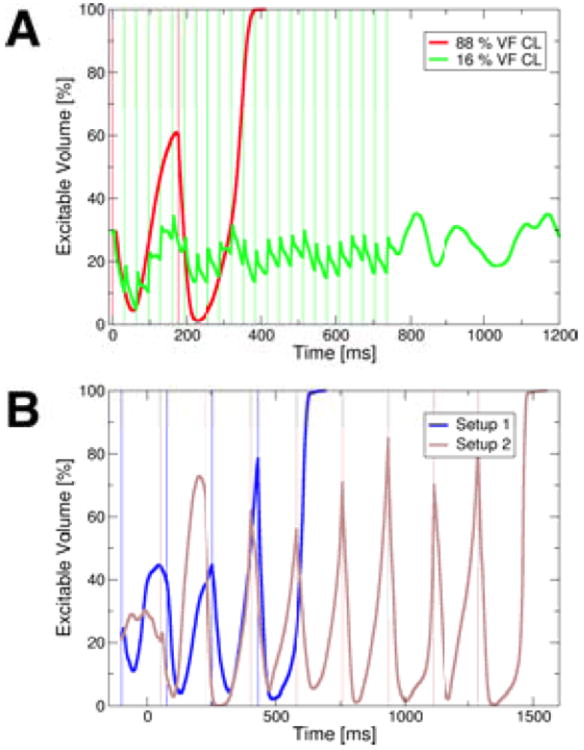
A: The volume of excitable tissue (measured as percentage of excitable nodes in the mesh) during successful defibrillation at 88% VF CL (red) and failed defibrillation at 16% VF CL (green) after 500mV/cm stimuli given from electrode setup 2. Thin vertical lines mark onsets of stimuli. B: The excitable volume during successful 500mV/cm, 88% VF CL defibrillation stimuli delivered at different “phases” of VF. The blue line represents excitable volume when the first stimulus was administered from setup 1 100ms earlier than the initial stimuli in the protocols presented in panel A. The brown line marks the excitable volume in the case when the initial stimulus was administered from setup 2 50ms later than the first stimuli in the protocols shown in panel A. Thin vertical lines mark onsets of stimuli.
Analyzing the excitable volume for 88% VF CL low-voltage defibrillation episodes at different VF “phases” (different timings of the first stimulus), we observed that stimuli delivered when the excitable volume was particularly large were especially successful (Fig.6B), irrespective of the electrode setup.
Conversion of Ventricular Fibrillation into Ventricular Tachycardia
Based on this observation, we then attempted to defibrillate by applying low-voltage far-field stimuli at the times when tissue excitable volume was maximum (the excitable gap was largest), as opposed to applying stimuli at a set rate. We chose stimuli of the lowest supra-threshold strength from our defibrillation protocol for this set of simulations, 250mV/cm. Figure 7A shows the excitable volume in the preparation and sample Vm maps at specific timings for stimuli applied from electrode setup 1; corresponding plots for setup 2 are presented in Fig.7B. Stimuli applied at excitable volume maxima converted VF into VT (Vm maps in Fig.7) in both cases. The VT was subsequently terminated by the continuing stimuli for setup 2 (Fig.7B), while stimuli from setup 1 failed to do so (Fig.7A; case addressed in the following section). In both cases, conversion from VF into VT was achieved because the appropriately timed low-voltage stimuli “synchronized” tissue depolarization. Stimuli applied when the excitable gap was large were able to capture large amounts of tissue. This is evidenced by the fact that the amount of excitable tissue at stimulus-onset was consistently above 75%, and the post-stimulus minimum amount of excitable tissue was below 5% from the third stimulus onwards (setup 2, Fig.7B) or from the sixth stimulus onwards (setup 1, Fig.7A), respectively. The captured tissue then depolarized and repolarized at approximately the same time. This mechanism converted VF into VT after only a few low-voltage stimuli.
Figure 7.
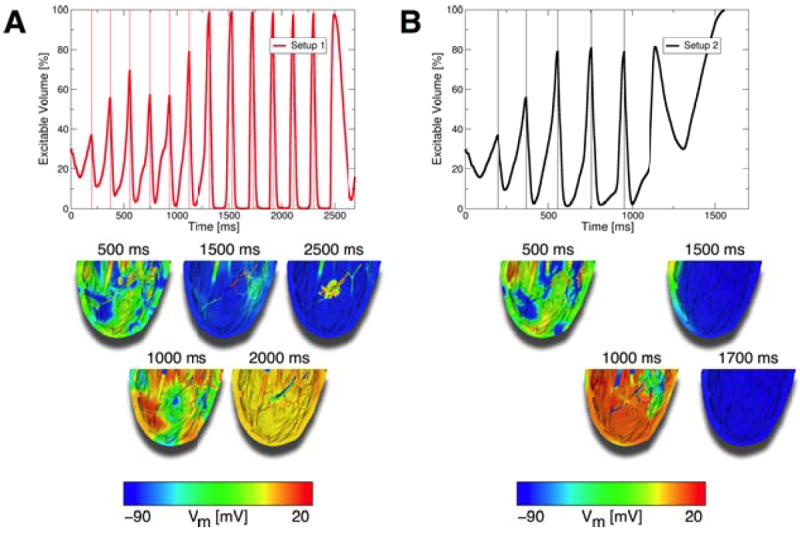
A: Top panel: The excitable volume during a defibrillation attempt from electrode setup 1 where 250mV/cm stimuli were delivered at timings when the amount of excitable tissue was maximal. Lower panels: Vm maps of defibrillation attempt. VF was converted to VT with these appropriately timed stimuli, but VT remained stable and did not terminate. B: Top panel: Excitable volume during defibrillation attempt from electrode setup 2 where 250mV/cm stimuli were delivered at timings when the excitable tissue was maximal. Lower panels: Vm maps of defibrillation attempt. VF was converted to VT, and VT was then terminated with additional stimuli from setup 2. Thin vertical lines in top panels mark onsets of stimuli.
A Two-Stage Low-Voltage Defibrillation Protocol
While the above protocol always converted VF into VT, it did not always terminate VT (Fig.7A). Termination of VT failed in that case because each stimulus was delivered at the same instant of the VT cycle each time, when it did not perturb the stable rotor. Therefore, we applied a two-stage defibrillation protocol: First, VF was converted into VT with the application of multiple low-voltage stimuli at times when the amount of excitable tissue was maximal. Second, low-voltage stimuli at 88% of VT CL were applied to terminate VT. With the addition of this second stage, VT could now be terminated (compare lower panels of Fig.7A with middle panel of Fig.8B). The number of stimuli and the energy required for successful defibrillation with this two-stage defibrillation protocol as compared to the case when stimuli were applied at 88% VF CL are presented in Fig.8A, while Fig.8B shows Vm maps of the two-stage defibrillation protocol compared to control (no applied stimuli) at different times. Supplementary Fig.S7 portrays the excitable volume during two-stage defibrillation. The number of stimuli required for successful two-stage defibrillation at 250mV/cm was 56.25% of the number of stimuli required at 88% VF CL stimulation rate (4.5vs.8), and the total energy for successful two-stage defibrillation was 57.42% of the energy required at 88% VF CL rate (0.99vs.1.73mJ; Fig.8A).
Figure 8.
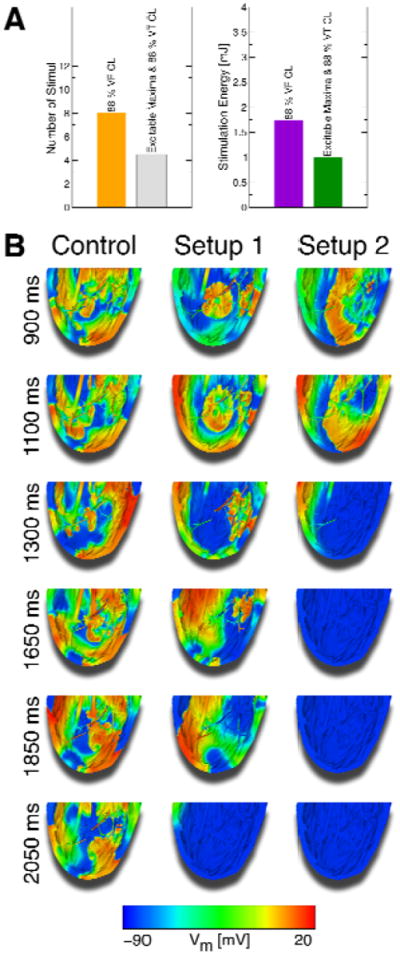
A: Comparison of the mean number of stimuli and energy required for successful defibrillation following 250mV/cm stimuli at 88% VF CL and using the two-stage defibrillation protocol (means taken over electrode setups). B: Vm maps of successful defibrillation with the two-stage defibrillation protocol compared to control Vm maps. With this two-stage defibrillation protocol, VF was converted into VT, which was then successfully terminated.
Finally, we attempted to find a surrogate measure for excitable volume, since the latter cannot be measured experimentally or clinically. We found that in the first stage of our protocol the extent of tissue on the myocardial surface with extracellular potentials (Φe) >0mV could successfully be used as a surrogate for the volume of excitable tissue (Suppl.Fig.S8). Additional detail regarding this modified two-stage protocol is provided in the Supplementary Results.
Discussion
Consistent with our aims, this study provided detailed insights into the mechanisms of low-voltage cardioversion and defibrillation; demonstrated the feasibility of low-voltage ventricular defibrillation; and introduced a new defibrillation protocol that terminated VF more efficiently than other low-voltage defibrillation approaches. The main findings of this research are:
Multiple low-voltage far-field stimuli can terminate VT and VF in our model,
VT termination results from VEPs causing advancement of the VT wavefront and eliciting additional wavefronts,
Defibrillation stimuli given at rates close to the VF CL are more effective than stimuli given at faster rates,
Far-field stimuli administered at timings when the excitable volume is maximal (i.e., using electrical data gathered from the myocardium as feedback to appropriately time each stimulus) successfully convert VF into VT, and
Termination of VF using a novel two-stage defibrillation protocol is achieved with fewer stimuli and less total energy than with protocols using a set stimulation rate (16% or 88% of VF CL).
This paper presents a study of low-voltage defibrillation in the rabbit RV, using a computational model of unprecedented detail. The computational demands of the study were thus extraordinary: a total of 125 episodes of cardioversion/defibrillation were simulated in a bidomain model with 29 million elements. This high-resolution model allowed the exploration of the role of small endocardial structural features, such as trabeculations, in the tissue response to low-voltage electric stimuli; the behavior was examined on a spatial scale much smaller than that of optical imaging techniques.8,10,11 Low-voltage defibrillation with multiple far-field stimuli has several advantages over the current clinical standard approach of defibrillating with a single strong biphasic shock. Lower shock energy results in less tissue damage, can preserve battery life, and, importantly, could spare patients the pain and psychological trauma associated with high-voltage defibrillation.5 Recent studies on low-voltage cardioversion and defibrillation have shown promising results. VT was successfully terminated in infarcted ventricles using multiple low-voltage stimuli in studies conducted by Efimov’s group,10,13 and several studies have shown that AF could be defibrillated successfully using multiple far-field stimuli.8,9,11,12 This study additionally presented, for the first time, low-voltage VF termination.
We found that far-field stimuli could terminate VT even below the diastolic activation threshold by consecutive advancement of the VT wavefront following each stimulus and, thus, by a cumulative consumption of the spiral wave excitable gap. VT could also be terminated by new stimulus-induced wavefronts, the propagation of which eradicated the excitable gap. The formation of VEPs in the myocardium was crucial for both of these mechanisms, even if these stimulus-induced polarizations were below the activation threshold. Confirming our preliminary findings,17 the strongest VEPs occurred in the trabecular grooves.
Fenton and co-workers used stimulation rates close to the AF cycle length,8,9 whereas Efimov’s group mainly used faster stimulation rates to terminate AF and VT.10-13 We tested stimulation rates close to the VT CL and also faster rates and found that protocols from either group can be effective in cardioverting VT. However, of the two stimulation rates used for low-voltage termination of VF, only the slow stimulation rate (88% VF CL) was effective. The inability of stimuli at fast rates to defibrillate was due to the fact that the tissue was not able to recover from the preceding stimulation, and the subsequent stimuli were thus not able to capture large amounts of tissue. When cardioverting VT, on the other hand, only a contiguous large excitable gap needed to be consumed; VEP-induced activations generated within that excitable gap terminated VT in a fashion largely independent of the stimulation rate.
A major finding of this study is that VF can be converted into VT if far-field stimuli are applied at times when the excitable gap was largest. We used this finding to propose a novel two-stage defibrillation approach: In the first stage, VF is converted into VT using low-voltage electric stimuli applied at times of maximum excitable volume in the myocardium. In the second stage, VT is terminated by applying low-voltage stimuli at 88% VT CL. It should be noted that a variety of approaches could be used in the second stage to terminate VT instead of our protocol, such as far-field stimuli applied at different rates or anti-tachycardia pacing. Our two-stage protocol defibrillated with fewer stimuli and less energy than low-voltage defibrillation protocols at set stimulation rates. Reducing the number of required defibrillation stimuli is especially significant from a hemodynamic standpoint: when the new two-stage protocol was used, the time the model preparation spent in VF was less than half the time it spent in VF when low-voltage defibrillation at 88% VF CL was applied.
Our two-stage defibrillation protocol uses the amount of the excitable volume to time stimulus delivery, but the excitable volume cannot be measured directly. Surface Φe, on the other hand, could be measured using electrodes. As a proof of concept, we were able to show that the first stage of our protocol also works if the extent of tissue with Φe>0mV on the myocardial surface is used as a rough surrogate measure of the volume of excitable tissue (rationale provided in Supplementary Results). This provides an avenue for future research and device development to bring this two-stage defibrillation protocol to the clinic.
The exact human pain threshold for defibrillation shocks is not known, but it has been shown that the threshold lies at or below 400 mJ.18 The average total energy required for successful defibrillation with the proposed two-stage defibrillation method at 250mV/cm was 0.99mJ, but low-voltage defibrillation in humans will require more energy than that. Nevertheless, we speculate that low-voltage defibrillation below the pain threshold can be achieved with this novel two-stage protocol.
Limitations
The model used in this study represents the RV wall only and not the entire ventricles and is of a rabbit heart, not of a human. This model was chosen because it was crucial for this study to include as much anatomical detail as possible—as is evident by the importance of the trabecular grooves in VEP formation—while also being computationally tractable. A rabbit RV model was chosen because the rabbit is a well-established model for arrhythmia studies, because rabbit hearts have similar spatiotemporal characteristics as human hearts,19 and because the smaller size of the preparation ensured computational tractability. Despite these limitations, we expect our findings to be generalizable because 1) the key anatomical features (trabeculations) that affect the electrical behavior in the heart following low-voltage defibrillation stimuli were represented in detail here, and trabeculations are similarly characteristic of the human heart, and 2) multiple electrode configurations were used, from the simulations with which behavior for other electrode configurations can be extrapolated. Clearly, further studies are needed before this study’s findings can be translated into the clinic.
We did not incorporate the Purkinje system into our model. Boyle and co-workers showed that post-shock activations arose from the Purkinje system for shock strengths ≥2.5V/cm, much higher than the strengths used here.20 Dr. Boyle generously conducted simulations with the same model20 and confirmed that stimuli at the strengths used here did not elicit a Purkinje response (Patrick Boyle, unpublished data, 2012). Therefore, the lack of a Purkinje system in our model does not affect the validity of our findings.
Although the choice of plate electrodes represents a simplified far-field electrode configuration, its use in defibrillation studies is an established technique.11,15,21,22 We used four electrode setups in this study to ensure independence of our findings from a particular electric field direction, and to represent various scenarios where the ventricular wall was subjected to different electric fields.
Conclusion
This research demonstrates that the strongest VEPs following low-voltage far-field stimuli occurred in the trabecular grooves. These VEPs caused advancement of existing wavefronts and induced new ones, resulting in consumption of the excitable gap and VT termination. Low-voltage defibrillation of VF by multiple stimuli was more effective when the stimuli were at a rate close to the VF CL than at faster rates. A novel two-stage defibrillation protocol using information about the volume of excitable tissue as feedback to appropriately time the stimuli terminated VF with fewer stimuli and less energy than stimuli applied at constant rates. Stimuli applied when the largest amount of tissue was excitable captured the most tissue, and synchronized depolarization. VF was converted into VT in the first stage of this defibrillation protocol, while VT was terminated in the second. Stimuli with strengths of only two to three times the diastolic activation threshold were sufficient to successfully terminate VF.
Supplementary Material
Acknowledgments
We are indebted to Dr. Boyle, who performed simulations with his Purkinje system model.
Financial Support: NIH grant R01-HL103428 and National Science Foundation (NSF) grant CDI-1124804 to N.A.T.
Abbreviations
- AF
atrial fibrillation
- CL
cycle length
- DFT
defibrillation threshold
- ICD
implantable cardioverter–defibrillators
- MRI
magnetic resonance imaging
- Φe
extracellular potential
- RV
right ventricle
- VEP
virtual electrode polarization
- VF
ventricular fibrillation
- Vm
transmembrane potential
- VT
ventricular tachycardia
Footnotes
Potential Conflicts of Interest: L.J.R.: none; B.M.T.: partial ownership of CardioSolv, LLC; N.A.T.: partial ownership of CardioSolv, LLC; CardioSolv, LLC was not involved in this research
Publisher's Disclaimer: This is a PDF file of an unedited manuscript that has been accepted for publication. As a service to our customers we are providing this early version of the manuscript. The manuscript will undergo copyediting, typesetting, and review of the resulting proof before it is published in its final citable form. Please note that during the production process errors may be discovered which could affect the content, and all legal disclaimers that apply to the journal pertain.
References
- 1.Al-Khadra A, Nikolski V, Efimov IR. The role of electroporation in defibrillation. Circ Res. 2000 Oct 27;87:797–804. doi: 10.1161/01.res.87.9.797. [DOI] [PubMed] [Google Scholar]
- 2.Eysmann SB, Marchlinski FE, Buxton AE, Josephson ME. Electrocardiographic changes after cardioversion of ventricular arrhythmias. Circulation. 1986 Jan;73:73–81. doi: 10.1161/01.cir.73.1.73. [DOI] [PubMed] [Google Scholar]
- 3.Tokano T, Bach D, Chang J, et al. Effect of ventricular shock strength on cardiac hemodynamics. J Cardiovasc Electrophysiol. 1998 Aug;9:791–797. doi: 10.1111/j.1540-8167.1998.tb00118.x. [DOI] [PubMed] [Google Scholar]
- 4.Larsen GK, Evans J, Lambert WE, Chen Y, Raitt MH. Shocks burden and increased mortality in implantable cardioverter-defibrillator patients. Heart Rhythm. 2011 Dec;8:1881–1886. doi: 10.1016/j.hrthm.2011.07.036. [DOI] [PubMed] [Google Scholar]
- 5.Maisel WH. Pacemaker and ICD generator reliability: meta-analysis of device registries. JAMA. 2006 Apr 26;295:1929–1934. doi: 10.1001/jama.295.16.1929. [DOI] [PubMed] [Google Scholar]
- 6.Kramer DB, Buxton AE, Zimetbaum PJ. Time for a change--a new approach to ICD replacement. N Engl J Med. 2012 Jan 26;366:291–293. doi: 10.1056/NEJMp1111467. [DOI] [PubMed] [Google Scholar]
- 7.van Rees JB, Borleffs CJ, de Bie MK, et al. Inappropriate implantable cardioverter-defibrillator shocks: incidence, predictors, and impact on mortality. J Am Coll Cardiol. 2011 Feb 1;57:556–562. doi: 10.1016/j.jacc.2010.06.059. [DOI] [PubMed] [Google Scholar]
- 8.Fenton FH, Luther S, Cherry EM, et al. Termination of atrial fibrillation using pulsed low-energy far-field stimulation. Circulation. 2009 Aug 11;120:467–476. doi: 10.1161/CIRCULATIONAHA.108.825091. [DOI] [PMC free article] [PubMed] [Google Scholar]
- 9.Luther S, Fenton FH, Kornreich BG, et al. Low-energy control of electrical turbulence in the heart. Nature. 2011 Jul 14;475:235–239. doi: 10.1038/nature10216. [DOI] [PMC free article] [PubMed] [Google Scholar]
- 10.Li W, Ripplinger CM, Lou Q, Efimov IR. Multiple monophasic shocks improve electrotherapy of ventricular tachycardia in a rabbit model of chronic infarction. Heart Rhythm. 2009 Jul;6:1020–1027. doi: 10.1016/j.hrthm.2009.03.015. [DOI] [PMC free article] [PubMed] [Google Scholar]
- 11.Ambrosi CM, Ripplinger CM, Efimov IR, Fedorov VV. Termination of sustained atrial flutter and fibrillation using low-voltage multiple-shock therapy. Heart Rhythm. 2011 Jan;8:101–108. doi: 10.1016/j.hrthm.2010.10.018. [DOI] [PMC free article] [PubMed] [Google Scholar]
- 12.Li W, Janardhan AH, Fedorov VV, Sha Q, Schuessler RB, Efimov IR. Low-energy multistage atrial defibrillation therapy terminates atrial fibrillation with less energy than a single shock. Circ Arrhythm Electrophysiol. 2011 Dec;4:917–925. doi: 10.1161/CIRCEP.111.965830. [DOI] [PMC free article] [PubMed] [Google Scholar]
- 13.Janardhan AH, Li W, Fedorov VV, et al. A Novel Low-Energy Electrotherapy That Terminates Ventricular Tachycardia With Lower Energy Than a Biphasic Shock When Antitachycardia Pacing Fails. J Am Coll Cardiol. 2012 Oct 25; doi: 10.1016/j.jacc.2012.08.1001. [DOI] [PMC free article] [PubMed] [Google Scholar]
- 14.Burton RA, Plank G, Schneider JE, et al. Three-dimensional models of individual cardiac histoanatomy: tools and challenges. Ann N Y Acad Sci. 2006 Oct;1080:301–319. doi: 10.1196/annals.1380.023. [DOI] [PMC free article] [PubMed] [Google Scholar]
- 15.Rantner LJ, Arevalo HJ, Constantino JL, Efimov IR, Plank G, Trayanova NA. Three-dimensional mechanisms of increased vulnerability to electric shocks in myocardial infarction: Altered virtual electrode polarizations and conduction delay in the peri-infarct zone. J Physiol. 2012 Sep 15;590:4537–4551. doi: 10.1113/jphysiol.2012.229088. [DOI] [PMC free article] [PubMed] [Google Scholar]
- 16.Efimov IR, Cheng Y, Van Wagoner DR, Mazgalev T, Tchou PJ. Virtual electrode-induced phase singularity: a basic mechanism of defibrillation failure. Circ Res. 1998 May 4;82:918–925. doi: 10.1161/01.res.82.8.918. [DOI] [PubMed] [Google Scholar]
- 17.Trayanova N. Atrial defibrillation voltage: falling to a new low. Heart Rhythm. 2011 Jan;8:109–110. doi: 10.1016/j.hrthm.2010.10.037. [DOI] [PMC free article] [PubMed] [Google Scholar]
- 18.Steinhaus DM, Cardinal DS, Mongeon L, Musley SK, Foley L, Corrigan S. Internal defibrillation: pain perception of low energy shocks. Pacing Clin Electrophysiol. 2002 Jul;25:1090–1093. doi: 10.1046/j.1460-9592.2002.01090.x. [DOI] [PubMed] [Google Scholar]
- 19.Panfilov AV. Is heart size a factor in ventricular fibrillation? Or how close are rabbit and human hearts? Heart Rhythm. 2006 Jul;3:862–864. doi: 10.1016/j.hrthm.2005.12.022. [DOI] [PubMed] [Google Scholar]
- 20.Boyle PM, Deo M, Plank G, Vigmond EJ. Purkinje-mediated effects in the response of quiescent ventricles to defibrillation shocks. Ann Biomed Eng. 2010 Feb;38:456–468. doi: 10.1007/s10439-009-9829-4. [DOI] [PubMed] [Google Scholar]
- 21.Rodriguez B, Li L, Eason JC, Efimov IR, Trayanova NA. Differences between left and right ventricular chamber geometry affect cardiac vulnerability to electric shocks. Circ Res. 2005 Jul 22;97:168–175. doi: 10.1161/01.RES.0000174429.00987.17. [DOI] [PMC free article] [PubMed] [Google Scholar]
- 22.Ashihara T, Constantino J, Trayanova NA. Tunnel propagation of postshock activations as a hypothesis for fibrillation induction and isoelectric window. Circ Res. 2008 Mar 28;102:737–745. doi: 10.1161/CIRCRESAHA.107.168112. [DOI] [PMC free article] [PubMed] [Google Scholar]
Associated Data
This section collects any data citations, data availability statements, or supplementary materials included in this article.


