Abstract
Purpose
To test the hypothesis that a whole-body fat-water MRI (FWMRI) protocol acquired at 3 Tesla combined with semi-automated image analysis techniques enables precise volume and mass quantification of adipose, lean and bone tissue depots that agree with static scale mass and scale mass changes in the context of a longitudinal study of large-breed dogs placed on an obesogenic high-fat, high-fructose diet.
Materials and Methods
Six healthy adult male dogs were scanned twice, at weeks 0 (baseline) and 4, of the dietary regiment. FWMRI-derived volumes of adipose tissue (total, visceral, and subcutaneous), lean tissue, and cortical bone were quantified using a semi-automated approach. Volumes were converted to masses using published tissue densities.
Results
FWMRI-derived total mass corresponds with scale mass with a concordance correlation coefficient of 0.931 (95% confidence interval = [0.813, 0.975]), and slope and intercept values of 1.12 and −2.23 kg respectively. Visceral, subcutaneous and total adipose tissue masses increased significantly from weeks 0 to 4, while neither cortical bone nor lean tissue masses changed significantly. This is evidenced by a mean percent change of 70.2% for visceral, 67.0% for subcutaneous, and 67.1% for total adipose tissue.
Conclusion
FWMRI can precisely quantify and map body composition with respect to adipose, lean and bone tissue depots. The described approach provides a valuable tool to examine the role of distinct tissue depots in an established animal model of human metabolic disease.
Keywords: fat-water, whole-body, canine, adipose, lean, bone
Introduction
The prevalence of insulin resistance and Type 2 diabetes mellitus (T2DM) is rising in humans (1). Because the onset of T2DM is correlated with obesity (2), the ability to quantitatively track changes in adipose tissue (AT) deposition can enhance our understanding of T2DM onset and progression. Volumetric imaging of AT depots within the whole-body is already an active area of study in human research (3–6) with many methods and applications still to be explored. In addition to human imaging studies for AT quantification, well-characterized animal models in which whole-body adiposity can be manipulated can improve our understanding of the role of AT depots in the pathogenesis of obesity-associated diseases. Such animal models are well suited for longitudinal, noninvasive measurements of abdominal subcutaneous AT (SAT) and visceral AT (VAT) that can provide critical information about adiposity changes caused by dietary and pharmacological interventions. Whole-body fat-water MRI (FWMRI) is unique among the available body composition imaging methods because it provides true 3D volumetric images without the use of ionizing radiation. Though used often in human studies, whole-body FWMRI remains underutilized in large animal models such as dogs. The canine model is particularly valuable for obesogenic diet studies (7,8) that would be difficult to perform in a human cohort.
In this work we present the adaptation and extension of a whole-body FWMRI acquisition and semi-automated image analysis pipeline, initially validated in human subjects, for whole-body FWMRI and body composition quantification in dogs. Specifically, we describe an extension of the analysis of fat-water separated images to identify cortical bone (CB) voxels and to include CB as a separate tissue depot in the estimation of total body mass and body mass change. We test the hypothesis that our FWMRI acquisition and analysis techniques enable precise volume and mass quantification of adipose, lean and bone tissue depots that agree with static scale mass and scale mass changes in the context of a longitudinal study of large-breed dogs placed on an obesogenic high-fat, high-fructose diet known to increase insulin resistance and to cause body composition changes (7). In addition to displaying visual evidence of high quality images and segmentations of AT, soft lean tissue (LT), and CB, we provide quantitative assessment of the quality and validity of our approach using three distinct metrics: 1) comparison of FWMRI-derived body mass versus scale mass, 2) comparison of FWMRI-derived mass change versus change in scale mass, and 3) test-retest coefficient of variation (CV) of estimated total body AT, abdominal SAT, abdominal VAT, total body LT and total body CB depot volumes.
Materials and Methods
This study was approved by the local Institutional Animal Care and Use Committee, and all facilities satisfied the standards published by the American Association for the Accreditation of Laboratory Animal Care. Six healthy adult male dogs (27.4 ± 3.4 kg at baseline) were scanned at two time points: 1) before beginning an obesogenic high-fat, high-fructose diet (week 0) and 2) after 4 weeks on the diet. The week 4 exam included test-retest scans to assess CV. Scans were performed on a 3.0 Tesla Achieva MRI scanner (Philips Healthcare, Best, The Netherlands) running R2.6.3.4 software and using the integrated quadrature body coil for excitation and reception. After an 18 hour fast, the animals were weighed and general anesthesia was immediately induced. The animals were then promptly intubated, ventilated, and transported to the MR scanner. At the MR scanner, the dogs were positioned on the standard MR scanner couch in a supine orientation entering the scanner bore hind limbs first. Following each scanning session the animals were allowed to recover from the anesthesia. Details on the animal study design can be found in previously published work by Coate et al. (7).
FWMRI scans were acquired using a multi-station, multi-slice, multi-echo gradient echo (multiple Fast Field Echo, mFFE) protocol with 12 table positions, 20 axial slices/position, and a slice thickness of 5 mm with zero slice gap. Other protocol parameters were: TR = 150 ms, TE1 = 1.34 ms, TE2 = 2.87 ms, TE3 = 4.40 ms, flip angle = 20°, water-fat shift = 0.251 pixels, BW = 1734 Hz/pixel, axial FOV = 420 mm × 322 mm, acquired matrix size = 232 × 179, and acquired voxel size = 1.8 mm × 1.8 mm × 5 mm. Scan time for each of the 12 table positions was 27.8 seconds. Total scan duration for each dog was 5 minutes 33 seconds. Table positions for the thorax, chest, and abdomen were performed with breath-holding by temporarily deactivating the ventilator.
The reconstruction of the fat and water images was performed offline using a technique developed by Berglund et al. (9), using the multi-peak fat model by Hamilton et al. (10). Volumes of adipose tissue (total, visceral, and subcutaneous), total body lean tissue, and total body cortical bone (TAT, VAT, LT, CB, respectively) were quantified using the following semiautomated approach.
Tissue Volume Segmentation and Quantification Algorithm
- Calculate in-phase (IP) and fat-signal fraction (FSF) image volumes using fat (F) and water (W) image volumes
[1] [2] - Reduce background and low signal effects on FSF
- Separate tissue from background in IP image volume using Fuzzy C-means algorithm with spatial continuity constraint (11)
- Multiply tissue class and FSF image volumes to mask out FSF in background voxels
Define binary total adipose tissue (TAT) image volume as voxels with FSF >= 50% and lean tissue (LT) image volume as voxels with FSF < 50%
-
Segment VAT volume using previously described method (12)
Manually place seeds in TAT image volume for both VAT and non-VAT depots
Algorithm determines boundary between VAT and SAT
Add or remove seeds in 3-plane view
Visually determine if boundary is satisfactory
Repeat 4a – 4d if necessary
- Estimate subcutaneous adipose tissue (SAT) volume as
[3] -
Cortical bone (CB) quantification where CB is defined as low signal regions in the body, not originating from air
CB segmented by Fuzzy C-means cluster at a level of 0.3 (range of 0–1)
Apply 2-D hole filling in axial and coronal planes to close the body and fill holes from both air and CB inside the body
Air inside the body is differentiated from CB using a previously described semiautomated method (12)
- Calculate depot volumes for TAT, LT, VAT, SAT and CB binary images volumes
[4] - Calculate depot masses for TAT, LT, VAT, SAT and CB
[5]
After segmentation, tissue depot volumes were calculated using Eq. [4], and volumes were converted into mass estimates using Eq. [5] and literature values for tissue densities: 0.923 kg/L for adipose, 1.100 kg/L for soft lean, and 1.72 kg/L for cortical bone (13). Once all tissues were segmented, and the calculated volumes converted into masses using the corresponding densities, the TAT, LT and CB masses were summed to form an FWMRI-derived total body mass estimate. The FWMRI-derived masses were compared to the masses measured by a scale.
Results
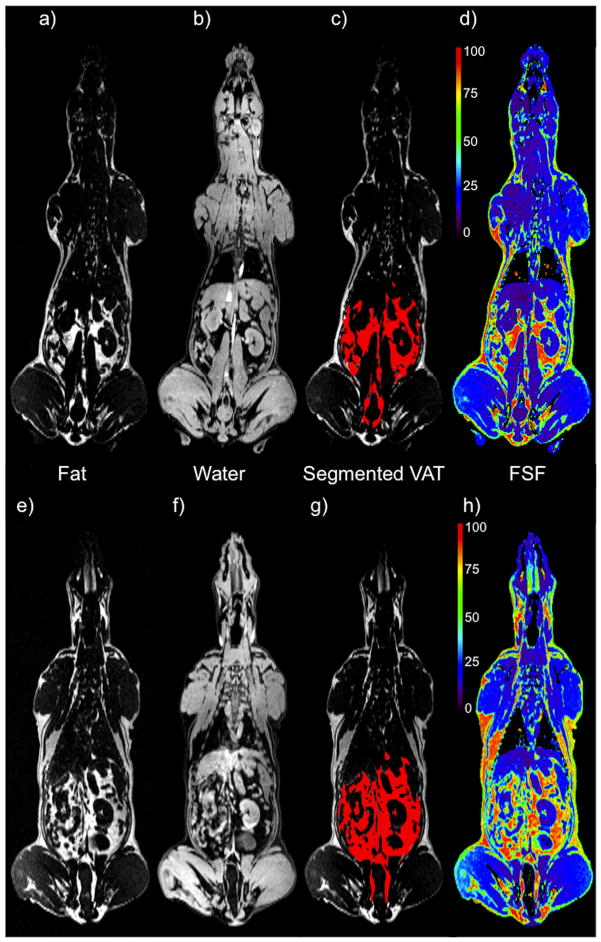
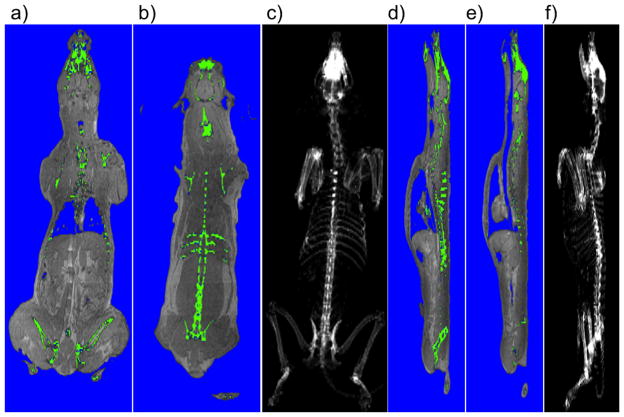
Figure 1 shows the distributions of a, e) fat; b, f) water; c, g) segmented VAT in red; d, h) fat-signal fraction (FSF), with the corresponding colorbar indicating a signal generated by all water (purple) to 100% fat (red). These figures show a mid-body coronal slice derived from the whole body FWMRI scans of the same dog at both week 0 and week 4. Figure 2 demonstrates the effectiveness of the segmentation pipeline in identifying and distinguishing bone and internal air pockets, both of which produce signal voids in the parent FWMRI. Segmented bone (green) and air (blue) voxels are shown as overlays on the FWMRI image. Panels a) and b) of this figure show two coronal slices of the dog in which portions of the skull, and spinal vertebra are visible. Air in the lungs was also successfully segmented, along with an air space in the head. The sagittal slices in panel d) and e) demonstrate the appropriate classification of portions of the trachea as well as intestinal air pockets. Coronal c) and sagittal f) projections of tissue classified as cortical bone by the segmentation pipeline yield excellent reconstructions of the dog’s skeleton.
Figure 1.
A mid-body coronal view of one dog, shown at two time points: week 0 (top row) and week 4 (bottom row). Panels a), b), e) and f) show the fat and water separated components of the FWMRI scans. Panels c) and g) show the segmented VAT overlaid in red on the fat image. Panels d) and h) show the fat-signal fraction map with their corresponding colorbars indicating a signal generated by all water (purple) to 100% fat (red).
Figure 2.
Coronal and Sagittal views of one dog at week 0. Panels a) and b) show two coronal views with segmented bone shown in green and air in blue. The hipbones, portions of the skull, ribs and vertebra are visible. Panel c) shows a coronal projection of the entire skeleton. Panels d) and e) show the segmented bone and air in sagittal images. The trachea is clearly visible descending into the lungs, with portions of the spinal column and hipbones again visible. Panel f) shows the sagittal projection of the entire skeleton. All segmentation of air and bone were calculated from the FWMRI scan.
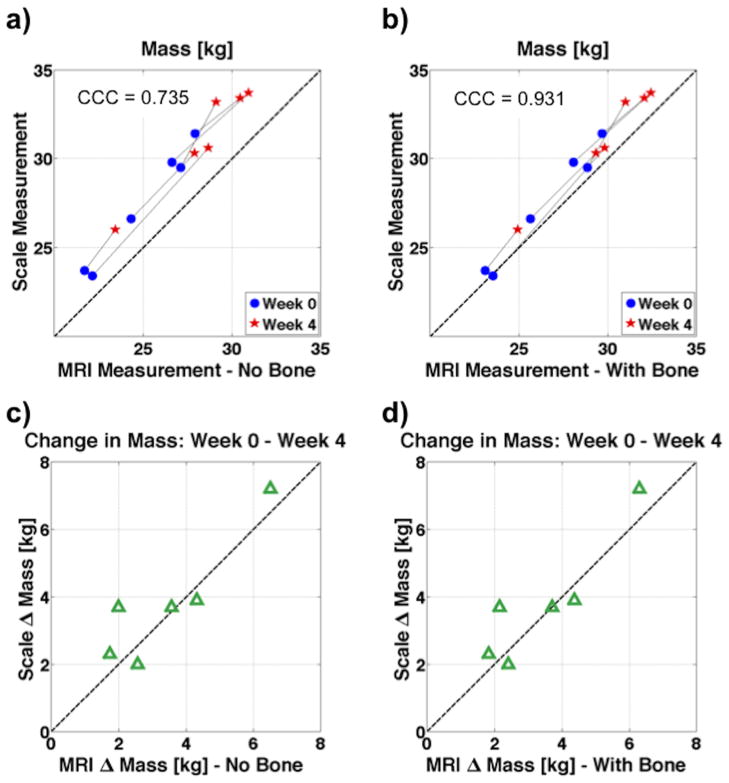
During a few week 4 scans, not all breath holds were performed because of elevated CO2 levels observed with some of the overweight animals. The absence of these breath holds caused noticeable image degradation, but all week 4 acquisitions yielded usable fat-water images and reasonable tissue masses. Furthermore, the semi-automated VAT segmentation was successful for all image volumes. Quantitative changes in adipose and lean tissue masses closely tracked changes in scale weight. The FWMRI-derived masses were calculated without and with CB mass included. Plots showing the correlation of scale mass and FWMRI-derived mass, calculated by summation of the density scaled segmented images, are shown in Figure 3. For clarity in Figure 3 panels a) and b), week 0 and week 4 data points from the same dog are connected with a thin line. Inclusion of bone mass brings the FWMRI-derived masses closer to the line of unity. As seen in panel b), a small but consistent shortfall of the FWMRI-derived total body mass compared with the scale mass remains (week 0: mean 0.97 kg, 1.74 kg in the worst case; week 4: mean 1.27 kg, 2.20 kg in the worst case), suggesting the discrepancy may arise from underestimation of cortical bone mass as well as small pieces of anatomy outside the field of view (see discussion).
Figure 3.
Plots correlating the mass of all six dogs as measured on the scale to MRI derived mass. The MRI derived mass is calculated both without taking bone into account in panels a) and b), as well as with bone in panels c) and d). When bone is included, the MRI mass falls closer to the line of unity, and the concordance correlation coefficient (CCC) increases from 0.735 to 0.931.
The concordance correlation coefficient (CCC) of the change in mass as measured by the scale and FWI-derived mass, including CB data, between week 0 and week 4 is 0.931 with a 95% confidence interval of (0.813 to 0.975), a coefficient of bias (Cb) = 0.94. (Cb = ratio of CCC to Pearson correlation coefficient), and slope and intercept values of 1.12 and −2.23 kg respectively. Without including the CB data in the FWI-derived mass, the CCC = 0.735 with a 95% CI of (0.460 to 0.881), and a Cb = 0.75. One dog from week 4 does not include a retest scan in these calculations because the head was outside the field of view on one of the two scans. To determine the test-retest reproducibility, the week 4 scans with two complete scan repetitions from 5 of 6 dogs were evaluated with a one-way analysis of variance (ANOVA) to determine the CV of TAT, VAT, LT, and CB volumes. The CV of these measurements range from 0.2% to 3.1%. Specifically, the CVs were 0.25%, 1.19%, 0.42%, and 3.08% for TAT, VAT, LT and CB respectively. The CVs for TAT, VAT and LT compare favorably with recently reported CVs of human 3T FWMRI measurements of the same quantities (14,15).
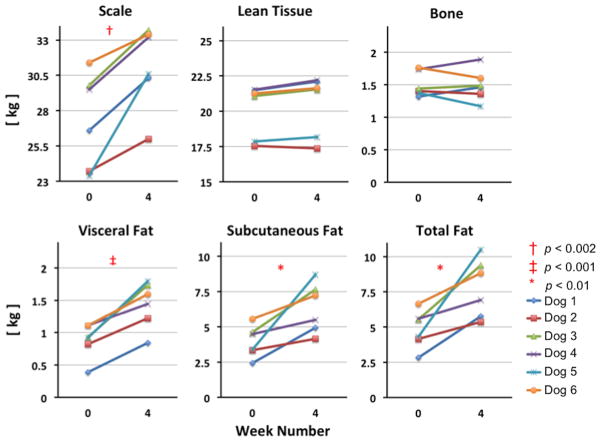
Figures 4 and 5 display the absolute and percentage change from week 0 to week 4 of the scale, LT, TAT, SAT, VAT and CB masses for all six dogs. As was expected following four weeks of free access to the obesogenic diet, all six dogs gained mass from week 0 to week 4 as measured by the scale (14.4%, range 6.4% – 30.8% increase: p < 0.002 by one-tailed paired t-test). This increase reflects a significant gain in AT mass: VAT (mean 70.2%, range 30% – 116%; p < 0.001), SAT (mean 67.0%, range 22% – 157%; p < 0.01) and TAT (mean 67.1%, range 24% – 144%; p < 0.01) all increased from week 0 to week 4 while neither CB nor LT mass changed significantly between week 0 and week 4.
Figure 4.
Plots of the change from week 0 to week 4 in total mass (measured on the scale) as well as tissue masses derived from MRI segmented tissue volumes, and converted to mass using appropriate densities. As expected, the visceral adipose mass, subcutaneous adipose tissue mass, total fat mass and the total mass are all significantly increased at week 4.
Figure 5.
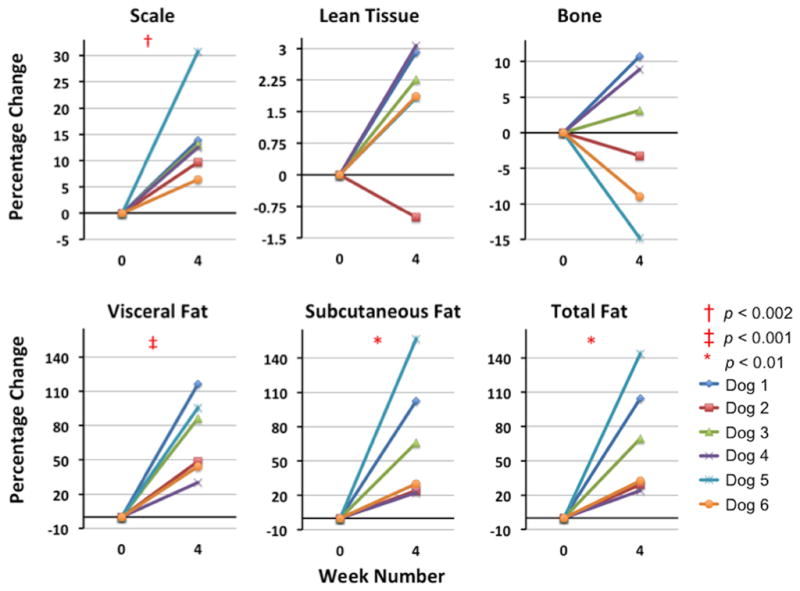
Plots of the percentage change from week 0 to week 4 in total mass (measured on the scale) as well as tissue masses derived from MRI segmented tissue volumes. As expected, the VAT mass, SAT mass, total fat mass and the total mass are all significantly increased at week 4.
Discussion
Our results confirm the utility of fat-water MRI for non-invasive longitudinal studies of the interactions of diet and body composition in a well established, metabolically well characterized, and clinically relevant canine model. We have demonstrated excellent quantitative agreement between FWMRI and scale measures of changes in whole body absolute mass, and the ability to parse these changes in body mass by tissue type. Our analyses further reveal (albeit in a small cohort) significant inter-animal variability in adipose tissue and lean tissue mass changes, as well as in adipose tissue sub-classes, when given free access to an obesogenic diet. Even though LT was not statistically significant, we note that LT mass increased slightly for all but one dog. Given the small cohort this may or may not be relevant. Such variability may contribute significantly to variance in metabolic studies, and the more complete individual characterization of body composition afforded by FWMRI promises to significantly reduce the impact of this potential confound.
While FWMRI accurately quantified absolute changes in scale-measured body mass between week 0 and week 4, the FWMRI-derived estimates of total body mass were slightly and consistently smaller than the scale mass measurements. Several factors may underlie the shortfall in the FWMRI-derived measure. Failure to capture small portions of extremities (nose, tail, paws) lying outside the FWMRI field of view in some dogs may contribute to our observed shortfall. However the excellent agreement between the scale- and FWMRI-derived measures of absolute body mass change in a model where changes in total bone mass are likely to be insignificant, despite large inter-animal variations in the contributions of LT and AT tissue types, suggests that the residual error arises from errors in the determination of total bone mass. We favor this explanation, given both that the lack of information regarding normal canine bone densities in the literature compelled us to use human literature values, and also the presence of bones whose density is greater than that of cortical bone. We also acknowledge the limitation that trabecular bone (TB) was not handled separately. Calculation of bone mass was not part of the original study design, as the data processing approach to estimate CB volume was developed after the completion of data collection, and the lack of a direct measure of bone density does leave the origin of this small residual discrepancy to be confirmed. Future studies will include DEXA measurements to compare with the FWMRI-derived bone mass.
Dogs are well suited for imaging on a 3T human scanner because they benefit from the higher MR sensitivity associated with the higher magnetic field strength (B0), but are less prone to the static field (B0) and RF transmit field (B1) inhomogeneities often associated with large human subjects (16,17). Studies with such animal models typically require longitudinal, non-invasive monitoring, which makes the combined approach of FWMRI and image post-processing a strong candidate for quantitative body composition measurements. Specifically, we have shown FWMRI’s ability to precisely quantify and localize body composition with respect to adipose, lean and bone tissue depots. The described approach also provides a tool with which to examine the role of distinct AT depots, e.g. subcutaneous adipose tissue and visceral adipose tissue, in a useful animal model of metabolic disease. Further extensions of the FWMRI protocol to capture longer echo trains will enable advanced applications in the canine model including quantitative fat fraction and T2* measurements in organs of interest such as the liver and pancreas. FWMRI protocols with very high echo counts may enable molecular characterization of adipose tissue including fatty acid chain length, unsaturation degree and polyunsaturation degree (10,18).
In conclusion, this study demonstrates the potential of whole-body FWMRI acquired on human 3T scanners to quantify body composition in a dog model that closely resembles many aspects of obesity and obesity-associated endocrine and metabolic dysregulation in humans. This provides a powerful new modality for translational research in the area of obesity and metabolic disease.
Acknowledgments
The authors thank John Gore, Director VUIIS, Nashville, TN, United States for scanner development time. Holger Eggers, Philips Research Lab, Hamburg, Germany for scanner reconstruction settings advice. Genie Moore, Amy Nunnally, Erik Nass and Jamie Adcock, Vanderbilt Surgical Research, Nashville, TN, United States for animal preparation and care, and VUIIS MR Technologists Leslie McIntosh, Donna Butler, and David Pennell, for their MR scanning support. This work was supported by National Institutes of Health grant R01-DK18243, Vanderbilt Diabetes Research and Training Center grant DK-020593, and UL1 TR000445 from NCATS/NIH.
References
- 1.Whiting DR, Guariguata L, Weil C, Shaw J. IDF diabetes atlas: global estimates of the prevalence of diabetes for 2011 and 2030. Diabetes Res Clin Pract. 2011;94:311–21. doi: 10.1016/j.diabres.2011.10.029. [DOI] [PubMed] [Google Scholar]
- 2.Eckel RH, Alberti KG, Grundy SM, Zimmet PZ. The metabolic syndrome. Lancet. 2010;375:181–3. doi: 10.1016/S0140-6736(09)61794-3. [DOI] [PubMed] [Google Scholar]
- 3.Kullberg J, Sundbom M, Haenni A, et al. Gastric bypass promotes more lipid mobilization than a similar weight loss induced by low-calorie diet. J Obes. 2011 Dec 21;:959601. doi: 10.1155/2011/959601. [Epub ahead of print] [DOI] [PMC free article] [PubMed] [Google Scholar]
- 4.Börnert P, Keupp J, Eggers H, Aldefeld B. Whole-body 3D water/fat resolved continuously moving table imaging. J Magn Reson Imaging. 2007;25:660–5. doi: 10.1002/jmri.20861. [DOI] [PubMed] [Google Scholar]
- 5.Kullberg J, Johansson L, Ahlström H, et al. Automated assessment of whole-body adipose tissue depots from continuously moving bed MRI: a feasibility study. J Magn Reson Imaging. 2009;30:185–93. doi: 10.1002/jmri.21820. [DOI] [PubMed] [Google Scholar]
- 6.Joshi A, Hu HH, Leahy RM, Goran MI, Nayak KS. Automatic intra-subject registration-based segmentation of abdominal fat from three-dimensional water-fat MRI. J Magn Reson Imaging. 2012 doi: 10.1002/jmri.23813. [Epub ahead of print] [DOI] [PMC free article] [PubMed] [Google Scholar]
- 7.Coate KC, Scott M, Farmer B, et al. Chronic consumption of a high-fat/high-fructose diet renders the liver incapable of net hepatic glucose uptake. Am J Physiol Endocrinol Metab. 2010;299:E887–98. doi: 10.1152/ajpendo.00372.2010. [DOI] [PMC free article] [PubMed] [Google Scholar]
- 8.Ionut V, Liu H, Mooradian V, Castro AVB, Kabir M, Stefanovski D, et al. Novel canine models of obese prediabetes and mild type 2 diabetes. Am J Physiol Endocrinol Metab. 2010;298:E38–48. doi: 10.1152/ajpendo.00466.2009. [DOI] [PMC free article] [PubMed] [Google Scholar]
- 9.Berglund J, Johansson L, Ahlström H, Kullberg J. Three-point Dixon method enables whole-body water and fat imaging of obese subjects. Magn Reson Med. 2010;63:1659–68. doi: 10.1002/mrm.22385. [DOI] [PubMed] [Google Scholar]
- 10.Hamilton G, Yokoo T, Bydder M, et al. In vivo characterization of the liver fat (1)H MR spectrum. NMR Biomed. 2011;24:784–90. doi: 10.1002/nbm.1622. [DOI] [PMC free article] [PubMed] [Google Scholar]
- 11.Liew AW-C, Yan H, Law NF. Image segmentation based on adaptive cluster prototype estimation. IEEE Trans Fuzzy Syst. 2005;13:444–53. [Google Scholar]
- 12.Malmberg F, Lindblad J, Nyström I. Sub-pixel Segmentation with the Image Foresting Transform. In: Wiederhold P, Barneva R, editors. Combinatorial Image Analysis. Berlin: Springer; 2009. pp. 201–211. [Google Scholar]
- 13.Chowdhury B, Sjöström L, Alpsten M, Kostanty J, Kvist H, Löfgren R. A multicompartment body composition technique based on computerized tomography. Int J Obes Relat Metab Disord. 1994;18:219–34. [PubMed] [Google Scholar]
- 14.Silver HJ, Niswender KD, Kullberg J, et al. Comparison of Gross Body Fat-Water Magnetic Resonance Imaging at 3 Tesla to Dual-Energy X-Ray Absorptiometry in Obese Women. Obesity (Silver Spring) 2012 Jun 15; doi: 10.1038/oby.2012.147. [Epub ahead of print] [DOI] [PMC free article] [PubMed] [Google Scholar]
- 15.Ishioka K, Okumura M, Sagawa M, Nakadomo F, Kimura K, Saito M. Computed tomographic assessment of body fat in beagles. Vet Radiol Ultrasound. 2005;46:49–53. doi: 10.1111/j.1740-8261.2005.00009.x. [DOI] [PubMed] [Google Scholar]
- 16.Dietrich O, Reiser MF, Schoenberg SO. Artifacts in 3-T MRI: physical background and reduction strategies. Eur J Radiol. 2008;65:29–35. doi: 10.1016/j.ejrad.2007.11.005. [DOI] [PubMed] [Google Scholar]
- 17.Soher BJ, Dale BM, Merkle EM. A review of MR physics: 3T versus 1.5T. Magn Reson Imaging Clin N Am. 2007;15:277–90. v. doi: 10.1016/j.mric.2007.06.002. [DOI] [PubMed] [Google Scholar]
- 18.Berglund J, Ahlström H, Kullberg J. Model-based mapping of fat unsaturation and chain length by chemical shift imaging-phantom validation and in vivo feasibility. Magn Reson Med. 2012 Feb 14; doi: 10.1002/mrm.24196. [Epub ahead of print] [DOI] [PubMed] [Google Scholar]


