

Abstract
Excitotoxicity is thought to be important in the pathogenesis of Huntington’s disease (HD). Glutamate is the predominant excitatory neurotransmitter in the brain and excess activation of glutamate receptors can cause neuronal dysfunction and death. Glutamate transporters regulate the extracellular concentration of glutamate. GLT-1 is the most abundant known glutamate transporter and accounts for most of the glutamate transport in the brain. Administration of ceftriaxone, an antibiotic that increases the functional expression of GLT-1, can improve the behavioral phenotype of the R6/2 mouse model of HD. To test the hypothesis that GLT-1 expression critically affects the HD disease process, we generated a novel mouse model that is heterozygous for the null allele of GLT-1 and carries the R6/2 transgene (double mutation). We demonstrated that the protein expression of total GLT-1, as well as two of its isoforms, are decreased within the cortex and striatum of 12-week-old R6/2 mice and that the expression of EAAC1 was decreased in the striatum. Protein expression of GLT-1 was further decreased in the cortex and striatum of the double mutation mice compared to the R6/2 mice at 11 weeks of age. However, the effects of the R6/2 transgene on weight loss, accelerating rotarod, climbing and paw-clasping were not exacerbated in these double mutants. Na+-dependent glutamate uptake into synapatosomes isolated from the striatum and cortex of 11-week-old R6/2 mice was unchanged compared to controls. These results suggest that changes in GLT-1 expression or function per se are unlikely to potentiate or ameliorate the progression of HD.
Keywords: Glutamate transporter, R6/2, synaptosomes, Na+-dependent glutamate uptake, EM-ICC
Introduction
Huntington’s disease (HD) is a neurodegenerative disorder characterized by the loss of efferent medium spiny neurons in the caudate nucleus and putamen and, to a lesser extent, other neurons within the basal ganglia (Vonsattel et al., 1985). HD is caused by an expansion of a CAG trinucleotide repeat in exon 1 of the HD gene, which codes for a mutated huntingtin protein (The Huntington’s Disease Collaborative Research Group, (1993).
It has been suggested that excitotoxicity, affecting especially neurons with high NMDAR expression such as medium spiny neurons, is important in the pathogenesis of HD (Beal et al., 1991; Yanai et al., 2006). Acute exposure of neurons to excitatory amino acids such as glutamate leads to neurodegeneration (Lipton & Rosenberg, 1994). The striatum receives a large glutamatergic input from corticostriatal afferents and is at risk for excitotoxic injury.
Glutamate is the predominant excitatory neurotransmitter in the mammalian CNS. Extracellular levels of glutamate are maintained at relatively low levels to prevent inappropriate activation of glutamate receptors, in particular high-affinity NMDA receptors (Herman & Jahr, 2007). There is no evidence for the extracellular metabolism of glutamate, and it is thought to be cleared from the extracellular space primarily by Na+-dependent glutamate transporters. The critical role of glutamate transport in protecting neurons from the toxicity of extracellular glutamate has been demonstrated in vivo and in tissue culture (Rosenberg & Aizenman, 1989; Rosenberg et al., 1992; Robinson et al., 1993; Lipton & Rosenberg, 1994; Rothstein et al., 1996; Mitani & Tanaka, 2003; Brustovetsky et al., 2004).
Five glutamate transporters [GLAST (EAAT1), GLT-1 (EAAT2), EAAC1 (EAAT3), EAAT4 and EAAT5] have been identified to date (Danbolt, 2001). GLT-1 is responsible for most (>90%) of the glutamate transporter activity in the forebrain (Danbolt et al., 1992; Haugeto et al., 1996; Tanaka et al., 1997; Matsugami et al., 2006). There is a decrease in GLT-1 mRNA and glutamate uptake in HD patients post-mortem (Arzberger et al., 1997; Hassel et al., 2008). In various mouse models of HD GLT-1 is down-regulated and a decrease in glutamate uptake is observed (Lievens et al., 2001; Behrens et al., 2002; Shin et al., 2005; Miller et al., 2008; Estrada-Sanchez et al., 2009). It has been reported that ceftriaxone, a β-lactam antibiotic, known to increase the functional expression of GLT-1, can reverse the observed deficit in glutamate uptake in the R6/2 transgenic mouse model of HD (Miller et al., 2008) and provide therapeutic benefit.
In this study we examined the protein expression of various glutamate transporters in the R6/2 mice, a transgenic model of HD. We generated a novel mouse model that is heterozygous for a null allele of GLT-1 and carries the R6/2 transgene to determine if a substantial (50%) loss of GLT-1 expression would exacerbate the HD behavioral phenotype in the R6/2 transgenic mice. Finally, we measured the Na+-dependent glutamate uptake into synaptosomes isolated from the cortex and striatum of age-matched R6/2 mice and littermates, in order to determine if loss of function of GLT-1 could be demonstrated in the R6/2 mice.
Materials and methods
Animals
A colony was maintained by breeding ovarian transplant R6/2 females (B6CBA-Tg(HDexon1)62Gpb/1J) obtained from The Jackson Laboratories (Bar Harbor, ME, USA) with either B6CBAF1/J males or males, based on a C57BL/6 background, that were heterozygous for GLT-1 (Tanaka et al., 1997). F1 offspring of the first mating generated mice with either the WT or R6/2 genotype. F1 offspring of the second mating generated a total of 51 animals with the following genotypes, GLT-1+/+ (wild-type), GLT-1+/− (heterozygous GLT-1), R6/2; GLT-1+/+ (HD) and R6/2; GLT-1+/− (HD and heterozygous for GLT-1). Mice were housed under standard conditions (12-h light cycle from 7:00AM to 7:00PM) with ad libitum access to food and water. All experiments were performed in accordance with NIH guidelines and were approved by the Children’s Hospital Boston Institutional Animal Care and Use Committee.
Genotype and CAG repeat length
Genomic DNA was extracted from tail tissue samples in 280μl of DirectPCR Lysis Reagent (Viagen Biotech) and 0.4 mg of proteinase K (Viagen Biotech) at 55°C overnight. Samples were then heated at 85 °C for 45 min with gentle shaking and stored at 4 °C. PCR and agarose gel electrophoresis were used to determine presence of the GLT-1 knockout gene, R6/2 transgene and CAG repeat length. To amplify the R6/2 transgene and determine the CAG repeat length the forward primer was 5′-CCG CTC AGG TTC TGC TTT TA-3′ and reverse primer was 5′-GGC TGA GGA AGC TGA GGA G-3′. Each 20 μl PCR reaction consisted of 2.0 μl DNA template, 0.5 μM each primer, 0.2mM dNTPs, 1x Q-solution (Qiagen), 1x PCR Buffer (Qiagen) and 2 units of HotStarTaq Plus DNA Polymerase (Qiagen). Cycling conditions were 95 °C for 5 min followed by 35 cycles of 94 °C for 30 s, 58 °C for 30 s, 72 °C for 60 s with a final extension at 72 °C for 10 min. Gel electrophoresis of samples was performed in 2% agarose with 1x Tris-acetate-EDTA containing 0.25 mg/L ethidium bromide as running buffer. Gels were run at 5 V/cm for 60 min. The positive control was DNA from B6CBA-Tg(HDexon1)62Gpb/1J from The Jackson Laboratories that is known to have 169±1 CAG repeats. Analysis of fragment distance migration against the positive control demonstrated that the R6/2 transgene in mice used for our experiments had 169±1 CAG repeats. To genotype for the presence of the GLT-1 knockout gene the forward primer was 5′-TTC GGC TAT GAC TGG GCA CAA CAG -3′ and reverse primer was 5′-TAC TTT CTC GGC AGG AGC AAG GTG-3′. Each 20 μl PCR reaction consisted of 2.0 μl DNA template, 0.5 μM each primer, 0.2mM dNTPs, 1x Phire reaction buffer (New England BioLabs, Inc., Ipswich, MA, USA) and Phire Hot Start DNA polymerase (New England BioLabs, Inc., Ipswich, MA, USA). Cycling conditions were 98 °C for 3 min followed by 35 cycles of 98 °C for 5 s, 63 °C for 5 s, 72 °C for 20 s with a final extension at 72 °C for 1 min. Gel electrophoresis of samples was performed in 2% agarose.
Western Blot
Mice were euthanized using CO2, brains were removed, and the striatum and cortex from both hemispheres was dissected and frozen for immunoblotting. Brain tissue was homogenized in ice-cold T-PER Tissue Protein Extraction Reagent (ThermoScientific, Rockford, IL, USA) containing Complete, Mini Protease Inhibitor Cocktail Tablets (Roche Applied Science, Indianapolis, IN, USA) following a previously published procedure (Rakhade & Loeb, 2008). The tissue mixture was centrifuged at 13,000 r.p.m. for 10 min at 4 °C. The supernatant was collected and protein levels were quantified using the Bio-Rad DC protein assay (Bio-Rad Laboratories, Inc, Hercules, CA, USA). Twenty μg of protein from each sample was mixed with 0.775% DTT, 0.005 % Bromophenol blue, 0.3% SDS, 125 mM trisHCl (pH 6.8) and 10% glycerol at 4 °C and subjected to SDS-PAGE 4%-20% acrylamide and transferred to Immun-Blot® PVDF membrane (Bio-Rad Laboratories, Inc, Hercules, CA, USA). Membranes were stained with Ponceau S solution (Boston Bioproducts, Ashland, MA, USA) to visualize protein. Membranes were incubated for 1 h at room temperature in 5% milk in TBST [Tris-buffered saline (pH7.4) with 0.1% Triton-X]. Membranes were then incubated overnight at 4 °C with one of the following primary antibodies diluted in 5% milk in TBST: rabbit anti-nGLT-1 antibody (Chen et al., 2002) diluted at 1:500; guinea-pig anti-GLT-1a antibody (Millipore, Billerica, MA, USA) diluted at 1:5000; rabbit anti-GLT-1b antibody (Chen et al., 2002) diluted at 1:1000; rabbit anti-EAAC1 antibody (Santa Cruz Biotechnology, Inc., Santa Cruz, CA, USA) diluted at 1:5000 or rabbit anti-GLAST (Santa Cruz Biotechnology, Inc., Santa Cruz, CA, USA Santa Cruz) antibody diluted at 1:200. Membranes were washed three times, each for 5 min, and then incubated for 1 hr at room temperature with horseradish peroxidase coupled secondary antibody [rabbit and mouse at 1:10,000 (Bio-Rad Laboratories, Inc, Hercules, CA, USA); guinea-pig at 1:1000 (Abcam)] diluted with 5% milk in TBST. Membranes were washed three times, each for 5 min and then incubated with SuperSignal West Pico Chemiluminescent Substrate (ThermoScientific, Rockford, IL, USA) for 5 min. The membranes were exposed to Hyblot CL autoradiography Film (Denville Scientific, Inc., Metuchen, NJ, USA) and films were developed with a Kodak 2000 processor. Membranes were then re-probed with chicken anti-β-tubulin antibody (Millipore, Billerica, MA, USA) diluted at 1:10,000 to access for equivalent protein loading. Immunoblots were scanned and digitized using ImageJ software to obtain the optical density of the bands.
Behavioral Assessments
All behavioral assessments were performed after a 10 min habituation to the testing room. Assessments were coded by an independent observer who was blind to mouse genotype.
Body weight
Mice were weighed once a week from 3 to 11 weeks of age.
Accelerating rotarod
The Economex Rotarod apparatus (Columbus Instruments, Columbus, OH, USA) was used to measure motor coordination and balance. Mice were trained on the rotarod apparatus for two consecutive days to teach them the task and to habituate them to handling. Weekly testing began on the third day and included a 10 s acclimation period at a constant rotation of 4 rpm followed by an accelerating speed (4–34 rpm) for 5 min. Mice were given 4 trials separated by a 5-min inter-trial interval. The latency to fall from the rod was recorded. Mice remaining on the rod for more than 300 s were removed and their time scored as 300 s (Hickey et al., 2005).
Climbing
Mice were placed under a wire cylinder (diameter - 10.5 cm, height - 15.5 cm, open at the bottom) for 5 min and video-recorded. The latency to climb, the number of climbing events and the total time spent climbing were counted. Climbing was defined when all four paws of the mouse were off the floor of the testing bench and on the wall of the climbing cage (Hickey et al., 2005).
Paw-clasping
Mice were suspended by the tail for 30 s to elicit the clasping phenotype, which was scored on a scale from 0–4, where 0 represented no clasping, 1 represented one forepaw clasping, 2 represented both forepaws and one hind paw clasping and 4 represented all paws clasping (Hickey et al., 2005).
Electron Microscopic Immunocytochemistry on Tissue Sections
Wild-type and R6/2 mice at 4 and 10 weeks of age were anesthetized deeply, using Nembutal (50 mg/kg), then transcardially perfused with 4% paraformaldehyde combined with glutaraldehyde (0.1%) and buffered using 0.1 M phosphate (PB). Brains were sectioned at a thickness of 40 μm using a vibratome. Sections were treated for 30 min with 1% sodium borohydride/PB, to terminate the cross-linking actions of the aldehydes, then rinsed repeatedly using 0.1 M PB, and stored in 0.01 M PB containing 0.9% sodium chloride (saline) (PBS) and 0.05% sodium azide. Peroxidase-based labeling followed the procedure of Hsu et al. (1981), using the ABC Elite kit (Vector Laboratories) and 0.02% of DAB (Sigma- Aldrich) and 0.03% of hydrogen peroxide (Sigma) as substrates. Primary antisera were diluted 1:500 for anti-cGLT-1a (710 ng/ml). Vibratome sections were incubated overnight at room temperature or at 4°C. The pre-embedding silver-intensified colloidal gold (SIG) procedure was done as described previously (Chan et al., 1990), using the GLT-1a antibody, a polyclonal antibody against the C terminus of GLT-1a protein based on the published sequence (amino acid 559–573 of GLT-1) which was generously provided by Dr. J. Rothstein (Johns Hopkins University) and has been previously characterized with respect to its specificity and localization in brain (Rothstein et al., 1994). Other immuno-reagents that we purchased were biotinylated secondary antibodies directed against rabbit IgGs, 1.4 nm colloidal gold-conjugated anti-biotin IgG (Goldmark, Phillipsburg, NJ) and a silver-intensification kit (IntensEM; Amersham Biosciences, Arlington Heights, IL).
Tissue processing for electron microscopy was done as previously described (Chan et al., 1990), using EMBED812 (Electron Microscopy Sciences, Fort Washington, PA) as the embedding medium. Fixation with osmium tetroxide also was omitted, to minimize loss of SIG. In lieu of osmium tetroxide, ultrastructural preservation and visualization of membranes was achieved by the osmium-free procedure developed by (Phend et al., 1995) and (Matsubara et al., 1996). In brief, 40-μm-thick sections were post-fixed and counterstained with a series of solutions, consisting of the following: tannic acid, uranyl acetate, iridium tetrabromide, and para-phenylenediamine-HCl, each made in a maleate buffer. These sections were infiltrated with Epon, flat-embedded between two sheets of Aclar plastic, then capsule-embedded for ultrathin sectioning. Ultrathin sections were collected serially onto Formvar-coated grids (200 or 400 mesh, thin bars). These ultrathin sections were counterstained minimally with lead citrate (30 sec, using Reynold’s lead citrate), to facilitate identification of processes and synapses without loss of SIG particles. The ultrathin sections were viewed using JEOL’s 1200XL. Profiles were identified as synapses, based on the clustering of vesicles within the terminal, the parallel alignment of the plasma membranes of the axon terminal and the immediately adjacent dendritic spine, and the presence of a thick postsynaptic density along the intracellular surface of the spine membrane facing the axon terminal.
Sampling of synapses was performed strictly in the order that they were encountered, so as to ensure randomness, from the tissue-resin interface, where penetration by immunoreagents could be expected to be optimal. These profiles were stored digitally, using the AMT software and Hamamatsu’s CCD camera.
Synaptosomal Glutamate Uptake
Mice were anesthetized using ether, brains were removed, and the forebrain or striatum and cortex from both hemispheres was dissected, weighed and homogenized in 20x ice-cold 0.32M sucrose. Samples were centrifuged at 800g for 10 minutes at 4 °C. The supernatant was poured into a fresh tube and centrifuged at 20,000 g for 20 minutes at 4 °C. The pellet was then resuspended in 40x ice-cold 0.32 M sucrose and centrifuged at 20,000 g for 20 minutes at 4 °C. The washed pellet was then resuspended in 50x ice-cold 0.32 M sucrose by homogenization. The isolated crude synaptosomes were kept on ice and used immediately. Glass tubes containing 450 μl of buffer [(in mM): 140 NaCl or 140 choline chloride, 2.5 KCl, 1.2 CaCl2, 1.2 MgCl2, 1.2 K2HPO4, 10 glucose, 5 Tris base, and 10 HEPES] containing glutamate [0.5 μM L-glutamate and 0.022 μM [3H]-L-glutamate (PerkinElmer, Boston, MA, USA)] were preincubated for 5 min at 37°C. Glutamate uptake into synaptosomes was initiated by adding 50 μl of crude synaptosomes to each tube and incubating at 37°C for 30 seconds. To stop glutamate uptake, 2 ml of ice-cold choline buffer was added to the tube, vortexed and plunged into an ice-water slurry. The samples were filtered through Whatman GF/C filter paper pre-wetted with choline buffer and then the filters were washed three times with 2 ml choline buffer. Radioactivity on the filters was measured by liquid scintillation counting (TRI-CARB 2200CA, ΔPACKARD, Long Island Scientific, Inc.). The radioactivity taken up by the synaptosomes in the absence of sodium was subtracted from that taken up in the presence of sodium to isolate Na+-dependent transport. L-glutamate concentrations for the saturation analysis were: 2.5, 5, 10, 25, 50 and 100 μM.
Statistical Analysis
GraphPad Prism v4.0c software was used for statistical analysis. Group data were calculated as mean±S.E.M. One-way analysis of variance (ANOVA) was used to analyze the protein expression of the various glutamate transporters in the striatum and cortex. Two-way ANOVA and Bonferroni’s post hoc test was used to analyze the total body weight, latency to fall, clasping score, latency to climb, number of climbing events and total climbing time between genotype and age of mice. Unpaired t-test was performed to compare the frequency of encounter with axon terminals immunoreactive for GLT-1a across the striatum of WT and R2/6 mice.
Results
Expression of glutamate transporters in the cortex and striatum
Previous studies have demonstrated a decrease in GLT-1 expression in HD, but none has focused on the individual variant forms of GLT-1. Immunoblot analysis using antibodies against the n/c-termini of GLT-1 was performed and as previously reported (Haugeto et al., 1996), we saw a predominant immunoreactive band at approximately 75 kDa, and other immunoreactive bands at higher molecular masses. These bands were quantified separately and there was no evidence that they responded differently to the presence of the mutant huntingtin protein. Thus, within each fraction, the optical densities of both the monomer and multimer bands were summed and used to quantitate GLT-1 immunoreactivity. Immunoblot analysis using an antibody against the n-terminus of GLT-1 demonstrated that the expression of total GLT-1 is decreased in the cortex (Figure 1B; n=3; P<0.01) and striatum (Figure 2B; n=3; P<0.01) of 12 week-old R6/2 mice when compared the age-matched wild-type littermate controls. Using antibodies against the c-terminus of GLT-1, that are specific for the GLT-1a and GLT-1b splice variants (Danbolt, 2001; a; Chen et al., 2002; Lee & Pow, 2010), immunoblot analysis demonstrated that GLT-1a and GLT-1b were both significantly decreased in the cortex (Figure 1B; n=3; P<0.05 and P<0.05, respectively) and striatum (Figure 2B; n=3; P<0.01 and P<0.05 respectively) of 12 week-old R6/2 mice. The protein expression of the neuronal specific glutamate transporter, EAAC1 was unchanged in the cortex (Figure 1B; n=3) and significantly decreased in the striatum (Figure 2B; n=3; P<0.05) of 12 week old R6/2 mice when compared to wild-type littermates. The protein expression of the astrocytic specific glutamate transporter, GLAST was unchanged in the cortex and striatum of age-matched mice. As expected, there was a decrease in GLT-1[(total GLT-1 [67% (cortex); 59% (striatum; P<0.001) of wild-type], GLT-1a [64% (cortex; P<0.01); 59% (striatum; P<0.05) of wild-type] and GLT-1b [60% (cortex; P<0.01);53% (striatum; P<0.05) of wild-type] isoforms] expression in the cortex and striatum of animals that were heterozygous for the GLT-1 knockout gene (Figure 3B and 4B; n=3). Mice, at 11 weeks of age, that were heterozygous for GLT-1 knockout gene and expressed the R6/2 transgene had a further decrease in the expression of total GLT-1 (15% of wild-type levels in R6/2; GLT-1+/−; P<0.001compared to 50% in R6/2; P<0.01) as well as two of its isoforms [GLT-1a (28% in R6/2; GLT-1+/−; P<0.001 compared to 70% in R6/2; P<0.05) and GLT-1b (22% in R6/2; GLT-1+/−; P<0.001 compared to 54% R6/2; P<0.001)] in the cortex (Figure 3; n=3). In the striatum of these double mutant mice, a significant further decrease in total GLT-1 (38% in R6/2; GLT-1+/−;P<0.001 compared to 78 % in R6/2; P<0.05) and GLT-1a (36% in R6/2; GLT-1+/−; P<0.001 compared to 84% in R6/2) was detected, while the protein levels of GLT-1b (43% in R6/2; GLT-1+/−; P<0.01 compared to 66% in R6/2; P<0.05) demonstrated trends towards a further decrease (Figure 4; n=3). The astrocytic specific glutamate transporter, GLAST, was significantly increased in the cortex of mice that were heterozygous for the GLT-1 knockout gene when compared to their age-matched littermates (Figure 3; n=3;P<0.05).
Figure 1. Immunoblot analysis of protein expression of glutamate transporters reveals that GLT-1 was significantly decreased in the cortex of 12 week-old R6/2 mice compared to age-matched WT mice.
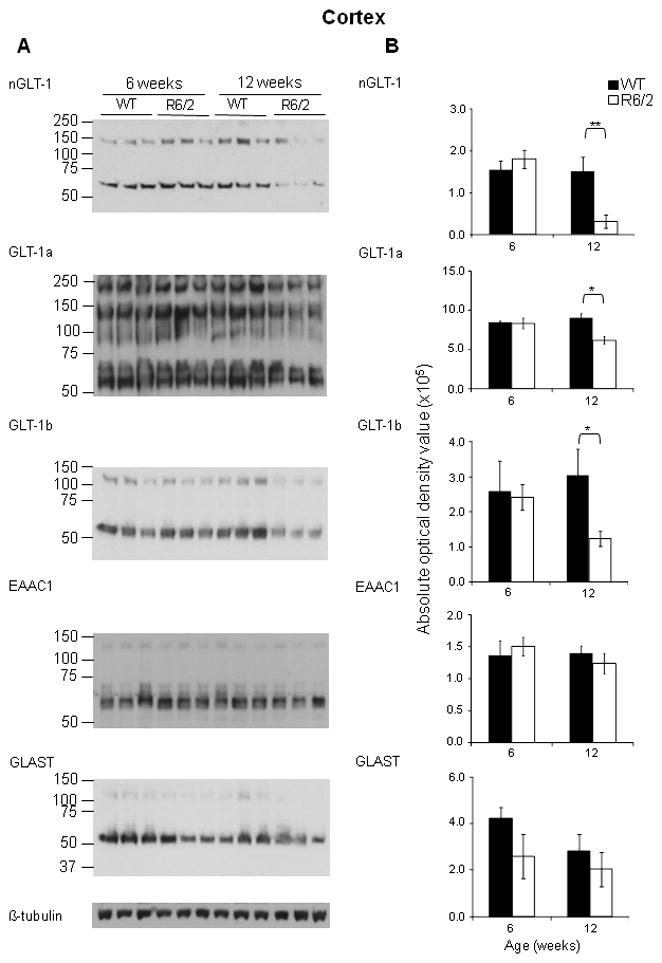
A - Immunoblot analysis using nGLT-1, GLT-1a, GLT-1b, EAAC1, GLAST and β-tubulin antibodies on lysates from the cortex of 12 week old WT and R6/2 mice; GLT-1+/− mice. B – Quantification of the protein expression of total GLT-1, GLT-1a, GLT-1b, EAAC1 and GLAST expression in the cortex of 6 and 12 week-old WT and R6/2 mice. Histograms showing the average absolute optical density, indicative of protein expression of total GLT-1, GLT-1a, GLT-1b, EAAC1 and GLAST in the cortex of three 12 week old WT (solid black) and R6/2 mice (solid white). *P< 0.05, **P <0.01 (One-way ANOVA followed by Bonferroni’s post hoc test); ±SD; n=3.
Figure 2. Immunoblot analysis of protein expression of glutamate transporters reveals that GLT-1 and EAAC1 were significantly decreased in the striatum of 12 week-old R6/2 mice compared to WT mice.
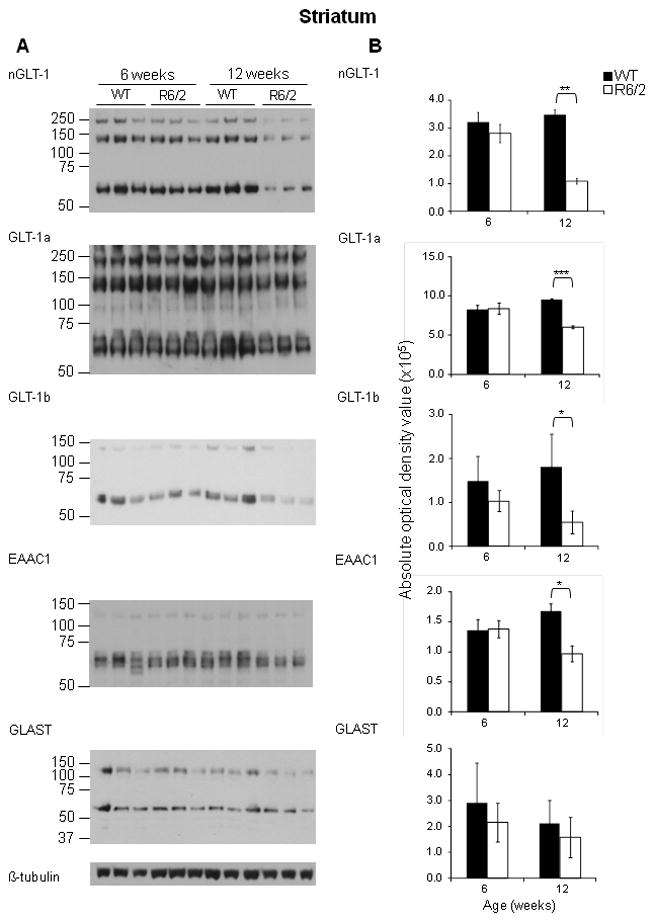
A - Immunoblot analysis using nGLT-1, GLT-1a, GLT-1b, EAAC1, GLAST and β-tubulin antibodies on lysates from the striatum of 12 week old WT and R6/2 mice; GLT-1+/− mice. B – Quantification of the protein expression of total GLT-1, GLT-1a, GLT-1b, EAAC1 and GLAST expression in the striatum of 6 and 12 week-old WT and R6/2 mice. Histograms showing the average absolute optical density, indicative of protein expression of total GLT-1, GLT-1a, GLT-1b, EAAC1 and GLAST in the cortex of three 12 week old WT (solid black) and R6/2 mice (solid white). *P< 0.05, **P < 0.01 (One-way ANOVA followed by Bonferroni’s post hoc test); ±SD; n=3.
Figure 3. Immunoblot analysis of protein expression of glutamate transporters reveals that GLT-1 was significantly decreased in the cortex of 11 week-old R6/2; GLT-1+/− mice compared to age-matched R6/2; GLT-1+/+ mice.
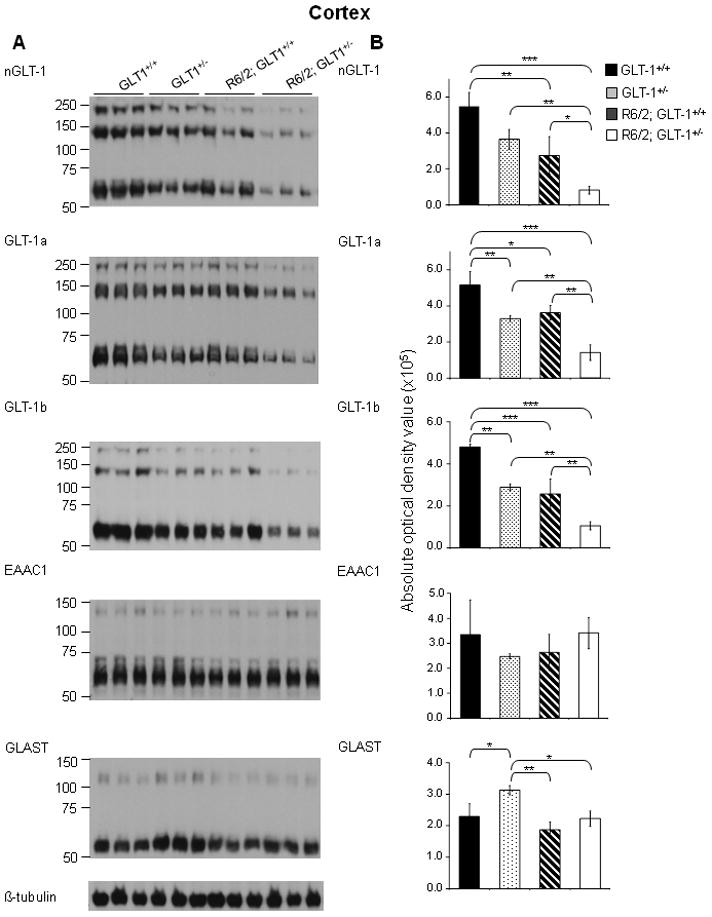
A - Immunoblot analysis using nGLT-1, GLT-1a, GLT-1b, EAAC1, GLAST and β-tubulin antibodies on lysates from the cortex of 11 week old GLT-1+/+, GLT-1+/−, R6/2; GLT-1+/+ and R6/2; GLT-1+/− mice. B – Quantification of the protein expression of total GLT-1, GLT-1a, GLT-1b, EAAC1 and GLAST expression in the cortex of GLT-1+/+, GLT-1+/−, R6/2; GLT-1+/+ and R6/2; GLT-1+/− mice. Histograms showing the average absolute optical density, indicative of protein expression of total GLT-1, GLT-1a, GLT-1b, EAAC1 and GLAST in the cortex of three 11 week old GLT-1+/+ (solid black), GLT-1+/−(spotted), R6/2; GLT-1+/+(striped) and R6/2; GLT-1+/− mice (solid white). *P< 0.05, **P <0.01, ***P < 0.001 (One-way ANOVA followed by Bonferroni’s post hoc test); ±SD; n=3.
Figure 4. Immunoblot analysis of protein expression of glutamate transporters reveals that GLT-1 and EAAC1 was significantly decreased in the striatum of 11 week-old R6/2; GLT-1+/− mice compared to age-matched R6/2; GLT-1+/+ mice.
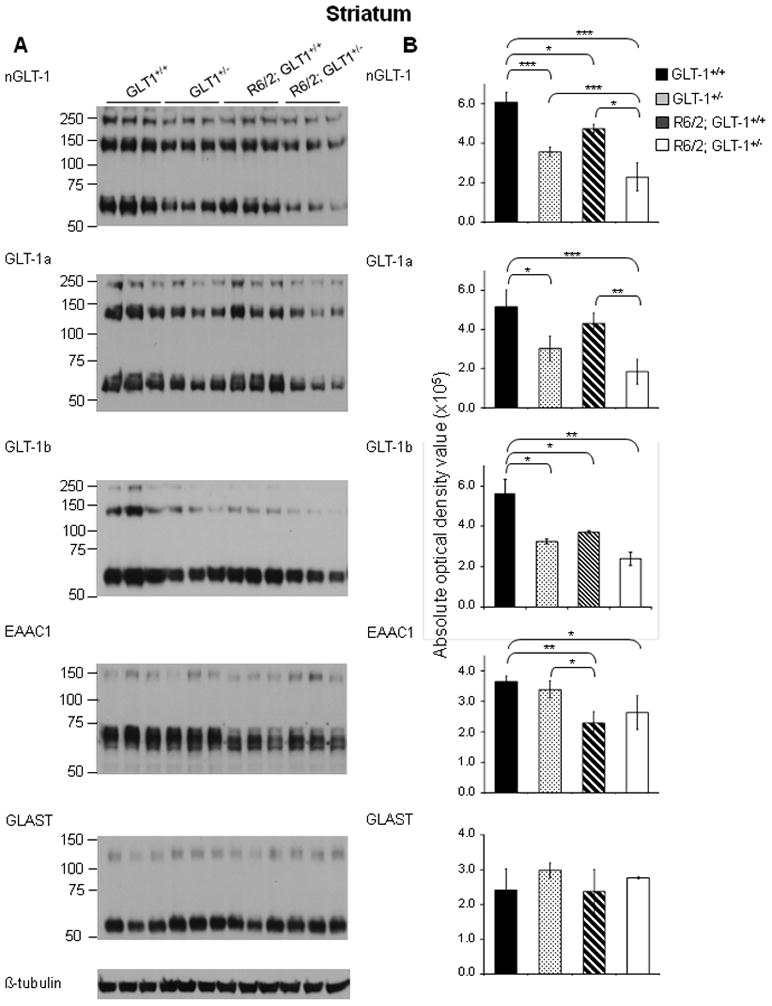
A - Immunoblot analysis using nGLT-1, GLT-1a, GLT-1b, EAAC1, GLAST and β-tubulin antibodies on lysates from the striatum of 11 week old GLT-1+/+, GLT-1+/−, R6/2; GLT-1+/+ and R6/2; GLT-1+/− mice. B Quantification of the protein expression of total GLT-1, GLT-1a, GLT-1b, EAAC1 and GLAST expression in the striatum of GLT-1+/+, GLT-1+/−, R6/2; GLT-1+/+ and R6/2; GLT-1+/− mice. Histograms showing the average absolute optical density, indicative of protein expression of total GLT-1, GLT-1a, GLT-1b, EAAC1 and GLAST in the striatum of three 11 week old GLT-1+/+ (solid black), GLT-1+/− (spotted), R6/2; GLT-1+/+(striped) and R6/2; GLT-1+/− mice (solid white). *P< 0.05, **P <0.01, ***P < 0.001 (One-way ANOVA followed by Bonferroni’s post hoc test); ±SD; n=3.
Body weight
Littermate mice that did not carry the R6/2 transgene, had a steady increase in body weight from 3 to 11 weeks of age (Figure 5A; n=11–16). Mice that carried the R6/2 transgene had an increase in body weight from 3 to 6 weeks for age. From 6 to 9 weeks of age, they maintained their body weight and then from 10 weeks of age onwards, there was a significant decrease in body weight in comparison to wild-type mice and GLT-1+/− mice (n=11–16; P<0.05).
Figure 5. Behavioral analysis demonstrated no significant differences between the R6/2; GLT-1+/+ mice and the R6/2; GLT-1+/− mice.
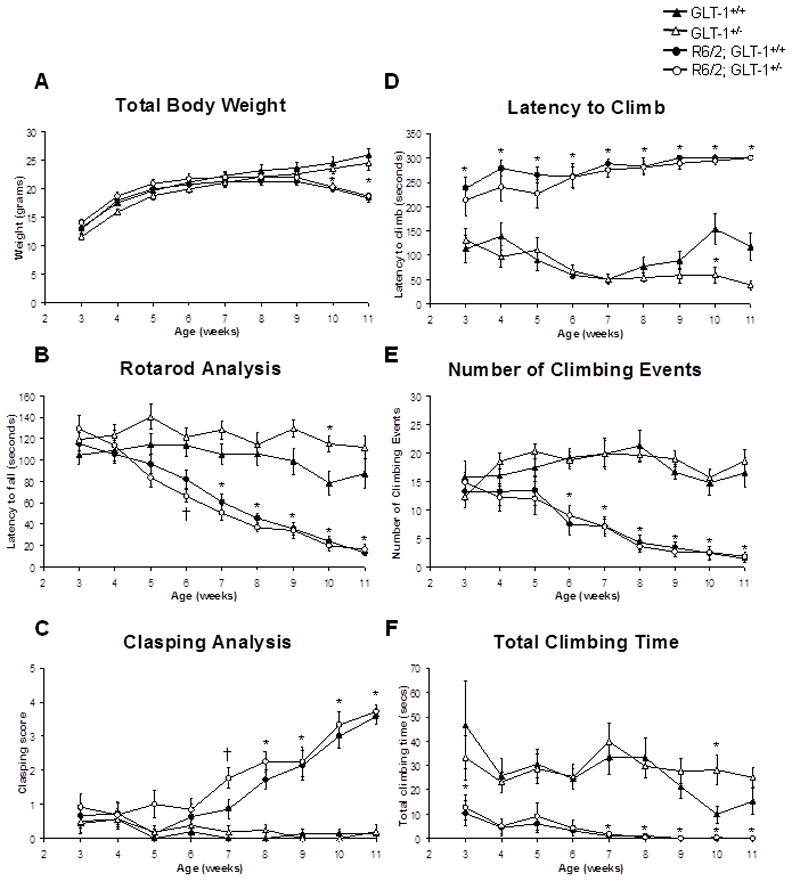
Total body weight (A), latency to fall (B), clasping score (C), latency to climb (D), number of climbing events (E) and total climbing time (F) were recorded from the GLT-1+/+ (closed triangles), GLT-1+/− (open triangles), R6/2; GLT-1+/+ (closed circles) and R6/2; GLT-1+/− (open circles) mice from 3- 11 week of age. *P<0.05, Both R6/2 and R6/2; GLT-1+/− significantly different from GLT-1+/+ (*). †P<0.05, only R6/2; GLT-1+/− significantly different from GLT-1+/+ (†). (Two-way ANOVA followed by Bonferroni’s post hoc test); ±SEM; n=11–16
Rotarod Analysis
From 6 weeks of age onwards, the R6/2; GLT-1+/− mice had a significant decrease in the latency to fall from an accelerating rod when compared to age-matched wild-type and GLT-1+/− animals (Figure 5B; n=11–16; P<0.05). A significant decrease in the latency to fall from an accelerating rotarod was only observed a week later, from 7 weeks of age onwards in the R6/2; GLT-1+/+ animals (n=11–16; P<0.05).
Clasping Phenotype
Similar results were also observed in the clasping analysis where there was a significant difference between the R6/2; GLT-1+/− animals and the R6/2; GLT+/+ animals from the age-matched wild-type and GLT-1+/− controls from 7 and 8 weeks of age, respectively (Figure 5C; n=11–16; P<0.05).
Climbing Analysis
Climbing analysis demonstrated a reduction in the climbing behaviour from 3 weeks of age onwards in the mice that carried the R6/2 transgene regardless of the expression levels of GLT-1 (Figure 5D, E and F; n=11–16; P<0.05). The animals with the R6/2 transgene showed increased latency to climb (Figure 5D; P<0.05), as well as a dramatic reduction in the number of climbing events (Figure 5E, P<0.05) and the total time spent climbing (Figure 5F; P<0.05) in comparison to age-matched wild-type and GLT-1+/− animals.
Expression of GLT-1a in the presynaptic axon terminals in the striatum
GLT-1a-immunoreactivity in the striatum of C57BL/6 mouse was visualized using HRP-DAB (Figure 6). By light microscopy, GLT-1a appeared as fine puncta in the neuropil surrounding neurons in the striatum. These immunoreactive puncta were less dense in the external capsule (ec) and the fiber bundles coursing throughout the striatum. There was an absence of punta in the striatum of the GLT-1 knockout mice and the only profiles visible were the very pale nuclei within somata of unlabeled neurons, that was most likely background labeling (Figure 6B). EM images showed that HRP-DAB labeling was associated with the intracellular surface of the plasma membrane of processes that are identifiable as astrocytic, based on the highly irregular contour and the absence of vesicles, microtubules and postsynaptic densities (Figure 6C). The cytoplasm of the labeled astrocytic process is indicated by asterisks. The labeled astrocytic process was adjacent to a GLT-1a-immunoreactive axon terminal, GT, that was forming an asymmetric synapse with a spine. Within GT, immunoreactivity was evident along the intracellular surface of the plasma membrane, a portion of which faces the spine. Providing evidence that GLT-1a is expressed in presynaptic axon terminals in the striatum Using SIG EM-ICC, a method that yields the most quantitative data and precise localization of the antigenic sites, with an antibody for GLT-1a, we quantified the expression of GLT-1 in the presynaptic axon terminals in the striatum of 4 and 10 week old WT and R6/2 mice. Using SIG, we confirmed that GLT-1a occurs both along the presynaptic membrane (straight arrows) and intracellularly within axon terminals (curled arrows). Representative labeling in the striatum of 4 week old WT mice is shown in Figure 6D. Quantitative analysis showed no difference in the expression levels of GLT-1 in axon terminals in age-matched wild-type and R6/2 mice at 4 and 10 weeks of age (Figure 6E; n=3).
Figure 6. EM-ICC demonstrated that GLT-1a is expressed in the presynaptic terminals in the striatum, however no significant difference was observed in the presynaptically labeled synapses in the R6/2 transgenic mice when compared to their age-matched controls.
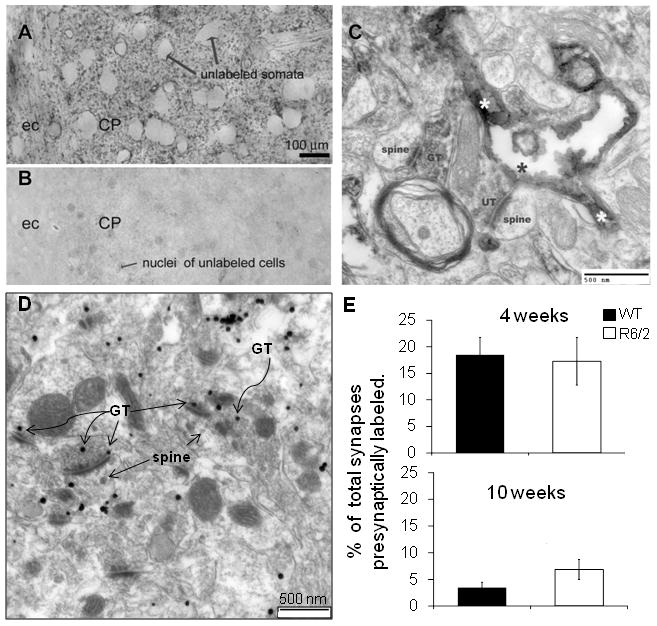
A Representative light microscopy image showing immunoreactive puncta which represents GLT-1a visualized using HRP-DAB. ec=external capsule. B – Representative micrograph taken from the striatum of a GLT-1 knockout mouse. C – Representative EM micrograph taken from the tissue shown in A. GT= GLT-1a immunoreactive axon terminal; UT = unlabeled terminal; *=cytoplasm of the labeled astrocytic process. D – Representative micrograph using SIG EM-ICC to visualize the expression of GLT-1a in the presynaptic terminals in the striatum of 4 week old WT mice. The straight arrows point to SIG particles residing at the presynaptic plasma membrane facing the synaptic cleft, while the curled arrows point to SIG particles occurring intracellularly of the same axon terminals. Scale bar represents 500nm. E – Histograms showing the average percentage of total synapses that were presynaptically labeled in the striatum of WT (solid black) and R6/2 (solid white) mice at 4 and 10 weeks of age.±SEM; n=3
Glutamate uptake into synaptosomes isolated from age-matched wild-type and R6/2 mice
Glutamate uptake into synaptosomes isolated from the forebrain of wild-type adult mice was assayed and was found to be sodium-dependent, inhibited by the broad-spectrum glutamate transporter antagonist, TBOA and was lost when the synaptosomes were preincubated with saponin, a compound that permeabilizes the membrane. The glutamate uptake into these synaptosomes was also temperature-sensitive (see Supplemental Figure 1). If the glutamate uptake were due to passive transport through channels or membrane leak, then the temperature coefficient (Q10) would be the Q10 for diffusion of small solutes in water, or 1.3. The kinetics of glutamate transporters are strongly temperature dependent with a Q10 of transport between 2–3 (Wadiche & Kavanaugh, 1998; Auger & Attwell, 2000). We determined the Q10 for 3H-L-glutamate uptake to be 2.27±0.21and using the Arrhenius equation the activation energy was determined to be 4.98 kJ/mol. The Km and Vmax of glutamate uptake into these synaptosomes was 10.99±1.21 μM and 5.0±0.82 pmol/μg/min, respectively (see Supplemental Figure 2). Na+ dependent glutamate uptake was decreased in synaptosomes isolated from the forebrain of GLT-1+/− mice, that have decreased levels of GLT-1 protein, (69.6±3.1%; P<0.0005; Figure 7). This is consistent with previous finding that glutamate uptake into synaptosomes isolated from GLT-1 knockout mice is decreased to 5.8% of that observed in synaptosomes from WT mice (Tanaka et al., 1998). To determine if the function of GLT-1-mediated glutamate uptake was altered during the progression of HD, we isolated crude synaptosomes from the striatum and cortex of 6 and 11 week old R6/2 transgenic mice and littermate controls. The rate of radiolabelled glutamate uptake into these synaptosomes was unchanged in the cortex (WT: 4.78±1.04 pmol/μg/min; R6/2: 5.29±1.35 pmol/μg/min) and striatum (WT: 5.67±0.89 pmol/μg/min; R6/2: 7.46±1.20 pmol/μg/min) at 6 weeks of age (Figure 8A; n=4) and also in the cortex (WT: 6.91±1.41 pmol/μg/min; R6/2: 9.05±2.27 pmol/μg/min) and striatum (WT: 4.22±0.72 pmol/μg/min; R6/2: 5.18±0.88 pmol/μg/min) at 11 weeks of age (Figure 8B; n=4). The contribution of glutamate uptake inhibited by a GLT-1 specific inhibitor (300μM dihydrokainate), which is indicative of the GLT-1-mediated uptake, was unchanged in synaptosomes isolated from the cortex (WT: 46.3±7.6%; R6/2: 46.6±6.5%) and striatum (WT: 53.9±7.4%; R6/2: 55.8±5.9%) of 6 week-old wild-type and R6/2 mice and from the cortex (WT: 82.0±1.4%; R6/2: 84.3±0.6%) and striatum (WT: 76.9±2.9%; R6/2: 84.6±0.9%) of 11 week-old mice (Figure 8C and 8D; n=4).
Figure 7. Glutamate uptake into synaptosomes isolated from the forebrain of 14 week old wild-type and GLT-1+/− mice.
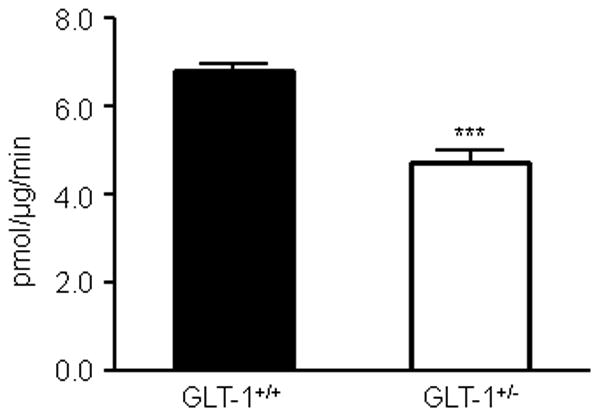
Representative histogram showing uptake of [3H]-glutamate into synaptosomes isolated from the forebrain of 14 week-old wild-type and GLT-1+/− mice. ***P<0.0005; (Unpaired t-test); ±SD.
Figure 8. Glutamate uptake into synaptosomes isolated from the striatum and cortex of 6 and 11 week old wild-type and R6/2 transgenic HD mice is unchanged.
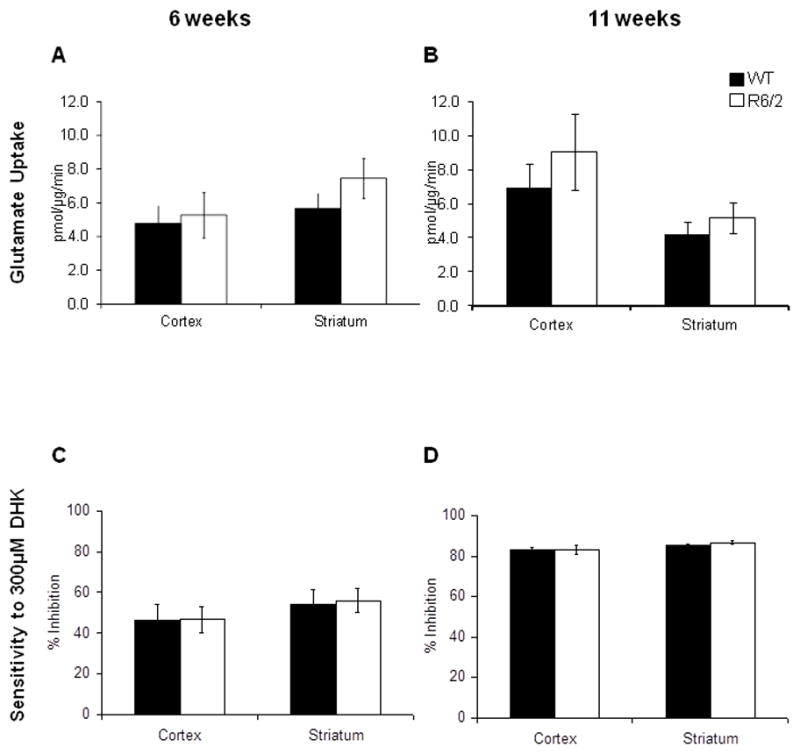
A - The uptake of [3H]-glutamate into synaptosomes isolated from the cortex and striatum of 6 week-old wild-type (solid black) and R6/2 (solid white) mice. B - The uptake of [3H]-glutamate into synaptosomes isolated from the cortex and striatum of 11 week-old wild-type (solid black) and R6/2 (solid white) mice. C - The percent inhibition of uptake of [3H]-glutamate into synaptosomes isolated from the cortex and striatum of 6 week-old wild-type (solid black) and R6/2 (solid white) mice in the presence of 300 μM DHK. D - The percent inhibition of uptake of [3H]-glutamate into synaptosomes isolated from the cortex and striatum of 11 week-old wild-type (solid black) and R6/2 (solid white) mice in the presence of 300 μM DHK. ±SEM; n=4
Discussion
GLT-1 protein and mRNA expression is known to be altered in late-stages of HD (Lievens et al., 2001) and so changes in glutamate homeostasis was not considered to be a primary event in HD, as changes in this protein’s expression occur after the onset of motor symptoms (Carter et al., 1999; Sheldon & Robinson, 2007). However, Miller et al., (2008) demonstrated a glutamate uptake deficit prior to when a change in GLT-1 expression was observed. Using no-net-flux microdialysis coupled online to capillary electrophoresis with laser-induced fluorescence to monitor functional changes in extracellular glutamate they demonstrated that there was a deficit in glutamate uptake in R6/2 mice and, further, that ceftriaxone increased levels of GLT-1 in the R6/2 mice and also restored the deficit in glutamate uptake. Significantly, administration of ceftriaxone reduced the clasping and climbing phenotype in R6/2 mice. The authors concluded that ceftriaxone attenuates the HD phenotype by increasing GLT-1 expression and reversing the glutamate uptake deficit. Conversely, we would expect that a decrease in the expression of GLT-1 would exacerbate the HD phenotype. However, the present study shows that decreasing the expression of GLT-1 in the R6/2 transgenic HD mice does not exacerbate the HD phenotype. These results suggest that ceftriaxone may ameliorate HD progression by an effect other than an effect on GLT-1 expression. Our findings do not preclude the possibility that the disease severity in the R6/2 mice might be potentiated with a further reduction in GLT-1 levels. However, our goal was to produce a reduction in GLT-1 expression comparable to what is seen in the disease, and test the effect of this manipulation In a mouse model of multiple sclerosis, ceftriaxone has been shown to attenuate disease course by a mechanism independent of GLT-1 expression and function (Melzer et al., 2008). For example, ceftriaxone is known to promote nuclear translocation of p65 and activation of NF-kappaB. NF-kappaB is a family of transcription factors that are involved in the control of a large number of normal cellular processes, such as immune and inflammatory responses, developmental processes, cellular growth, and apoptosis (Oeckinghaus & Ghosh, 2009). The observed effects of ceftriaxone on HD could be attributed to downstream effects of NF-kappaB activation, other than increase in expression of GLT-1. Alternatively, ceftriaxone is known to activate the transcription factor Nrf2 (nuclear factor erythroid 2-related factor 2), which induces a subunit of the glutamate/cystine-antiporter system x(c)(−), xCT (Sasaki et al., 2002; Lewerenz et al., 2009). Induction of xCT expression leads to increased levels of intracellular cysteine and thereby cystine, which is required for production of glutathione, the major cellular antioxidant. Recent work has suggested a deficit in trafficking of the cysteine and glutamate transporter, EAAC1 in HD (Li et al., 2010) and so an increase in xCT expression may in some way compensate for a deficit in cysteine import by EAAC1.
We assessed several behavioral signs of HD in mice with the R6/2 transgene in the presence of wild-type levels of GLT-1 and in mice that were heterozygous for GLT-1 expression. In each case, the decrease in the expression of GLT-1 did not significantly exacerbate the HD phenotype. By 10 weeks of age, the mice that carried the R6/2 transgene showed a significantly reduced body weight when compared to their wild-type and GLT-1+/−littermates. A decrease in body weight has been previously observed in the R6/2 transgenic HD mice at this age (Stack et al., 2005; van der Burg et al., 2008). Littermates that carried the R6/2 transgene and had a decreased expression of GLT-1 had an earlier onset of motor symptoms and the clasping phenotype, compared to their HD littermates (Figure 5 B&C). However, there was no significant difference between the HD animals regardless of expression levels of GLT-1 (R6/2; GLT-1+/+ or R6/2; GLT-1+/−). Climbing is a normal spontaneous activity in mice (Olsson & Dahlborn, 2002; van der Burg et al., 2008) and there was a dramatic reduction in climbing behavior in R6/2 mice compared to wild-type littermates from 4 weeks of age onwards (Hickey et al., 2005). Decreased expression of GLT-1 in littermate mice that carried the R6/2 transgene did not alter the climbing behavior further.
Mice that were 10 weeks of age and heterozygous for GLT-1 expression with normal huntingtin expression had an increased latency to fall from the accelerating rotarod (Figure 5B) and showed increased climbing behavior (Figure 5F). These results are in agreement with previous findings that 3-month old GLT-1+/− mice demonstrated periods of hyperlocomotion in a new environment (Kiryk et al., 2008).
At 4 weeks of age, GLT-1 mRNA is unaltered in the striatum and cortex, however from 8 to 14 weeks GLT-1 levels in these regions progressively decrease in HD (Lievens et al., 2001; Sari et al., 2010). Our study expands these findings and demonstrates that both isoforms of GLT-1 (GLT-1a and GLT-1b) are significantly decreased in the cortex of 11 week old R6/2 mice. In the striatum, nGLT-1 and GLT-1b expression are also significantly decreased in the 11 week old R6/2 mice, however a significant decrease in GLT-1a expression was only observed in 12 week old mice (Figures 2 and 4). In our studies the expression of the glutamate transporter GLAST was unchanged in the R6/2 transgenic mice when compared with their littermates, supporting previous studies that demonstrated no change in the protein and mRNA expression of this transporter (Lievens et al., 2001; Behrens et al., 2002). However, in the mice that were heterozygous for GLT-1 with normal huntingtin, there was an increase in GLAST expression in the cortex of 11 week old mice. This effect was not present in mice that were heterozygous for GLT-1 and carried the R6/2 transgene. However, previous studies show no change in the expression of GLAST in cortical homogenates from postnatal day 2 GLT-1 knockout mice (Takasaki et al., 2008). It is possible that in mice that express the GLT-1 KO gene the expression of GLAST increases as the mice age to compensate for the loss of the glutamate transporter GLT-1. In any case, this is the first report of a change in GLAST expression as a consequence of decreased levels of GLT-1.
Previous studies using immunoblotting analysis have reported no changed in the protein expression of the neuronal glutamate transporter EAAC1. In contrast, our studies demonstrated that EAAC1 was decreased at 11 weeks of age in the striatum. The inconsistency between previous data and our data may be related to the different endogenous controls of protein loading onto the gel. In our studies we used β-tubulin as the endogenous control to ensure equal protein loading, instead of GAPDH, whose levels are known to be altered in HD (Senatorov et al., 2003). Furthermore, to obtain an accurate representation of the protein expression, we determined absolute values of optical densities in order to quantify protein levels, in contrast to previous studies that determined protein expression relative to GAPDH.
The reduction in glutamate transporter protein expression does not appear to be the primary event in HD as it occurs after the onset of motor symptoms. However, glutamate transporters might contribute to the pathogenesis of HD if their function was significantly altered early in the course of the disease. The high-affinity sodium-dependent glutamate transporters that regulate the concentration of extracellular glutamate provide the predominant source of protection against excitotoxicity. Glutamate transport activity depends on the presence of the transmembrane sodium gradient generated by the Na+/K+-ATPase. During energy failure, extracellular K+ and intracellular Na+ concentrations rise, thereby altering the electrochemical gradients that drive glutamate uptake by the glutamate transporters. Under these conditions, glutamate transport through the transporter is reversed and the transporters release glutamate into the extracellular space. The presence of glutamate transporters at nerve terminals has been a controversial subject (Danbolt, 2001). In hippocampal neurons, it has been demonstrated that the glutamate transporter GLT-1, previously thought to be expressed in astrocytes, is also expressed in excitatory axon terminals of mature hippocampal neurons (Chen et al., 2004). Older data from other labs provides evidence for high affinity glutamate uptake activity in corticostirate axon terminals in the striatum (Divac et al., 1977; Fonnum et al., 1981; Cross et al., 1986; Gundersen et al., 1996). As the highest concentrations of glutamate are found inside nerve terminals (Bramham et al., 1990), the reversal of glutamate transporters in this location may contribute to an increase in glutamate at the synapse, causing excess activation of glutamate receptors, neuronal dysfunction and eventually death. Our study is the first to demonstrate by EM-ICC that GLT-1a is expressed in presynaptic terminals in the striatum. Furthermore, we show no change in the expression of GLT-1a in the presynaptic terminals in the R6/2 mice at 4 and 10 weeks of age. A change in function of these presynaptically located glutamate transporters, for example secondary to energy compromise, could possibly lead to excess glutamate in the synapse and excitotoxicity.
A decrease in glutamate uptake is observed in post-mortem HD brains (Cross et al., 1986; Hassel et al., 2008). By combining no –net-flux microdialysis with capillary electrophoresis with laser induced fluorescence, Miller et al., 2008 demonstrated a decrease in basal glutamate levels as well as a decrease in glutamate uptake in the striatum of 8 week old R6/2 mice. There is a decrease in 500μM DHK-inhibitable glutamate uptake into synaptosomes isolated from the striatum of YAC128 mice compared to controls at 3 months of age, demonstrating a decrease in the levels of GLT-1 mediated uptake when expression of GLT-1 protein was unaltered in comparison to wild-type littermates (Huang et al., 2010). To confirm previous findings of a decrease in glutamate uptake, we isolated synaptosomes from the cortex and striatum of age-matched wild-type and R6/2 mice, however no change in sodium-dependent glutamate uptake was observed at 6 weeks of age or even at 11 weeks of age, when we observed decrease in GLT-1 protein levels in the striatum and cortex of R6/2 mice. Additionally, there was no change in the contribution of the GLT-1-mediated glutamate uptake into synaptosomes from these age-matched mice. Previously, a modest (13%) decrease in total glutamate uptake into striatal synaptosomes isolated from the striatum of 12 week old R6/2 mice compared to wild type littermates was demonstrated, and this decrease was eliminated when 800μM DHK was present (Lievens et al., 2001). We did not observe a decrease in glutamate uptake into synaptosomes isolated from the striata of 11 week old R6/2 mice. According to Lehre et al., 1995, GLT-1 expression in the striatum of rats (at an unknown age) is 60% of the levels expressed in the neocortex. Based on these findings, we would expect our data to demonstrate a decrease in glutamate uptake into the striatum compared to the cortex. Our data do not support this expectation. This discrepancy between our results and the previous study might be due to differences in age, sex, and/or species.
Our findings suggest that the change in total glutamate uptake observed in humans is not due to a decrease in the expression or a change in function of the glutamate transporter GLT-1. Other glutamate transporters, such as low affinity glutamate transporters and the Na+ independent glutamate-cystine antiporter have been described in brain tissue and in cell cultures (Erecinska & Silver, 1990; Balcar & Li, 1992). Of note, one methodological difference between previous reports and our own study is that in all assays reported herein, we subtracted sodium independent from total uptake to yield sodium dependent transport. Previous studies reported total glutamate uptake and did not separate out these two components.
This work was undertaken to examine the hypothesis that GLT-1 is a significant modifier of disease progression in HD. In the course of this study, we have observed the following novel findings: 1) EAAC1 expression in the striatum of the R6/2 mice at 11 weeks of age was decreased; 2) expression of the GLT-1 variant form GLT-1b was decreased in addition to GLT-1a; 3) GLAST expression is increased in the GLT-1+/− mice; 4) GLT-1a is expressed in presynaptic terminals in the striatum. Contrary to previous findings, we detected no change in the Na+-dependent glutamate uptake at 6 weeks of age or 11 weeks of age in the R6/2 mice, the latter time point occurring when a clear decrease in GLT-1 protein expression was observed. Not all GLT-1 is expressed on the cell surface and is functional (Kalandadze et al., 2002). Our results suggest that the pool of GLT-1 protein affected by mutant Huntington in the R6/2 mice may be a non-functional component that is located intracellularly. Alternatively, previous studies have suggested that uptake into synaptosomes greatly over-represents uptake into axon terminals, because of heteroexchange, and under-represents uptake into astrocytes (Danbolt et al., 2006; Furness et al., 2008; Petr et al., 2011; Sun et al., 2012). If a decrease in GLT-1 protein were selectively due to loss of GLT-1 in astrocytes, then this phenomenon might be difficult to detect in synaptosomal preparations. Finally, we demonstrated that a decrease in GLT-1 expression produced by knockout of one allele does not alter the progression of the HD phenotype in the R6/2 mouse model, challenging the view that GLT-1 is a significant modifier of the disease.
Supplementary Material
Acknowledgments
We are grateful to Dr. Jeff Rothstein (John Hopkins University School of Medicine) and Dr. Kohichi Tanaka (Tokyo Medical and Dental University) for generously sharing reagents and to Felecia Marottoli for technical assistance. This work was supported by a Hereditary Disease Foundation Postdoctoral Fellowship (GTP) and by National Institutes of Health Grants NS066019 and HD18655.
Abbreviations
- ANOVA
analysis of variance
- HD
Huntington’s disease
- NF-kappaB
nuclear factor kappa B
- Nrf2
nuclear factor erythroid 2-related factor 2
- SEM
standard error of the mean
- xCT
subunit of the glutamate/cystine-antiporter system x(c)(−)
Footnotes
The authors declare that they have no conflict of interest.
References
- The Huntington’s Disease Collaborative Research Group. . A novel gene containing a trinucleotide repeat that is expanded and unstable on Huntington’s disease chromosomes. Cell. 1993;72:971–983. doi: 10.1016/0092-8674(93)90585-e. [DOI] [PubMed] [Google Scholar]
- Arzberger T, Krampfl K, Leimgruber S, Weindl A. Changes of NMDA receptor subunit (NR1, NR2B) and glutamate transporter (GLT1) mRNA expression in Huntington’s disease--an in situ hybridization study. J Neuropathol Exp Neurol. 1997;56:440–454. doi: 10.1097/00005072-199704000-00013. [DOI] [PubMed] [Google Scholar]
- Auger C, Attwell D. Fast removal of synaptic glutamate by postsynaptic transporters. Neuron. 2000;28:547–558. doi: 10.1016/s0896-6273(00)00132-x. [DOI] [PubMed] [Google Scholar]
- Balcar VJ, Li Y. Heterogeneity of high affinity uptake of L-glutamate and L-aspartate in the mammalian central nervous system. Life Sci. 1992;51:1467–1478. doi: 10.1016/0024-3205(92)90556-5. [DOI] [PubMed] [Google Scholar]
- Beal MF, Ferrante RJ, Swartz KJ, Kowall NW. Chronic quinolinic acid lesions in rats closely resemble Huntington’s disease. J Neurosci. 1991;11:1649–1659. doi: 10.1523/JNEUROSCI.11-06-01649.1991. [DOI] [PMC free article] [PubMed] [Google Scholar]
- Behrens PF, Franz P, Woodman B, Lindenberg KS, Landwehrmeyer GB. Impaired glutamate transport and glutamate-glutamine cycling: downstream effects of the Huntington mutation. Brain. 2002;125:1908–1922. doi: 10.1093/brain/awf180. [DOI] [PubMed] [Google Scholar]
- Bramham CR, Torp R, Zhang N, Storm-Mathisen J, Ottersen OP. Distribution of glutamate-like immunoreactivity in excitatory hippocampal pathways: a semiquantitative electron microscopic study in rats. Neuroscience. 1990;39:405–417. doi: 10.1016/0306-4522(90)90277-b. [DOI] [PubMed] [Google Scholar]
- Brustovetsky T, Purl K, Young A, Shimizu K, Dubinsky JM. Dearth of glutamate transporters contributes to striatal excitotoxicity. Exp Neurol. 2004;189:222–230. doi: 10.1016/j.expneurol.2004.03.021. [DOI] [PubMed] [Google Scholar]
- Carter RJ, Lione LA, Humby T, Mangiarini L, Mahal A, Bates GP, Dunnett SB, Morton AJ. Characterization of progressive motor deficits in mice transgenic for the human Huntington’s disease mutation. J Neurosci. 1999;19:3248–3257. doi: 10.1523/JNEUROSCI.19-08-03248.1999. [DOI] [PMC free article] [PubMed] [Google Scholar]
- Chan J, Aoki C, Pickel VM. Optimization of differential immunogold-silver and peroxidase labeling with maintenance of ultrastructure in brain sections before plastic embedding. J Neurosci Methods. 1990;33:113–127. doi: 10.1016/0165-0270(90)90015-8. [DOI] [PMC free article] [PubMed] [Google Scholar]
- Chen W, Aoki C, Mahadomrongkul V, Gruber CE, Wang GJ, Blitzblau R, Irwin N, Rosenberg PA. Expression of a variant form of the glutamate transporter GLT1 in neuronal cultures and in neurons and astrocytes in the rat brain. J Neurosci. 2002;22:2142–2152. doi: 10.1523/JNEUROSCI.22-06-02142.2002. [DOI] [PMC free article] [PubMed] [Google Scholar]
- Chen W, Mahadomrongkul V, Berger UV, Bassan M, DeSilva T, Tanaka K, Irwin N, Aoki C, Rosenberg PA. The glutamate transporter GLT1a is expressed in excitatory axon terminals of mature hippocampal neurons. J Neurosci. 2004;24:1136–1148. doi: 10.1523/JNEUROSCI.1586-03.2004. [DOI] [PMC free article] [PubMed] [Google Scholar]
- Cross AJ, Slater P, Reynolds GP. Reduced high-affinity glutamate uptake sites in the brains of patients with Huntington’s disease. Neurosci Lett. 1986;67:198–202. doi: 10.1016/0304-3940(86)90397-6. [DOI] [PubMed] [Google Scholar]
- Danbolt NC. Glutamate uptake. Prog Neurobiol. 2001;65:1–105. doi: 10.1016/s0301-0082(00)00067-8. [DOI] [PubMed] [Google Scholar]
- Danbolt NC, Storm-Mathisen J, Kanner BI. An [Na+ + K+]coupled L-glutamate transporter purified from rat brain is located in glial cell processes. Neuroscience. 1992;51:295–310. doi: 10.1016/0306-4522(92)90316-t. [DOI] [PubMed] [Google Scholar]
- Danbolt NC, Furness DN, Dehnes Y, Qureshi A, Rossi D, Hamann M, Grutle NJ, Gunderen V, Holmseth S, Lehre KP, Ullensvang K, Wojewodzic M, Attwell D. 2006 Neuroscience Meeting Planner. Atlanta, GA: Society for Neuroscience; 2006. A quantitative assessment of glutamate uptake into hippocampal synaptic terminals and astrocytes. Program No. 629.8. Online. [DOI] [PMC free article] [PubMed] [Google Scholar]
- Divac I, Fonnum F, Storm-Mathisen J. High affinity uptake of glutamate in terminals of corticostriatal axons. Nature. 1977;266:377–378. doi: 10.1038/266377a0. [DOI] [PubMed] [Google Scholar]
- Erecinska M, Silver IA. Metabolism and role of glutamate in mammalian brain. Prog Neurobiol. 1990;35:245–296. doi: 10.1016/0301-0082(90)90013-7. [DOI] [PubMed] [Google Scholar]
- Estrada-Sanchez AM, Montiel T, Segovia J, Massieu L. Glutamate toxicity in the striatum of the R6/2 Huntington’s disease transgenic mice is age-dependent and correlates with decreased levels of glutamate transporters. Neurobiol Dis. 2009;34:78–86. doi: 10.1016/j.nbd.2008.12.017. [DOI] [PubMed] [Google Scholar]
- Fonnum F, Storm-Mathisen J, Divac I. Biochemical evidence for glutamate as neurotransmitter in corticostriatal and corticothalamic fibres in rat brain. Neuroscience. 1981;6:863–873. doi: 10.1016/0306-4522(81)90168-8. [DOI] [PubMed] [Google Scholar]
- Furness DN, Dehnes Y, Akhtar AQ, Rossi DJ, Hamann M, Grutle NJ, Gundersen V, Holmseth S, Lehre KP, Ullensvang K, Wojewodzic M, Zhou Y, Attwell D, Danbolt NC. A quantitative assessment of glutamate uptake into hippocampal synaptic terminals and astrocytes: new insights into a neuronal role for excitatory amino acid transporter 2 (EAAT2) Neuroscience. 2008;157:80–94. doi: 10.1016/j.neuroscience.2008.08.043. [DOI] [PMC free article] [PubMed] [Google Scholar]
- Gundersen V, Ottersen OP, Storm-Mathisen J. Selective excitatory amino acid uptake in glutamatergic nerve terminals and in glia in the rat striatum: quantitative electron microscopic immunocytochemistry of exogenous (D)-aspartate and endogenous glutamate and GABA. Eur J Neurosci. 1996;8:758–765. doi: 10.1111/j.1460-9568.1996.tb01261.x. [DOI] [PubMed] [Google Scholar]
- Hassel B, Tessler S, Faull RL, Emson PC. Glutamate uptake is reduced in prefrontal cortex in Huntington’s disease. Neurochem Res. 2008;33:232–237. doi: 10.1007/s11064-007-9463-1. [DOI] [PubMed] [Google Scholar]
- Haugeto O, Ullensvang K, Levy LM, Chaudhry FA, Honore T, Nielsen M, Lehre KP, Danbolt NC. Brain glutamate transporter proteins form homomultimers. J Biol Chem. 1996;271:27715–27722. doi: 10.1074/jbc.271.44.27715. [DOI] [PubMed] [Google Scholar]
- Herman MA, Jahr CE. Extracellular glutamate concentration in hippocampal slice. J Neurosci. 2007;27:9736–9741. doi: 10.1523/JNEUROSCI.3009-07.2007. [DOI] [PMC free article] [PubMed] [Google Scholar]
- Hickey MA, Gallant K, Gross GG, Levine MS, Chesselet MF. Early behavioral deficits in R6/2 mice suitable for use in preclinical drug testing. Neurobiol Dis. 2005;20:1–11. doi: 10.1016/j.nbd.2005.01.024. [DOI] [PubMed] [Google Scholar]
- Hsu SM, Raine L, Fanger H. Use of avidin-biotin-peroxidase complex (ABC) in immunoperoxidase techniques: a comparison between ABC and unlabeled antibody (PAP) procedures. The journal of histochemistry and cytochemistry: official journal of the Histochemistry Society. 1981;29:577–580. doi: 10.1177/29.4.6166661. [DOI] [PubMed] [Google Scholar]
- Huang K, Kang MH, Askew C, Kang R, Sanders SS, Wan J, Davis NG, Hayden MR. Palmitoylation and function of glial glutamate transporter-1 is reduced in the YAC128 mouse model of Huntington disease. Neurobiol Dis. 2010;40:207–215. doi: 10.1016/j.nbd.2010.05.027. [DOI] [PubMed] [Google Scholar]
- Kalandadze A, Wu Y, Robinson MB. Protein kinase C activation decreases cell surface expression of the GLT-1 subtype of glutamate transporter. Requirement of a carboxyl-terminal domain and partial dependence on serine 486. The Journal of biological chemistry. 2002;277:45741–45750. doi: 10.1074/jbc.M203771200. [DOI] [PubMed] [Google Scholar]
- Kiryk A, Aida T, Tanaka K, Banerjee P, Wilczynski GM, Meyza K, Knapska E, Filipkowski RK, Kaczmarek L, Danysz W. Behavioral characterization of GLT1 (+/−) mice as a model of mild glutamatergic hyperfunction. Neurotox Res. 2008;13:19–30. doi: 10.1007/BF03033364. [DOI] [PubMed] [Google Scholar]
- Lee A, Pow DV. Astrocytes: Glutamate transport and alternate splicing of transporters. Int J Biochem Cell Biol. 2010;42:1901–1906. doi: 10.1016/j.biocel.2010.09.016. [DOI] [PubMed] [Google Scholar]
- Lehre KP, Levy LM, Ottersen OP, Storm-Mathisen J, Danbolt NC. Differential expression of two glial glutamate transporters in the rat brain: quantitative and immunocytochemical observations. J Neurosci. 1995;15:1835–1853. doi: 10.1523/JNEUROSCI.15-03-01835.1995. [DOI] [PMC free article] [PubMed] [Google Scholar]
- Lewerenz J, Albrecht P, Tien ML, Henke N, Karumbayaram S, Kornblum HI, Wiedau-Pazos M, Schubert D, Maher P, Methner A. Induction of Nrf2 and xCT are involved in the action of the neuroprotective antibiotic ceftriaxone in vitro. J Neurochem. 2009;111:332–343. doi: 10.1111/j.1471-4159.2009.06347.x. [DOI] [PubMed] [Google Scholar]
- Li X, Valencia A, Sapp E, Masso N, Alexander J, Reeves P, Kegel KB, Aronin N, Difiglia M. Aberrant Rab11-dependent trafficking of the neuronal glutamate transporter EAAC1 causes oxidative stress and cell death in Huntington’s disease. J Neurosci. 2010;30:4552–4561. doi: 10.1523/JNEUROSCI.5865-09.2010. [DOI] [PMC free article] [PubMed] [Google Scholar]
- Lievens JC, Woodman B, Mahal A, Spasic-Boscovic O, Samuel D, Kerkerian-Le Goff L, Bates GP. Impaired glutamate uptake in the R6 Huntington’s disease transgenic mice. Neurobiol Dis. 2001;8:807–821. doi: 10.1006/nbdi.2001.0430. [DOI] [PubMed] [Google Scholar]
- Lipton SA, Rosenberg PA. Excitatory amino acids as a final common pathway for neurologic disorders. N Engl J Med. 1994;330:613–622. doi: 10.1056/NEJM199403033300907. [DOI] [PubMed] [Google Scholar]
- Matsubara A, Laake JH, Davanger S, Usami S, Ottersen OP. Organization of AMPA receptor subunits at a glutamate synapse: a quantitative immunogold analysis of hair cell synapses in the rat organ of Corti. J Neurosci. 1996;16:4457–4467. doi: 10.1523/JNEUROSCI.16-14-04457.1996. [DOI] [PMC free article] [PubMed] [Google Scholar]
- Matsugami TR, Tanemura K, Mieda M, Nakatomi R, Yamada K, Kondo T, Ogawa M, Obata K, Watanabe M, Hashikawa T, Tanaka K. From the Cover: Indispensability of the glutamate transporters GLAST and GLT1 to brain development. Proc Natl Acad Sci U S A. 2006;103:12161–12166. doi: 10.1073/pnas.0509144103. [DOI] [PMC free article] [PubMed] [Google Scholar]
- Melzer N, Meuth SG, Torres-Salazar D, Bittner S, Zozulya AL, Weidenfeller C, Kotsiari A, Stangel M, Fahlke C, Wiendl H. A beta-lactam antibiotic dampens excitotoxic inflammatory CNS damage in a mouse model of multiple sclerosis. PLoS One. 2008;3:e3149. doi: 10.1371/journal.pone.0003149. [DOI] [PMC free article] [PubMed] [Google Scholar]
- Miller BR, Dorner JL, Shou M, Sari Y, Barton SJ, Sengelaub DR, Kennedy RT, Rebec GV. Up-regulation of GLT1 expression increases glutamate uptake and attenuates the Huntington’s disease phenotype in the R6/2 mouse. Neuroscience. 2008;153:329–337. doi: 10.1016/j.neuroscience.2008.02.004. [DOI] [PMC free article] [PubMed] [Google Scholar]
- Mitani A, Tanaka K. Functional changes of glial glutamate transporter GLT-1 during ischemia: an in vivo study in the hippocampal CA1 of normal mice and mutant mice lacking GLT-1. J Neurosci. 2003;23:7176–7182. doi: 10.1523/JNEUROSCI.23-18-07176.2003. [DOI] [PMC free article] [PubMed] [Google Scholar]
- Oeckinghaus A, Ghosh S. The NF-kappaB family of transcription factors and its regulation. Cold Spring Harb Perspect Biol. 2009;1:a000034. doi: 10.1101/cshperspect.a000034. [DOI] [PMC free article] [PubMed] [Google Scholar]
- Olsson IA, Dahlborn K. Improving housing conditions for laboratory mice: a review of “environmental enrichment”. Lab Anim. 2002;36:243–270. doi: 10.1258/002367702320162379. [DOI] [PubMed] [Google Scholar]
- Petr GT, Frederick NM, Corfas G, Aoki CJ, Rosenberg PA. 2011 Neuroscience Meeting Planner. Vol. 2011. Washington, DC: Society for Neuroscience; 2011. The contribution of the glutamate transporter GLT-1 expressed in neurons to synaptosomal uptake of glutamate. Program No. 342.10. Online. [Google Scholar]
- Phend KD, Rustioni A, Weinberg RJ. An osmium-free method of epon embedment that preserves both ultrastructure and antigenicity for post-embedding immunocytochemistry. J Histochem Cytochem. 1995;43:283–292. doi: 10.1177/43.3.7532656. [DOI] [PubMed] [Google Scholar]
- Rakhade SN, Loeb JA. Focal reduction of neuronal glutamate transporters in human neocortical epilepsy. Epilepsia. 2008;49:226–236. doi: 10.1111/j.1528-1167.2007.01310.x. [DOI] [PubMed] [Google Scholar]
- Robinson MB, Djali S, Buchhalter JR. Inhibition of glutamate uptake with L-trans-pyrrolidine-2,4-dicarboxylate potentiates glutamate toxicity in primary hippocampal cultures. J Neurochem. 1993;61:2099–2103. doi: 10.1111/j.1471-4159.1993.tb07447.x. [DOI] [PubMed] [Google Scholar]
- Rosenberg PA, Aizenman E. Hundred-fold increase in neuronal vulnerability to glutamate toxicity in astrocyte-poor cultures of rat cerebral cortex. Neurosci Lett. 1989;103:162–168. doi: 10.1016/0304-3940(89)90569-7. [DOI] [PubMed] [Google Scholar]
- Rosenberg PA, Amin S, Leitner M. Glutamate uptake disguises neurotoxic potency of glutamate agonists in cerebral cortex in dissociated cell culture. J Neurosci. 1992;12:56–61. doi: 10.1523/JNEUROSCI.12-01-00056.1992. [DOI] [PMC free article] [PubMed] [Google Scholar]
- Rothstein JD, Dykes-Hoberg M, Pardo CA, Bristol LA, Jin L, Kuncl RW, Kanai Y, Hediger MA, Wang Y, Schielke JP, Welty DF. Knockout of glutamate transporters reveals a major role for astroglial transport in excitotoxicity and clearance of glutamate. Neuron. 1996;16:675–686. doi: 10.1016/s0896-6273(00)80086-0. [DOI] [PubMed] [Google Scholar]
- Rothstein JD, Martin L, Levey AI, Dykes-Hoberg M, Jin L, Wu D, Nash N, Kuncl RW. Localization of neuronal and glial glutamate transporters. Neuron. 1994;13:713–725. doi: 10.1016/0896-6273(94)90038-8. [DOI] [PubMed] [Google Scholar]
- Sari Y, Prieto AL, Barton SJ, Miller BR, Rebec GV. Ceftriaxone-induced up-regulation of cortical and striatal GLT1 in the R6/2 model of Huntington’s disease. J Biomed Sci. 2010;17:62. doi: 10.1186/1423-0127-17-62. [DOI] [PMC free article] [PubMed] [Google Scholar]
- Sasaki H, Sato H, Kuriyama-Matsumura K, Sato K, Maebara K, Wang H, Tamba M, Itoh K, Yamamoto M, Bannai S. Electrophile response element-mediated induction of the cystine/glutamate exchange transporter gene expression. J Biol Chem. 2002;277:44765–44771. doi: 10.1074/jbc.M208704200. [DOI] [PubMed] [Google Scholar]
- Senatorov VV, Charles V, Reddy PH, Tagle DA, Chuang DM. Overexpression and nuclear accumulation of glyceraldehyde-3-phosphate dehydrogenase in a transgenic mouse model of Huntington’s disease. Mol Cell Neurosci. 2003;22:285–297. doi: 10.1016/s1044-7431(02)00013-1. [DOI] [PubMed] [Google Scholar]
- Sheldon AL, Robinson MB. The role of glutamate transporters in neurodegenerative diseases and potential opportunities for intervention. Neurochem Int. 2007;51:333–355. doi: 10.1016/j.neuint.2007.03.012. [DOI] [PMC free article] [PubMed] [Google Scholar]
- Shin JY, Fang ZH, Yu ZX, Wang CE, Li SH, Li XJ. Expression of mutant huntingtin in glial cells contributes to neuronal excitotoxicity. J Cell Biol. 2005;171:1001–1012. doi: 10.1083/jcb.200508072. [DOI] [PMC free article] [PubMed] [Google Scholar]
- Stack EC, Kubilus JK, Smith K, Cormier K, Del Signore SJ, Guelin E, Ryu H, Hersch SM, Ferrante RJ. Chronology of behavioral symptoms and neuropathological sequela in R6/2 Huntington’s disease transgenic mice. J Comp Neurol. 2005;490:354–370. doi: 10.1002/cne.20680. [DOI] [PubMed] [Google Scholar]
- Sun Y, Petr GT, Frederick NM, Aoki CJ, Rotenberg A, Dhamne SC, Hameed MQ, Goodrich GS, Armsen W, Rosenberg PA. 2012 Neuroscience Meeting Planner. Vol. 2012. New Orleans, LA: Society for Neuroscience; 2012. Cell-type specific expression and function of the glutamate transporter GLT-1 at excitatory synapses probed with conditional deletion. Program No. 332.16. Online. [Google Scholar]
- Takasaki C, Okada R, Mitani A, Fukaya M, Yamasaki M, Fujihara Y, Shirakawa T, Tanaka K, Watanabe M. Glutamate transporters regulate lesion-induced plasticity in the developing somatosensory cortex. J Neurosci. 2008;28:4995–5006. doi: 10.1523/JNEUROSCI.0861-08.2008. [DOI] [PMC free article] [PubMed] [Google Scholar]
- Tanaka K, Watase K, Manabe T, Yamada K, Watanabe M, Takahashi K, Iwama H, Nishikawa T, Ichihara N, Kikuchi T, Okuyama S, Kawashima N, Hori S, Takimoto M, Wada K. Epilepsy and exacerbation of brain injury in mice lacking the glutamate transporter GLT-1. Science. 1997;276:1699–1702. doi: 10.1126/science.276.5319.1699. [DOI] [PubMed] [Google Scholar]
- van der Burg JM, Bacos K, Wood NI, Lindqvist A, Wierup N, Woodman B, Wamsteeker JI, Smith R, Deierborg T, Kuhar MJ, Bates GP, Mulder H, Erlanson-Albertsson C, Morton AJ, Brundin P, Petersen A, Bjorkqvist M. Increased metabolism in the R6/2 mouse model of Huntington’s disease. Neurobiol Dis. 2008;29:41–51. doi: 10.1016/j.nbd.2007.07.029. [DOI] [PubMed] [Google Scholar]
- Vonsattel JP, Myers RH, Stevens TJ, Ferrante RJ, Bird ED, Richardson EP., Jr Neuropathological classification of Huntington’s disease. J Neuropathol Exp Neurol. 1985;44:559–577. doi: 10.1097/00005072-198511000-00003. [DOI] [PubMed] [Google Scholar]
- Wadiche JI, Kavanaugh MP. Macroscopic and microscopic properties of a cloned glutamate transporter/chloride channel. J Neurosci. 1998;18:7650–7661. doi: 10.1523/JNEUROSCI.18-19-07650.1998. [DOI] [PMC free article] [PubMed] [Google Scholar]
- Yanai A, Huang K, Kang R, Singaraja RR, Arstikaitis P, Gan L, Orban PC, Mullard A, Cowan CM, Raymond LA, Drisdel RC, Green WN, Ravikumar B, Rubinsztein DC, El-Husseini A, Hayden MR. Palmitoylation of huntingtin by HIP14 is essential for its trafficking and function. Nat Neurosci. 2006;9:824–831. doi: 10.1038/nn1702. [DOI] [PMC free article] [PubMed] [Google Scholar]
Associated Data
This section collects any data citations, data availability statements, or supplementary materials included in this article.