Abstract
We previously suggested that, in obese animals and humans, white adipose tissue inflammation results from the death of hypertrophic adipocytes; these are then cleared by macrophages, giving rise to distinctive structures we denominated crown-like structures. Here we present evidence that subcutaneous and visceral hypertrophic adipocytes of leptin-deficient (ob/ob and db/db) obese mice exhibit ultrastructural abnormalities (including calcium accumulation and cholesterol crystals), many of which are more common in hyperglycemic db/db versus normoglycemic ob/ob mice and in visceral versus subcutaneous depots. Degenerating adipocytes whose intracellular content disperses in the extracellular space were also noted in obese mice; in addition, increased anti-reactive oxygen species enzyme expression in obese fat pads, documented by RT-PCR and immunohistochemistry, suggests that ultrastructural changes are accompanied by oxidative stress. RT-PCR showed NLRP3 inflammasome activation in the fat pads of both leptin-deficient and high-fat diet obese mice, in which formation of active caspase-1 was documented by immunohistochemistry in the cytoplasm of several hypertrophic adipocytes. Notably, caspase-1 was not detected in FAT-ATTAC transgenic mice, where adipocytes die of apoptosis. Thus, white adipocyte overexpansion induces a stress state that ultimately leads to death. NLRP3-dependent caspase-1 activation in hypertrophic adipocytes likely induces obese adipocyte death by pyroptosis, a proinflammatory programmed cell death.
Keywords: adipose tissue, diabetes, obesity, electron microscopy, inflammation
Obesity results from a sustained imbalance between caloric intake and energy expenditure processes. In a state of caloric excess, white adipose tissue (WAT) plays a critical role by storing the surplus energy in the form of triglycerides, white adipocytes increase in number and size, and subcutaneous and visceral adipose depots expand. When adipose tissue enlargement is no longer capable of buffering the excess nutrients, numerous interconnected cell and tissue abnormalities arise, mainly in the visceral depots (1–4). Increased catabolism in the mitochondria of hypertrophic adipocytes leads to oxidative stress and production of free radicals (5, 6). When the adipocyte endoplasmic reticulum can no longer process the excess nutrients, “endoplasmic reticulum stress” develops (7). Both mechanisms strongly contribute to adipose tissue inflammation, and the efflux of free fatty acids from adipocytes into the circulation causes lipid overload in skeletal muscle, liver, and pancreas. Additionally, failure of the vasculature to expand with adipocyte enlargement induces adipose tissue hypoxia (8–10); with the passing of time, this results in a local state of tissue fibrosis (11, 12). These phenomena are accompanied by abnormal release of fatty acids, adipokines, and proinflammatory molecules by adipose tissue that in turn leads to a constellation of conditions (central obesity, dyslipidemia, glucose intolerance, and hypertension), which have come to be referred to as metabolic syndrome (13).
In obese animals and humans, WAT is infiltrated by macrophages; the degree of infiltration significantly and positively correlates with white adipocyte size and results in the onset of insulin resistance (14, 15). Specifically, the characteristic chronic, low-grade inflammation of obese fat importantly impairs peripheral insulin sensitivity by reducing adiponectin secretion and instigating the production of proinflammatory mediators, such as tumor necrosis factor (TNF)α, inducible nitric oxide syntase, interleukin (IL)-6, and IL-1β (2, 3). The vast majority of macrophages infiltrating obese adipose tissue are found at sites where adipocytes undergo necrotic-like death; there they form distinctive structures that we have called crown-like structures (CLS) (16). Ultrastructurally, CLSs are aggregates of activated macrophages, sometimes fused into syncytia (multinucleated giant cells), that surround individual dead adipocytes. Such structures, which are highly reminiscent of those seen in foreign body tissue reaction, suggest that the death of the obese adipocyte is a major event in obese adipose tissue and that it is followed by macrophage infiltration whose function is to sequester and ingest adipocyte debris. Thus, we have advanced the hypothesis that the chronic, low-grade inflammation seen in obese adipose tissue is essentially sustained by the need for clearing the extracellular space of adipocyte debris, particularly the large lipid droplet (16). Comparison of different visceral and subcutaneous fat depots from ob/ob and db/db obese mice indicates that the former depots are the main sites of adipocyte death and macrophage infiltration (17, 18), a finding that may explain the higher morbidity associated with visceral fat expansion.
In this study, we analyze by quantitative methods the fine structure of the hypertrophic adipocytes found in the subcutaneous and visceral adipose tissues of genetically obese ob/ob and db/db mice, which lack, respectively, leptin and the functional form of leptin receptor. Electron microscopic techniques document numerous organelle abnormalities in hypertrophic adipocytes that are consistent with severe cellular metabolic stress and often result in cell degeneration and subsequent macrophage clearing. The increased expression of anti-reactive oxygen species (ROS) enzymes, seen in the fat of obese mice compared with controls, confirms the oxidative stress state of hypertrophic adipocytes. The abnormal traits found in the hypertrophic adipocytes are capable of activating inflammasome pathways. Indeed, the nucleotide-binding oligomerization domain (NOD)-like receptor (NLR)-3 (NLRP3) inflammasome is activated in the adipose depots of both genetically obese mice and in those where obesity is induced by a high-fat diet (HFD). Collectively, the strong caspase-1 expression detected by immunohistochemistry in hypertrophic adipocytes from obese mice and their degenerative features, disclosed by electron microscopy in massively obese leptin-deficient mice, lend support to the hypothesis that hypertrophic adipocytes die of pyroptosis.
MATERIALS AND METHODS
Animals and tissues
Ob/+, ob/ob, db/+, db/db, and C57BL/6 wild-type (WT) female mice were purchased from Charles River (Lecco, Italy) at 5 weeks of age and used for experimental procedures at 14 weeks of age. FAT-ATTAC (fat apoptosis through targeted activation of caspase-8) mice were also used (19). Animals were individually caged and maintained on a 12 h/12 h light/dark cycle with free access to standard pellet food and water. Unless otherwise specified, control mice were the heterozygous animals. Female Swiss CD-1 mice 3 weeks of age purchased from Charles River were caged and treated like the other mice for one week. After the acclimatization period, they were weighed and divided into two groups with similar mean body weight: one group (HFD mice) were fed a high-fat diet (Charles River; 50 kJ% from fat, 30 kJ% from carbohydrates, and 20 kJ% from proteins); the other group (control mice) were fed a low-fat diet (Charles River; 19 kJ% from fat, 50 kJ% from carbohydrates, and 31 kJ% from proteins). After 10 weeks under these feeding regimens, the mean body weight of HFD mice was 47 ± 3 g and that of control mice was 38 ± 1.7 g (P < 0.05). All animal procedures were in accordance with Italian Institutional and National Guidelines and were approved by the Animal Ethics Committee of University of Ancona (Politecnica delle Marche). Mice were euthanized with an overdose of anesthetic (Avertin; Fluka Chemie, Buchs, Switzerland) and immediately perfused with 4% paraformaldehyde in 0.1 M phosphate buffer (PB), pH 7.4, for 5 min. Subcutaneous (inguinal) and visceral (mesenteric) WAT depots were dissected using a Zeiss OPI1 surgical microscope (Carl Zeiss, Oberkochen, Germany) and further fixed by immersion in 4% paraformaldehyde in PB overnight at 4°C. After a thorough rinse in PB, specimens were dehydrated in ethanol, cleared in xylene, and embedded in paraffin.
Light microscopy and morphometry
Serial paraffin sections 3 μm in thickness were obtained from each specimen. Some were stained with hematoxylin and eosin to assess morphology; the others were used for immunohistochemical and histochemical procedures. Adipocyte size was calculated as the mean adipocyte area of 300 random adipocytes (100 per section) from each depot of each mouse using a drawing tablet and the Nikon LUCIA IMAGE software (version 4.61; Laboratory Imaging, Praha, Czech Republic) of the morphometric program. Tissue sections were observed with a Nikon Eclipse E800 light microscope (Nikon Instruments, Firenze, Italy) using a 20× objective, and digital images were captured with a Nikon DXM 1220 camera.
Metabolic analysis
Plasma insulin was measured using a commercially available ELISA kit (Mouse Insulin ELISA, DRG Instruments, Marburg, Germany). Plasma glucose was measured using the glucose oxidase method (Glucose RTU, bioMerieux S.A., Marcy l'Etoile, France). The Homeostasis Model Assessment (HOMA) insulin resistance index was calculated using the following standard formula: HOMA = (FPG × FPI) / 22.5, where FPG and FPI are fasting plasma glucose (mMol) and fasting plasma insulin, respectively.
Transmission electron microscopy and morphometry
Small subcutaneous and visceral adipose tissue fragments were fixed in 2% glutaraldheyde-2% paraformaldehyde in PB for 4 h at room temperature, postfixed in 1% osmium tetroxide, and embedded in an Epon-Araldite mixture. Semithin sections (2 μm) were stained with toluidine blue. Thin sections were obtained with an MT-X ultratome (RMC; Tucson, AZ), stained with lead citrate, and examined with a CM10 transmission electron microscope (Philips; Eindhoven, Netherlands). Morphometric evaluation of hypertrophic adipocytes was performed using image analysis software (Lucia IMAGE version 4.82, Laboratory Imaging). Five animals per group were examined. Ten electron micrographs of each adipose depot of each mouse were taken at a magnification of 4,900× to calculate peripheral cytoplasmic area; mitochondrial area; mitochondrial density; rough endoplasmic reticulum (RER) area; Golgi complex area; the percentage of hypertrophic adipocytes containing glycogen deposits, calcium deposits, and collagen fibrils; and the percentage of degenerating adipocytes.
High-resolution scanning electron microscopy
Tissue fragments were fixed with 0.25% glutaraldehyde and 0.25% paraformaldehyde in PB for 15 min at room temperature. They were postfixed in 1.25% potassium ferrocyanide and 1% osmium tetroxide for 2 h and then processed by the osmium tetroxide maceration method (20, 21). After dehydration through a graded acetone series, they were critical-point dried (CPD 010 Balzers; Fachbericht, Liechtenstein) and gold-coated with an Emitech K550 sputter coater (Quorum Technology, Ashford, Kent, UK). Specimens were observed with a FESEM Zeiss Supra 40 VP.
Antibodies
The following antibodies were used: mouse monoclonal anti-MAC-2 (Cedarlane Laboratories, Paletta Court, Burlington, Ontario, Canada; dilution 1:2800); rabbit polyclonal anti-perilipin (kindly provided by Dr. A. S. Greenberg, Boston, MA; dilution 1:300); mouse monoclonal anti-caspase 1 (Imgenex, San Diego, CA; dilution 1:150); rabbit polyclonal anti-CARD domain containing (ASC; AdipoGen, San Diego, CA; dilution 1:150); rabbit polyclonal anti-NLRP3 (LifeSpan Biosciences, Seattle, WA; dilution 1:300); rabbit polyclonal anti-superoxide dismutase-1 (SOD-1; LifeSpan Biosciences; dilution 1:200); rabbit polyclonal anti-catalase (Sigma-Aldrich, St. Louis, MO; dilution 1:300); and mouse monoclonal anti-glutathione peroxidase-1 (GPX-1; Life Biosciences; dilution 1:200).
Peroxidase immunohistochemistry
Immunohistochemistry was performed on 3 μm-thick paraffin-embedded sections of fat depots. After dewaxing, antigen retrieval was achieved with a pressure cooker treatment (90°C for 20 min) by soaking sections in a sodium citrate buffer 0.01 M, pH 6.0. After a thorough rinse in phosphate buffered saline (PBS), sections were reacted with 0.3% H2O2 (in PBS; 30 min) to block endogenous peroxidase, rinsed with PBS, and incubated in a 3% blocking solution (in PBS; 60 min). Then they were incubated with the primary antibodies (in PBS; overnight at 4°C). After a thorough rinse in PBS, sections were incubated in a 1:200 v/v biotinylated secondary antibody solution (in PBS; 30 min). Biotinylated HRP-conjugated secondary antibodies (Vector Laboratories, Burlingame, CA) were goat anti-rabbit IgG (perilipin/ASC/SOD-1/catalase) and horse anti-mouse IgG (MAC-2/caspase-1/GPX-1). Histochemical reactions were performed using Vectastain ABC kit (Vector Laboratories) and Sigma Fast 3,3′-diaminobenzidine (Sigma-Aldrich) as the substrate. Sections were finally counterstained with hematoxylin, dehydrated, and mounted in Entellan. Staining was never observed when the primary antibody was omitted.
Histochemistry
Von Kossa staining was employed to detect calcium deposits according to Rungby et al. (22), with slight modifications. Paraffin-embedded sections were dewaxed, hydrated, and incubated with a solution of silver nitrate 5% in distilled water at room temperature for 1 h under a 100 W light bulb. They were rinsed with distilled water, incubated with sodium-carbonate-formaldehyde for 2 min, rinsed again, and finally incubated with Framer's reducer for 1 min. Collagen was detected by picrosirius red staining (23). Adipose tissue sections were first dewaxed and hydrated, then incubated in Sirius Red 0.1% in Sat'd Picric Acid for 30 min, rinsed in water for 10 min, washed for 2 min in 1 N hydrochloric acid, rinsed again in water, dehydrated, cleared, and mounted.
RNA isolation and analysis
Total RNA was extracted using TRIZOL reagent (Invitrogen, Milano, Italy), purified, digested with RNase-free DNase, and concentrated using RNeasy Micro kit (Qiagen, Milano, Italy) according to the respective manufacturer's instructions.
For determination of mRNA levels, 1 µg of RNA was reverse-transcribed with a high-capacity cDNA RT kit with RNase inhibitor (Applied BioSystems, Foster City, CA) in a total volume of 20 µl. Real time gene expression was analyzed in triplicate by using TaqMan gene expression assays (Applied BioSystems) as listed: PYD and CARD domain containing (ASC): Mm00445747_g1; caspase-1: Mm00438023_m1; NLRP3: Mm00840904_m1; TATA box binding protein (TBP): Mm00446973_m1; catalase: Mm00437992_m1; SOD-1: Mm01344233_g1; GPX-1: Mm00656767_g1; TXNIP: Mm01265659_g1; and master mix TaqMan (Applied BioSystems).
Since _g1 gene expression assays, which do not exclude genomic DNA amplification, were used for ASC, superoxide dismutase 1, TXNIP, and glutathione peroxidase 1, after RNA purification, samples were subjected to DNase treatment with RQ1 RNase-Free DNase (Promega, Milano, Italy) followed by RNA cleanup procedure using RNeasy micro kit (Qiagen).
Reactions were carried out in an ABI 7300 system (Applied Biosystems) using 50 ng RNA in a final reaction volume of 20 μl and the following thermal cycle protocol: initial incubation at 95°C for 10 min, followed by 40 cycles of 95°C for 15 s and 60°C for 20 s. A control reaction where reverse transcriptase was omitted in the amplification mixture was included for each sample to rule out genomic contamination. Relative mRNA expression was determined by the ΔΔ-Ct method using TBP levels as an endogenous control. Differences in starting total RNA and in cDNA synthesis efficiency among samples were normalized using TBP expression; results were expressed as fold changes in relative gene expression compared with the control group.
Statistical analysis
Results are given as mean ± standard error of the mean (SEM). Differences between groups were evaluated by ANOVA (ANOVA) and by the unpaired t-test. Statistical analysis was performed with GraphPad InStat (version 3.00 for Windows) software (San Diego, CA). A level of P < 0.05 was considered significant.
RESULTS
As expected, both ob/ob and db/db obese mice had higher body and fat depot weights than heterozygous and WT mice (data not shown). Numerous scattered MAC-2-positive CLSs were detected by light microscopy among white adipocytes in the subcutaneous and visceral fat depots of obese mice (16). Mean subcutaneous and visceral white adipocyte size was about 7 times greater in ob/ob mice and about 11 times greater in db/db mice compared with WT animals (Table 1), in line with previous morphometric investigations (18). In addition, subcutaneous adipocytes were about 24% larger than visceral adipocytes in both obese strains (Table 1).
TABLE 1.
Mean adipocyte area (µm2) in genetically obese mice
| Mice | Subcutaneous Adipocytes | Visceral Adipocytes |
| WT | 1289.82 ± 9.58 | 1011.05 ± 3.59 |
| ob/+ | 1070 ± 51.40 | 1060.40 ± 50.3 |
| db/+ | 1742.86 ± 116.89 | 1842.34 ± 15.08 |
| ob/ob | 9956.03 ± 153.44*** | 8011.99 ± 348.63*** |
| db/db | 14213.11 ± 647.92*** | 11540.63 ± 209.18*** |
Five animals per group were examined. Values are mean ± SEM. ***P< 0.001 in obese versus WT and heterozygous mice.
As regards glucose homeostasis (Table 2), db/+, ob/+, and WT mice had comparable plasma glucose, insulin, and HOMA index values, whereas in ob/ob mice, plasma glucose levels were comparable to those found in controls and the insulin and HOMA index values were significantly higher. The db/db mice exhibited the highest values for all these parameters. In synthesis, in ob/ob mice, hyperinsulinemia compensated for impaired insulin sensitivity, whereas db/db mice had both hyperinsulinemia and hyperglycemia.
TABLE 2.
Glycemic control in genetically obese mice
| Mice | Plasma Glucose (mg/dl) | Insulin (ng/ml) | HOMA |
| WT | 76 ± 7 | 1.4 ± 0.31 | 0.29 ± 0.07 |
| ob/+ | 87 ± 12 | 1.12 ± 0.49 | 0.26 ± 0.12 |
| db/+ | 83 ± 5 | 0.96 ± 0.03 | 0.23 ± 0.09 |
| ob/ob | 106 ± 16 | 3.8 ± 0.55* | 0.95 ± 0.09* |
| db/db | 275 ± 28* | 8.28 ± 0.76* | 5.69 ± 0.9* |
Plasma glucose was significantly increased in db/db compared with ob/ob, wild-type (WT), and heterozygous mice. Insulin and HOMA index were significantly higher in both ob/ob and db/db mice compared with WT and heterozygous mice. Values are mean ± SEM. *P < 0.05, 5–7 animals per group.
Hypertrophic adipocytes of genetically obese mice show ultrastructural features of cellular stress
To document early signs of cellular stress in obese fat, we examined by electron microscopy the hypertrophic adipocytes found near CLSs. These cells appeared to lack direct contact with the macrophages infiltrating adipose tissue and were always perilipin-immunoreactive, and hence, metabolically viable (19, 24, 25).
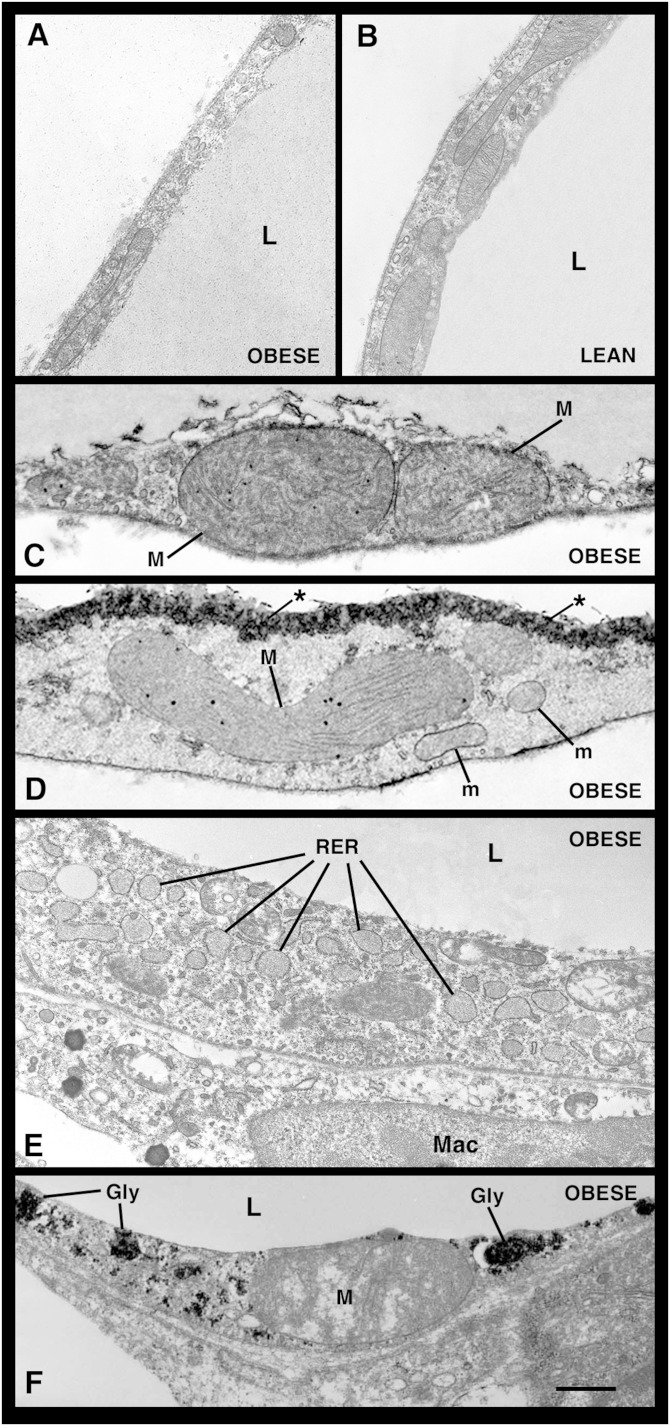
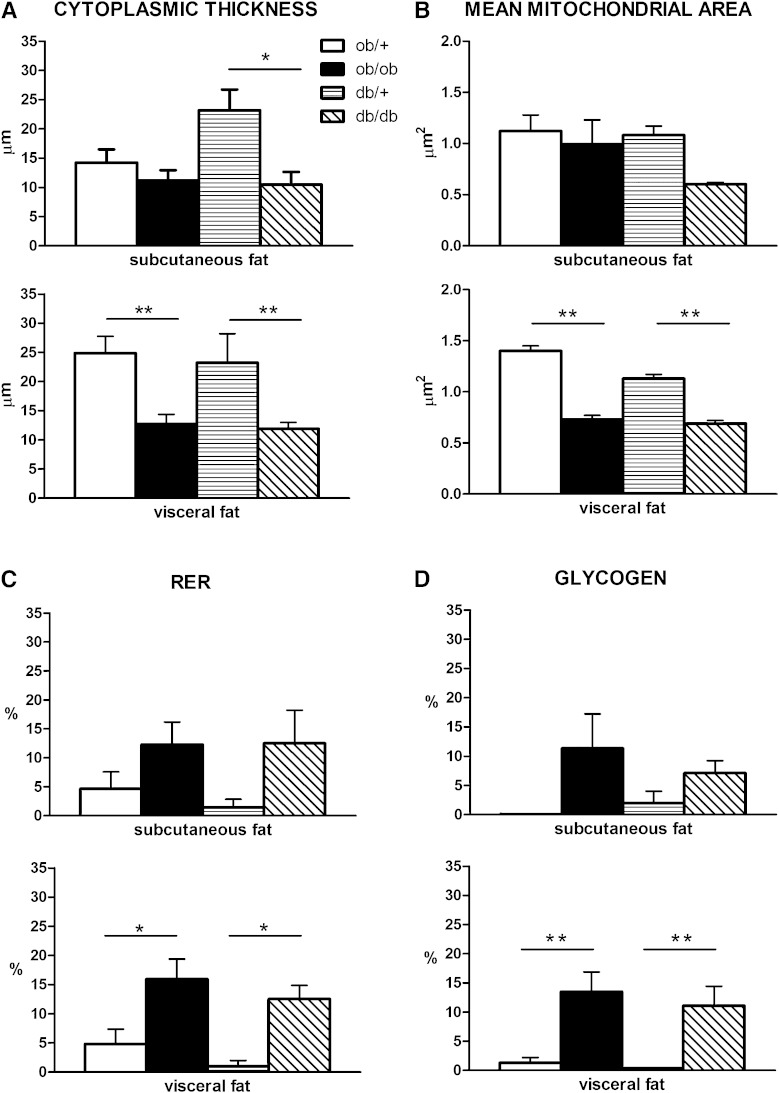
The cytoplasmic rim was thinner in hypertrophic (Fig. 1A) than in control adipocytes (Fig. 1B), even though the total cytoplasmic area was unchanged, and thinnest in visceral hypertrophic adipocytes (Fig. 2A). Whereas mitochondrial density was similar in adipocytes from both obese and control mice, mean mitochondrial area was significantly smaller in the hypertrophic adipocytes of visceral depots (Fig. 2B). Notably, giant mitochondria twice the size of normal mitochondria and exhibiting abnormally arranged cristae were also occasionally found (Fig. 1C, D). In the vast majority of adipocytes of both obese strains, the RER was expanded and dilated (Fig. 1E), but the number of these cells was again higher in the visceral depots (Fig. 2C). Hypertrophic adipocytes were also characterized by a hypertrophic Golgi complex and numerous and clearly evident glycogen deposits (Fig. 1F). Interestingly, the percentage of hypertrophic adipocytes containing glycogen deposits was higher in visceral than in subcutaneous fat (Fig. 2D).
Fig. 1.
TEM images of hypertrophic adipocytes from genetically obese mice. Hypertrophic adipocytes from the visceral adipose depot of db/db mice exhibit a thin cytoplasmic rim (A and B); they occasionally contain giant mitochondria (M) with strongly electron-dense granules beside mitochondria with normal size and shape (m) (C, D, and F). They are also characterized by numerous, dilated cisternae of RER [a highly dilated RER is shown in (E)] and large glycogen deposits (gly) (F). In (D), note the electron density at the level of the lipid-cytoplasm boundary, consistent with calcium microcrystal deposition (asterisks). L, lipid droplet; Mac, macrophage. Scale bar: 0.6 μm for (A–D); 1 μm for (E); 0.5 μm for (F).
Fig. 2.
Morphometric analysis of the ultrastructural aspects of hypertrophic adipocytes in genetically obese mice, which are described in detail in the text. Cytoplasmic thickness (A), mean mitochondrial area (B), and the percentage of cells exhibiting an RER (C) and glycogen deposits (D) are significantly different compared with control samples in visceral fat. In subcutaneous fat all measures show the same tendency, but differences are not significant except for cytoplasmic thickness in db/db mice. *P < 0.05; **P < 0.01.
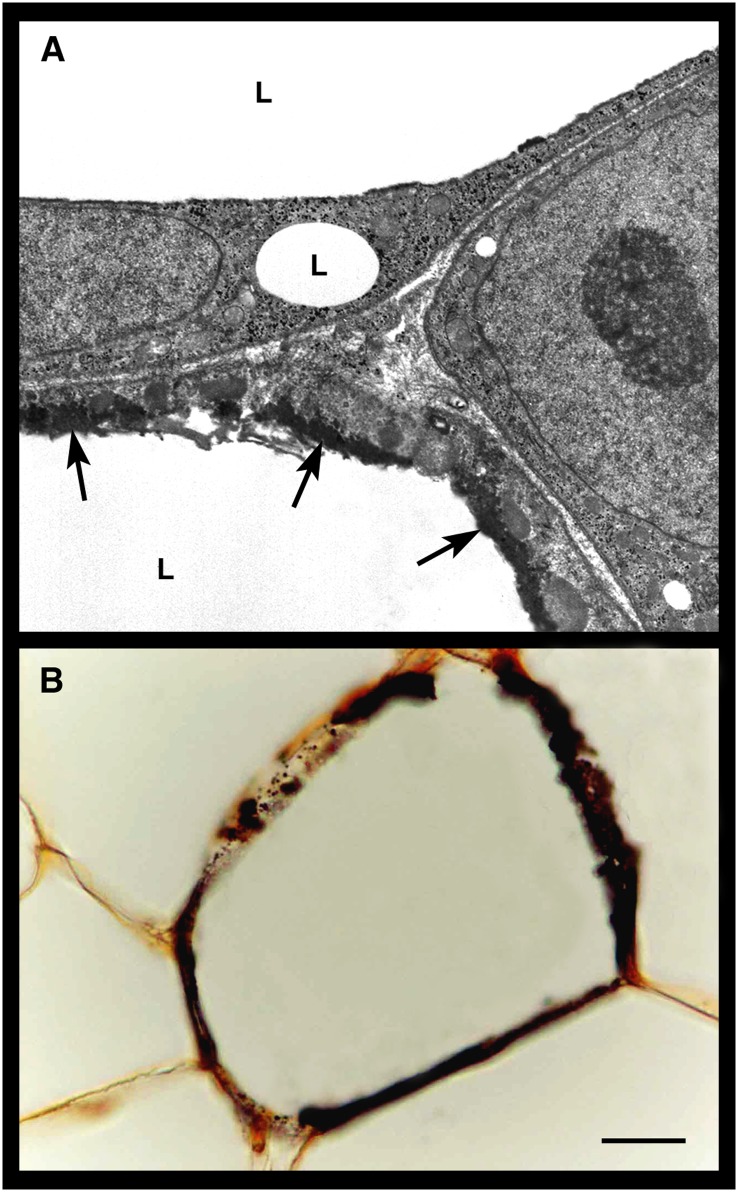
Electron dense material with the ultrastructural appearance of calcium deposits (26) was often found in hypertrophic adipocytes; in many cases, this material appeared to accumulate very close to the lipid droplet (Figs. 1D and 3A). Light-microscopy examination of paraffin-embedded sections processed for calcium-specific von Kossa staining confirmed the presence of abnormal calcium deposits in the hypertrophic adipocytes of obese mice (Fig. 3B). Finally, hypertrophic adipocytes also contained crystals with the ultrastructural appearance of cholesterol crystals (26, 27) (see below).
Fig. 3.
Calcium deposits in visceral hypertrophic adipocytes of genetically obese db/db mice. By TEM (A), the cytoplasmic rim of a hypertrophic adipocyte contains electron dense material (arrows) that has the appearance of calcium deposits and is located very close to the lipid droplet (L). By light microscopy (B), the cytoplasmic rim of a hypertrophic adipocyte is intensely stained with the brownish reaction product of calcium-specific von Kossa staining. Scale bar: 3.5 μm for (A); 15 μm for (B).
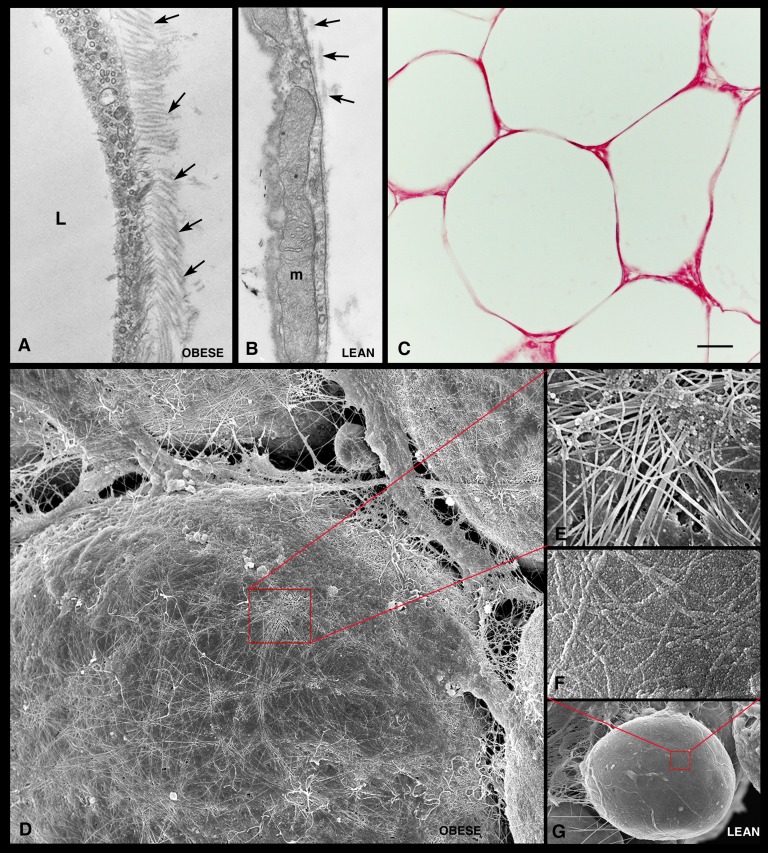
The extracellular matrix (ECM) surrounding hypertrophic adipocytes differed markedly from the ECM around control adipocytes. A greater number of collagen fibrils were found in close contact with the external surface of the basal lamina of hypertrophic adipocytes (Fig. 4A). In line with this finding, increased picrosirius red staining was noted around hypertrophic adipocytes in paraffin-embedded sections (Fig. 4C). In addition, three-dimensional evaluation performed with high-resolution scanning electron microscopy (HR-SEM) showed an intricate network of collagen fibrils on the surface of hypertrophic adipocytes (Fig. 4D, E).
Fig. 4.
Extracellular matrix of visceral adipose tissue from genetically obese mice. TEM shows numerous collagen fibrils (arrows) in close contact with the external surface of a hypertrophic adipocyte in genetically obese mice (A) and a small number of collagen fibrils on the external surface of the adipocyte basal lamina in control mice (B). By light microscopy (C), strong picrosirius red staining confirms the presence of large amounts of collagen in the extracellular matrix surrounding the hypertrophic adipocytes. HR-SEM shows an intricate network of collagen fibrils covering the surface of a hypertrophic adipocyte (D). In (G), a control adipocyte is shown for comparison. (E and F) Enlargements of the areas framed in (D) and (G), respectively. L, lipid droplet; m, mitochondria. Scale bar: 0.3 μm for (A) and (B); 30 μm for (C); 5 μm for (D); 1 μm for (E); 0.7 μm for (F); 6 μm for (G).
Hypertrophic adipocytes of genetically obese mice undergo oxidative stress
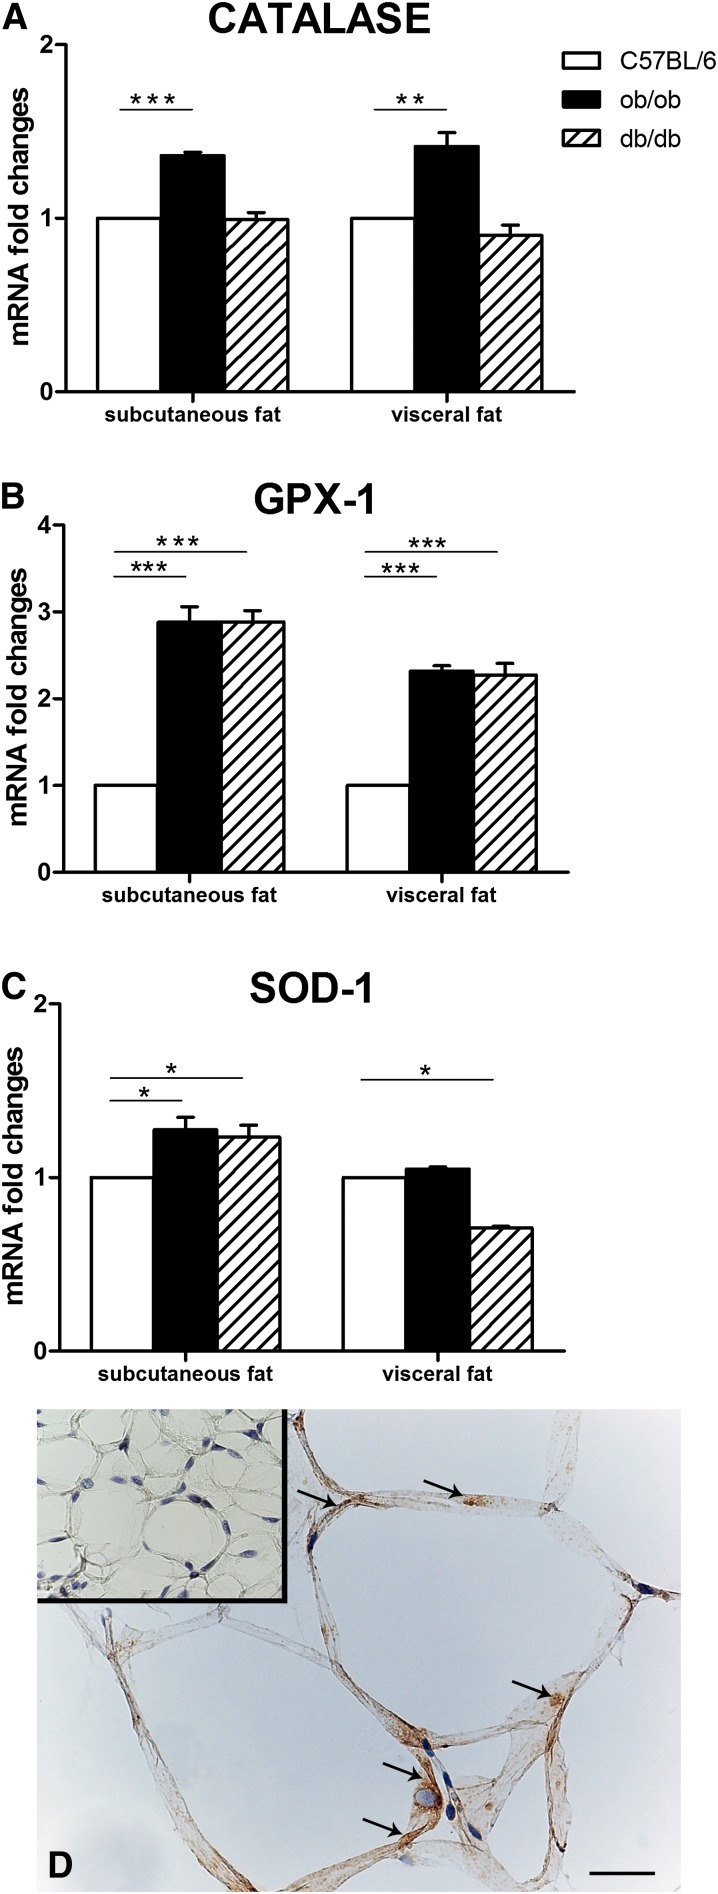
Storage of excess energy in adipocytes results in mitochondrial stress and endoplasmic reticulum disruption, commonly giving rise to oxidative stress and subsequent ROS production (5, 6). A variety of mechanisms have been developed by cells to stem the harmful effect of ROS and free radical production, including production and/or activation of the enzymes SOD-1, catalase, and GPX-1 (5). To provide evidence of the stress state of hypertrophic adipocytes of genetically obese mice, the expression of these anti-ROS enzymes was sought in the adipose depots of these animals. RT-PCR analysis showed significantly increased mRNA levels of catalase in the subcutaneous and visceral fat of ob/ob mice (Fig. 5A) and of GPX-1 in the subcutaneous and visceral adipose depots of ob/ob and db/db mice compared with lean mice (Fig. 5B). SOD-1 mRNA expression was increased in the subcutaneous depot of ob/ob and db/db mice and decreased in the visceral depot of db/db mice (Fig. 5C). All enzymes were detected in the cytoplasm of hypertrophic adipocytes by immunohistochemistry. According to RT-PCR data, catalase was strongly expressed in the mesenteric depot of ob/ob mice (Fig. 5D), whereas control mouse adipocytes were negative or very weakly stained (inset of Fig. 5D).
Fig. 5.
Expression and distribution of anti-reactive oxygen species enzymes in the subcutaneous and visceral fat of genetically obese mice. RT-PCR analysis of catalase (A), glutathione peroxidase-1 (GPX-1) (B), and superoxide dismutase-1 (SOD-1) (C). By immunohistochemistry, catalase is detectable in the cytoplasm (arrows) of hypertrophic adipocytes from the visceral fat of a db/db mouse (D), while a control mouse [inset of (D)] does not show specific staining. Mean ± SEM. *P < 0.05; *P < 0.01; *** P < 0.001. Scale bar: 37 μm for (D); 100 μm for inset of (D).
Hypertrophic adipocytes of genetically obese mice degenerate and die before CLS formation
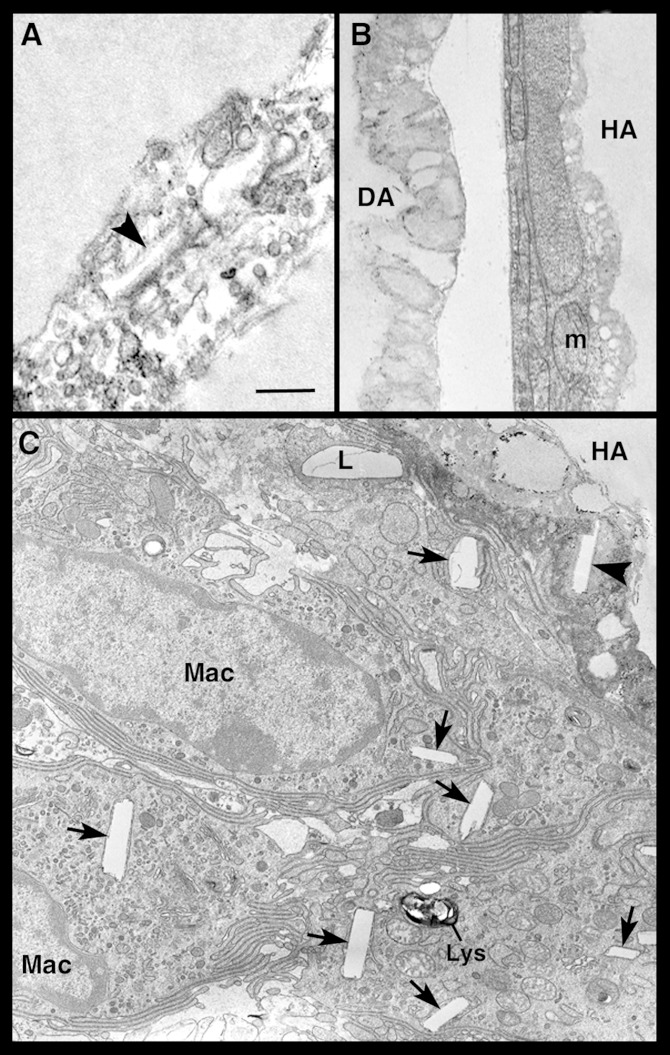
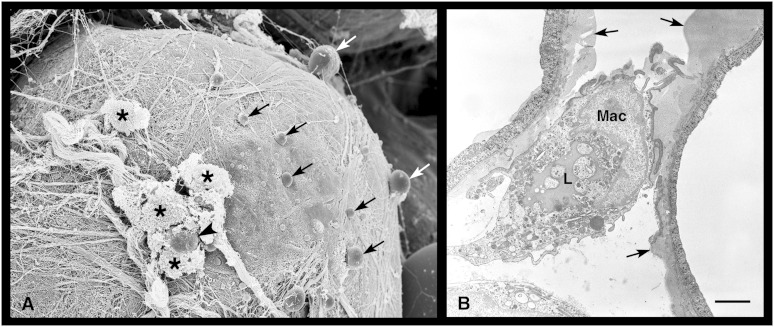
Transmission electron microscopy (TEM) occasionally demonstrated adipocytes that contained disorganized lipid-like material and cholesterol crystals in the cytoplasm and that exhibited an obvious reduction of the organelle content (Fig. 6A, B). The observation that such degenerating adipocytes were closely adjacent to well-preserved hypertrophic adipocytes (Fig. 6B) ruled out that their appearance could be due to technical artifacts. Degenerating adipocytes were perilipin-negative by immunohistochemistry. A semiquantitative assessment performed by TEM disclosed that they were quite numerous (15.6% ± 4.4) in the visceral and subcutaneous fat depots of obese mice, rare (3.15% ± 1.4) in lean db/+ and ob/+ mice, and virtually absent in lean C57BL/6 WT mice. Degenerating adipocytes sometimes seemed to extrude lipid-like material into the interstitial space, as documented by both TEM and HR-SEM (Fig. 7). Detection of free lipid droplets in the extracellular space and in neighboring macrophages suggested that the lipid-like material extruded from degenerating adipocytes was phagocytized by macrophages. Cholesterol crystals were also found in degenerating adipocytes and in surrounding macrophages (Figs. 6C and 7).
Fig. 6.
Transmission electron microscopic images of hypertrophic adipocytes in visceral fat of db/db mice. In (A), the cytoplasm of two closely apposed hypertrophic-degenerating adipocytes is disrupted, devoid of recognizable organelles, and contains vacuoles and a cholesterol crystal (arrowhead). In (B), a hypertrophic adipocyte (HA) with well-preserved organelles is found near a degenerating adipocyte (DA), whose cytoplasm lacks organelles, which are replaced by lipid-like material. In (C), several macrophages (Mac) are closely apposed to a HA containing a cholesterol crystal (arrowhead) in the degenerating cytoplasm; the macrophages contain lipid droplets (L) and numerous cholesterol crystals (arrows). m, mitochondria; lys, lysosome. Scale bar: 0.6 μm for (A); 1 μm for (B) and (C).
Fig. 7.
Extrusion of lipid droplets by degenerating adipocytes into the visceral fat of a db/db obese mouse. By HR-SEM, (A) a degenerating adipocyte is releasing several small lipid droplets (arrows) into the extracellular space. An extruded lipid droplet (arrowhead) is surrounded by some macrophages (asterisks). Note the numerous collagen fibrils covering the surface of the degenerating adipocyte. In (B), TEM shows lipid droplets being cleared by a macrophage (Mac) in an area where two adjacent degenerating adipocytes are extruding lipid droplets (arrows). Note the large lipid droplet (L) in the macrophage cytoplasm. Scale bar: 4.2 μm for (A); 1.8 μm for (B).
In summary, the hypertrophic adipocytes of ob/ob and db/db mice exhibited a number of ultrastructural abnormalities (thinning of the cytoplasmic rim, abnormal mitochondrial size and shape, expansion and dilatation of RER and Golgi complex, abnormal storage of glycogen and calcium, cholesterol crystals, and increased amounts of collagen fibrils in the extracellular space) that are highly suggestive of a cellular stress condition. This was confirmed by the increased expression of some anti-ROS enzymes. Many of these aspects were especially evident in hyperglycemic db/db mice compared with normoglycemic ob/ob animals and in visceral compared with subcutaneous adipose depots. Altogether, these morphological observations suggest a sequence of events taking place before CLS formation, as follows: 1) adipocyte hypertrophy, 2) degeneration of hypertrophic adipocytes with lipid droplet release into the extracellular space, 3) recruitment of activated macrophages, and 4) formation of multinucleated giant cells and finally of CLSs.
NLRP3 inflammasome is activated in hypertrophic adipocytes of genetically obese mice
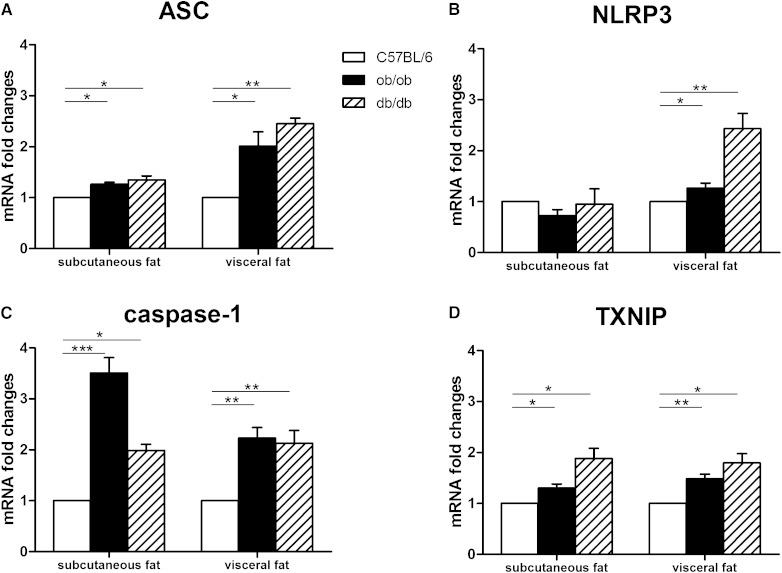
The NLRP3 inflammasome is a cytoplasmic protein complex that comprises an intracellular sensor (the NOD-like receptor), the precursor procaspase-1, and the adaptor ASC. The NLRP3 inflammasome has recently been shown to be activated in obese fat, instigating local production of the proinflammatory IL-1β and IL-18 (28). In our experiments, RT-PCR analysis showed significantly increased ASC (Fig. 8A), NLRP3 (Fig. 8B) and caspase-1 mRNA levels (Fig. 8C) in the adipose depots of obese compared with lean mice. Notably, the mRNA levels of thioredoxin (TRX)-interacting protein (TXNIP), which drives NLRP3 inflammasome activation following oxidative stress (29), were significantly increased in the subcutaneous and visceral adipose depots of genetically obese mice (Fig. 8D).
Fig. 8.
NLRP3 inflammasome activation in subcutaneous and visceral adipose tissue of genetically obese mice. RT-PCR analysis of ASC (A), NLRP3 (B), caspase-1 (C), and TXNIP (D). Mean ± SEM. *P < 0.05; **P < 0.01; ***P < 0.001.
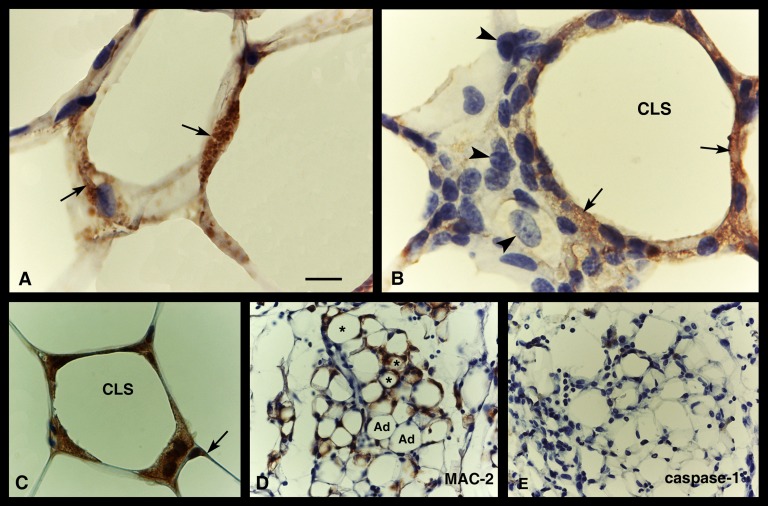
As reported above, cholesterol crystals were detected in the cytoplasm of both hypertrophic and degenerating adipocytes. They were also found in macrophages that were closely apposed to hypertrophic-degenerating adipocytes, thus providing additional evidence that the latter cells were indeed cleared by the macrophages infiltrating obese adipose tissue. Size and cholesterol content correlate positively in adipocytes (30). Thus, the larger the fat cells, the more cholesterol they contain; under certain conditions cholesterol may precipitate, giving rise to crystals (31). Cholesterol crystals are able to activate the NLRP3 inflammasome (31, 32); their formation in hypertrophic adipocytes might thus be the critical event triggering NLRP3 inflammasome activation. Immunohistochemical analysis showed caspase-1 (Fig. 9A, B), NLRP3 (not shown) and ASC (Fig. 9C) in the cytoplasm of many hypertrophic adipocytes and in CLS macrophages. Notably, caspase-1 and ASC immunoreactivity was mainly found in macrophages that were located in close apposition to adipocyte remnants, suggesting that staining might not only be due to direct protein production by macrophages but also to phagocytosis of caspase-1 and ASC-containing cytoplasmic debris from dead adipocytes. The absence of staining for these markers in macrophages not spatially close to CLSs is in line with this hypothesis (Fig. 9B). Notably, the inflammasome proteins were found neither in the adipocytes of control mice nor in the adipocytes or CLSs of FAT-ATTAC mice (Fig. 9E), a transgenic model of apoptotic adipocyte death (19, 33).
Fig. 9.
NLRP3 activation in adipose tissue of genetically obese mice. Immunohistochemistry. Caspase-1 immunostaining is evident (brownish precipitate, arrows) in hypertrophic (or degenerating) adipocytes (A) and in a CLS (B) of the visceral fat of a db/db mice: here, staining is found in macrophages surrounding the large lipid droplet but not in those lying at a distance from it (arrowheads), which are not yet engaged in lipid clearing. In (C), ASC immunoreactivity is found in a CLS, but weak staining is also visible in the cytoplasmic rim of a hypertrophic adipocyte (arrow). In (D) and (E), serial sections of visceral adipose tissue of FAT-ATTAC mice are stained with MAC-2 and caspase-1, respectively: MAC-2-positive CLSs (asterisks) and apoptotic adipocytes (Ad) are both negative for caspase-1. Scale bar: 11 μm for (A) and (B); 18 μm for (C); 22 μm for (D) and (E).
NLRP3 inflammasome is activated in hypertrophic adipocytes of HFD mice
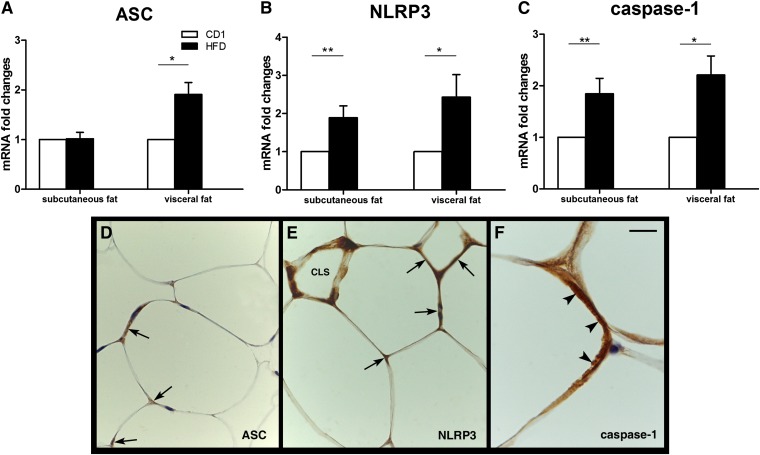
To exclude that the effects seen in ob/ob and db/db mice were peculiar to the leptin-deficient state, the investigation was extended to HFD obese mice. Macroscopically, both their visceral and subcutaneous WAT depots appeared enlarged compared with those of controls. By light microscopy, the WAT contained hypertrophic adipocytes that were especially evident and numerous in the visceral depot; indeed, the mean adipocyte area was ∼2.7 times larger in the HFD mesenteric depot and ∼1.23 times larger in the HFD subcutaneous fat compared with the corresponding control depots. MAC-2-positive CLSs were not found in the fat of control mice but were frequently detected in HFD mice (visceral fat: 129 ± 30 CLSs/10,000 adipocytes; subcutaneous fat: 128 ± 112 CLSs/10,000 adipocytes). RT-PCR analysis showed a significant increase of anti-ROS enzymes and TXNIP in the HFD fat (data not shown). A significant increase in ASC (Fig. 10A), NLRP3 (Fig. 10B), and caspase-1 (Fig. 10C) mRNAs was found in the visceral WAT of HFD mice, whereas only NLRP3 and caspase-1 were increased in their subcutaneous depot. By immunohistochemistry, ASC (Fig. 10D), NLRP3 (Fig. 10E), and caspase-1 (Fig. 10F) protein were detected in CLSs and in the cytoplasm of several subcutaneous and visceral hypertrophic adipocytes.
Fig. 10.
NLRP3 inflammasome activation in HFD obese mouse adipose tissue. Upper panels. RT-PCR analysis of ASC (A), NLRP3 (B), and caspase-1 (C). Mean ± SEM. *P < 0.05; **P < 0.01; ***P < 0.001. Bottom panels. Immunohistochemical detection of NLRP3 markers in the visceral fat of HFD mice. In (D), specific ASC immunostaining can be seen as brownish precipitate in the cytoplasm of hypertrophic adipocytes (arrows). In (E), NLRP3 is found in some hypertrophic adipocytes (arrows) and in a CLS. In (F), a hypertrophic adipocyte exhibits strong cytoplasmic staining for caspase-1 (arrowheads). Scale bar: 20 μm for (D) and (E); 7 μm for (F).
DISCUSSION
In obese animals and humans, WAT expansion is associated with a local infiltration of inflammatory cells, mainly macrophages, that give rise to low-level, chronic inflammation (14, 15). Mounting evidence suggests that adipose tissue inflammation strongly correlates with the appearance of peripheral insulin resistance and, consequently, to type-2 diabetes due to a reduction in adiponectin secretion and an increase in circulating inflammatory cytokines (1–4). Thus, chronic adipose tissue inflammation is a key element in the pathogenesis of metabolic syndrome; however, the factors that trigger and sustain the inflammatory state remain elusive.
We previously showed that the vast majority (>90%) of activated macrophages infiltrating obese adipose tissue are found around dead adipocyte remnants, giving rise to characteristic light microscopic figures that we called CLSs (16). Ultrastructurally, CLSs correspond to remnants of hypertrophic adipocytes surrounded by lipid-resorbing macrophages. Based on such morphological findings, we proposed that the death of hypertrophic adipocytes may be the trigger inducing macrophage recruitment and adipose tissue inflammation in obese mice and humans. Notably, knockout of hormone-sensitive lipase (HSL), a major lipase in mature white adipocytes, results in increased lipid storage and white adipocyte hypertrophy. As a consequence, HSL-deficient mice show adipocyte hypertrophy but not increased adipose mass or obesity (34). Also in such mice, we found typical CLSs with a frequency very similar to the one observed in obese mouse fat (16). This further observation confirms that adipocyte death is a trigger for macrophage recruitment and suggests that the mechanisms causing adipocyte death are not linked to the obese condition per se but may correlate directly to adipocyte size. Indeed, a positive correlation between adipocyte size and degree of macrophage infiltration, or CLS density, has been documented in the subcutaneous and visceral adipose depots of obese mice (14, 15, 18). Finally, the observation that visceral fat adipocytes are smaller than those of subcutaneous fat but that CLS density is greater in the visceral fat of obese animals (18) suggested to us that enlargement of white adipocytes beyond a certain depot-dependent, critical size may result in their death.
The present investigation has documented severe organelle alterations and signs of oxidative stress in the hypertrophic adipocytes of genetically obese mice. Adipocyte degeneration results in release of the cellular content into the extracellular space, and macrophage recruitment eventually leads to their removal and CLS formation. Most morphological and biochemical adipocyte changes were more marked in the hyperglycemic hyperinsulinemic db/db than the normoglycemic hyperinsulinemic ob/ob mice. Adipocytes are larger in db/db than ob/ob mice (18, 35). A positive correlation between adipocyte size and fat inflammation has been documented (15, 18), as has a correlation between fat inflammation and insulin resistance (1–4). We noted that visceral fat inflammation in db/db mice, measured as CLS density, was 3.4 times greater than that in ob/ob mice (18). Thus, the greater propensity of db/db mice to develop insulin resistance and type-2 diabetes can be explained by greater fat inflammation.
Analysis of the time course of the histomorphological changes taking place in FAT-ATTAC mice, in which white adipocyte apoptosis is induced through forced dimerization of a caspase-8 fusion protein (19, 33), disclosed an analogous sequence of morphological events: apoptotic adipocytes first exhibit organelle alterations; then they lose perilipin immunoreactivity, degenerate, and recruit neutrophils and lymphocytes; and finally, they are resorbed by macrophages in CLSs (36). Thus, the death of hypertrophic adipocytes appears to be a major event triggering macrophage recruitment and CLS formation in both genetic obesity and in the adipose tissue-specific apoptosis model.
NOD-like receptors (NLR) comprise a large family of intracellular proteins that are involved not only in the innate immune response to microbial pathogens (through the recognition of conserved pathogen-associated molecular patterns) but also in sterile inflammation by sensing “danger signals” (i.e., endogenous molecules produced during cell and tissue damage). NLRP3 is currently the most fully characterized inflammasome, consisting of the NLRP3 scaffold, the ASC (PYCARD) adaptor, and caspase-1. NLRP3 activation results in production of activated caspase-1, which in turn processes the cytosolic precursors of the proinflammatory cytokines IL-1β and IL-18, which are secreted as biologically active cytokines. In diet-induced obesity, in genetically obese mice (ob/ob and db/db), and in obese humans, the NLRP3-inflammasome is activated in both visceral and subcutaneous fat and drives local production of IL-1β and IL-18 (28, 37). In particular, IL-1β is elevated in obese individuals and rodents; it is also strongly implicated in impaired insulin secretion by pancreatic β-cells (38) and in disruption of insulin signaling at cellular targets (39). Notably, blockade of IL-1β signaling by Anakinra, a specific recombinant human receptor antagonist, in patients with type-2 diabetes (40) and administration of anti-IL-1β antibodies to mice with diet-induced obesity (41) lead to a sustained reduction of systemic inflammation and to significantly improved glycemic control. That NLRP3-dependent caspase-1 activation and production of inflammatory cytokines play a prominent role in metabolic syndrome has recently been confirmed in mice lacking NLRP3, ASC, or caspase-1, which are resistant to the development of high-fat diet-induced obesity and insulin resistance (42).
Caspases are cysteine proteases. They are tightly controlled by inflammasome proteolytic activation, and they initiate or execute cellular programs, leading to inflammation or cell death (43). Caspase-1 is a proinflammatory caspase whose activity can result in a highly inflammatory form of cell death known as pyroptosis (44). At the cellular level, pyroptosis is characterized by plasma membrane rupture, water influx, cellular swelling, osmotic lysis, and release of proinflammatory cellular content. Although it is considered as a form of programmed cell death, pyroptosis is different from apoptosis, which is an immunologically silent programmed cell death. Although the mechanisms underpinning this process are not clear, the rate of pyroptosis appears to increase with increasing inflammasome stimulation (45). We confirmed NLRP3 inflammasome activation and the presence of active caspase-1 in adipose tissue in genetically leptin-deficient and HFD obese mice. ASC, NLRP3, and caspase-1 were detected by immunohistochemistry in the macrophages forming CLSs, as reported by other researchers (28), but strong immunoreactivity was also found in hypertrophic adipocytes. This finding is in line with in vitro observations showing that caspase-1 is upregulated during adipocyte differentiation and directs adipocytes toward a more insulin-resistant phenotype (37) and with in vivo data showing high levels of caspase-1 protein in the fat of ob/ob mice (46).
A distinctive ultrastructural feature of the hypertrophic and degenerating adipocytes observed in this study were cholesterol crystals in the cytoplasm. Even though a causal link has not yet been demonstrated, such crystals may constitute a “danger signal” capable of activating the NLRP3 inflammasome (31, 32). It may be speculated that NLRP3 inflammasome activation in hypertrophic adipocytes is triggered by the cholesterol crystals, which ultimately drive cells to pyroptosis. Importantly, in FAT-ATTAC mice, the apoptotic mode of cell death of hypertrophic adipocytes is not characterized by formation of cholesterol crystals (36); accordingly, the hypertrophic adipose tissue shows no signs of NLRP3 inflammasome or caspase-1 activation (present results). Data from different experimental settings suggest that, in addition to cholesterol crystals, other factors may activate the NLRP3 inflammasome in hypertrophic adipocytes, including extracellular ATP and high glucose concentrations, which may follow rupture of adipocyte cell membranes (29, 47), and increased ROS and free radical production, as also suggested by the increased expression of anti-ROS enzymes detected in our tissue samples. The latter is consistent with the increased expression of TXNIP in the adipose tissue of obese mice (29). Recently, increased intracellular Ca2+ also has been shown to activate the NLRP3 inflammasome (48).
In conclusion, the evidence collected in the present work lends support to the hypothesis that, in obesity, hypertrophic adipocytes exhibit ultrastructural and biochemical alterations, including cholesterol crystals and accumulation of calcium and ROS, that might trigger the NLRP3 inflammasome pathway with subsequent massive activation of caspase-1, which ultimately results in adipocyte death from pyroptosis. Pyroptosis, the inflammatory mode of cell death, promotes recruitment of inflammatory cells, including macrophages, whose prolonged presence and sustained activity in obese fat is needed to clear the extracellular space of lipid material, including cholesterol crystals, released by degenerating adipocytes. In the visceral fat of obese mice, this process can be accelerated by the smaller death size of hypertrophic adipocytes, thus offering a biological basis for the more severe clinical outcomes associated with visceral fat increase. Recently, it has been suggested that the mild inflammation found in obesity may, to some extent, depend on the leakage of gut microbiota endotoxins into the circulation (49), resulting in nuclear factor (NF)-κB activation in adipocytes and release of proinflammatory cytokines (50). Nonetheless, the distinctive histopathological findings presented here and the sequence of cellular events they suggest point to a dysregulation of adipocyte storage capability and size as the primary triggers of adipose tissue inflammation.
Acknowledgments
The authors are grateful to Prof. A. Riva for his advice on scanning electron microscopy studies and to L. Gobbi for technical assistance in the laboratory of high resolution-scanning electron microscopy.
Footnotes
Abbreviations:
- CLS
- crown-like structure
- FAT-ATTAC
- fat apoptosis through targeted activation of caspase-8
- HFD
- high-fat diet
- HOMA
- Homeostasis Model Assessment
- HR-SEM
- high-resolution scanning electron microscopy
- IL
- interleukin
- NLRP3
- nucleotide-binding oligomerization domain (NOD)-like receptor (NLR)-3
- RER
- rough endoplasmic reticulum
- ROS
- reactive oxygen species
- TEM
- transmission electron microscopy
- TRXNIP
- thioredoxin-interacting protein
- WAT
- white adipose tissue
- WT
- wild-type
This work was supported by grants from Marche Polytechnic University (Contributi Ricerca Scientifica), the European Commission's Seventh Framework Programme for Research and Technological Development (EU FP7) project DIABAT (HEALTH-F2-2011-278373), and the Italian Ministry of University (PRIN 2010-11 to S.C.).
REFERENCES
- 1.Olefsky J. M., Glass C. K. 2010. Macrophages, inflammation, and insulin resistance. Annu. Rev. Physiol. 72: 219–246. [DOI] [PubMed] [Google Scholar]
- 2.Item F., Konrad D. 2012. Visceral fat and metabolic inflammation: the portal theory revisited. Obes. Rev. 13(Suppl. 2): 30–39. [DOI] [PubMed] [Google Scholar]
- 3.Johnson A. M. F., Olefsky J. M. 2013. The origins and drivers of insulin resistance. Cell. 152: 673–684. [DOI] [PubMed] [Google Scholar]
- 4.Smorlesi A., Frontini A., Giordano A., Cinti S. 2012. The adipose organ: white-brown adipocyte plasticity and metabolic inflammation. Obes. Rev. 13(Suppl. 2): 83–96. [DOI] [PubMed] [Google Scholar]
- 5.Patti M. E., Corvera S. 2010. The role of mitochondria in the pathogenesis of type 2 diabetes. Endocr. Rev. 31: 364–395. [DOI] [PMC free article] [PubMed] [Google Scholar]
- 6.Codoner-Franch P., Valls-Bellés V., Arilla-Codoner A., Alonso-Iglesias E. 2011. Oxidant mechanisms in childhood obesity: the link between inflammation and oxidative stress. Transl. Res. 158: 369–384. [DOI] [PubMed] [Google Scholar]
- 7.Hummasti S., Hotamisligil G. S. 2010. Endoplasmic reticulum stress and inflammation in obesity and diabetes. Circ. Res. 107: 579–591. [DOI] [PubMed] [Google Scholar]
- 8.Corvera S., Czech M. P. 2011. Tensions rise and blood flows over dysfunctional fat. Circulation. 124: 13–16. [DOI] [PMC free article] [PubMed] [Google Scholar]
- 9.Hardy O. T., Czech M. P., Corvera S. 2012. What causes the insulin resistance underlying obesity? Curr. Opin. Endocrinol. Diabetes Obes. 19: 81–87. [DOI] [PMC free article] [PubMed] [Google Scholar]
- 10.Trayhurn P. 2013. Hypoxia and adipose tissue function and dysfunction in obesity. Physiol. Rev. 93: 1–21. [DOI] [PubMed] [Google Scholar]
- 11.Halberg N., Khan T., Trujillo M. E., Wernstedt-Asterholm I., Attie A. D., Sherwani S., Wang Z. V., Landskroner-Eiger S., Dineen S., Magalang U. J., et al. 2009. Hypoxia-inducible factor 1alpha induces fibrosis and insulin resistance in white adipose tissue. Mol. Cell. Biol. 29: 4467–4483. [DOI] [PMC free article] [PubMed] [Google Scholar]
- 12.Divoux A., Clément K. 2011. Architecture and the extracellular matrix: the still unappreciated components of the adipose tissue. Obes. Rev. 12: e494–e503. [DOI] [PubMed] [Google Scholar]
- 13.Tchernof A., Després J. P. 2013. Pathophysiology of human visceral obesity: an update. Physiol. Rev. 93: 359–404. [DOI] [PubMed] [Google Scholar]
- 14.Xu H., Barnes G. T., Yang Q., Tan G., Yang D., Chou C. J., Sole J., Nichols A., Ross J. S., Tartaglia L. A., et al. 2003. Chronic inflammation in fat plays a crucial role in the development of obesity-related insulin resistance. J. Clin. Invest. 112: 1821–1830. [DOI] [PMC free article] [PubMed] [Google Scholar]
- 15.Weisberg S. P., McCann D., Desai M., Rosenbaum M., Leibel R. L., Jr Ferrante A. W. 2003. Obesity is associated with macrophage accumulation in adipose tissue. J. Clin. Invest. 112: 1796–1808. [DOI] [PMC free article] [PubMed] [Google Scholar]
- 16.Cinti S., Mitchell G., Barbatelli G., Murano I., Ceresi E., Faloia E., Wang S., Fortier M., Greenberg A. S., Obin M. S. 2005. Adipocyte death defines macrophage localization and function in adipose tissue of obese mice and humans. J. Lipid Res. 46: 2347–2355. [DOI] [PubMed] [Google Scholar]
- 17.Strissel K. J., Stancheva Z., Miyoshi H., Perfield J. W., 2nd, DeFuria J., Jick Z., Greenberg A. S., Obin M. S. 2007. Adipocyte death, adipose tissue remodelling, and obesity complications. Diabetes. 56: 2910–2918. [DOI] [PubMed] [Google Scholar]
- 18.Murano I., Barbatelli G., Parisani V., Latini C., Muzzonigro G., Castellucci M., Cinti S. 2008. Dead adipocytes, detected as crown-like structures, are prevalent in visceral fat depots of genetically obese mice. J. Lipid Res. 49: 1562–1568. [DOI] [PubMed] [Google Scholar]
- 19.Pajvani U. B., Trujillo M. E., Combs T. P., Iyengar P., Jelicks L., Roth K. A., Kitsis R. N., Scherer P. E. 2005. Fat apoptosis through targeted activation of caspase 8: a new mouse model of inducible and reversible lipoatrophy. Nat. Med. 11: 797–803. [DOI] [PubMed] [Google Scholar]
- 20.Riva A., Congiu T., Faa G. 1993. The application of the OsO4 maceration method to the study of human bioptic material. A procedure avoiding freeze-fracture. Microsc. Res. Tech. 26: 526–527. [DOI] [PubMed] [Google Scholar]
- 21.Riva A., Congiu T., Loffredo F., Testa Riva F. 1996. Further data on intracellular structures of human salivary glands. A SEM study. Eur. J. Morphol. 34: 209–214. [DOI] [PubMed] [Google Scholar]
- 22.Rungby J., Kassem M., Eriksen E. F., Dansker G. 1993. The von kossa reaction for calcium deposits: silver lactate staining increases sensitivity and reduces background. Histochem. J. 25: 446–451. [DOI] [PubMed] [Google Scholar]
- 23.Lin S. L., Kisseleva T., Brenner D. A., Duffield J. S. 2008. Perycytes and perivascular fibroblasts are the primary source of collagen-producing cells in obstructive fibrosis of the kidney. Am. J. Pathol. 173: 1617–1627. [DOI] [PMC free article] [PubMed] [Google Scholar]
- 24.Souza S. C., de Vargas L. M., Yamamato M. T., Line P., Franciosa M. D., Moss L. G., Greenberg A. S. 1998. Overexpression of perilipin A and B blocks the ability of tumor necrosis factor to increase adipocyte lipolysis in 3T3-L1 adipocytes. J. Biol. Chem. 273: 24665–24669. [DOI] [PubMed] [Google Scholar]
- 25.Londos C., Brasaemle D., Schultz C., Segrest J., Kimmel A. 1999. Perilipins, ADRP, and other proteins that associate with intracellular neutral lipid droplets in animal cells. Semin. Cell Dev. Biol. 10: 51–58. [DOI] [PubMed] [Google Scholar]
- 26.Ghadially F. N. 1988. Ultrastructural Pathology of the Cell and Matrix. Butterworths, London. [Google Scholar]
- 27.Silva F. G. 2005. Non-neoplastic Kidney Diseases. American Registry of Pathology, Washington. [Google Scholar]
- 28.Vandanmagsar B., Youm Y. H., Ravussin A., Galgani J. E., Stadler K., Mynatt R. L., Ravussin E., Stephens J. M., Dixit V. D. 2011. The NALP3/NLRP3 inflammasome instigates obesity-induced autoinflammation and insulin resistance. Nat. Med. 17: 179–188. [DOI] [PMC free article] [PubMed] [Google Scholar]
- 29.Zhou R., Tardivel A., Thorens B., Choi I., Tschopp J. 2010. Thioredoxin-interactin protein links oxidative stress to inflammasome activation. Nat. Immunol. 11: 136–140. [DOI] [PubMed] [Google Scholar]
- 30.Krause B. R., Hartman A. D. 1984. Adipose tissue and cholesterol metabolism. J. Lipid Res. 25: 97–110. [PubMed] [Google Scholar]
- 31.Duewell P., Kono H., Rayner K. J., Sirois C. M., Vladimer G., Bauernfeind F. G., Abela G. S., Franchi L., Nuñez G., Schnurr M., et al. 2010. NLRP3 inflammasomes are required for atherogenesis and activated by cholesterol crystals. Nature. 464: 1357–1361. [DOI] [PMC free article] [PubMed] [Google Scholar]
- 32.Rajamaki K., Lappalainen J., Oorni K., Valimaki E., Matikainen S., Kovanen P. T., Eklund K. K. 2010. Cholesterol crystals activate the NLRP3 inflammasome in human macrophages: a novel link between cholesterol metabolism and inflammation. PLoS ONE. 5: e11765. [DOI] [PMC free article] [PubMed] [Google Scholar]
- 33.Trujillo M. E., Pajvani U. B., Scherer P. E. 2005. Apoptosis through targeted activation of caspase 8 (“ATTAC-mice”): novel mouse models of inducible and reversible tissue ablation. Cell Cycle. 4: 1141–1145. [DOI] [PubMed] [Google Scholar]
- 34.Wang S. P., Laurin N., Himms-Hagen J., Rudnicki M. A., Levy E., Robert M. F., Pan L., Oligny L., Mitchell G. A. 2001. The adipose tissue phenotype of hormone-sensitive lipase deficiency in mice. Obes. Res. 9: 119–128. [DOI] [PubMed] [Google Scholar]
- 35.Johnson P. R., Hirsch J. 1972. Cellularity of adipose depots in six strains of genetically obese mice. J. Lipid Res. 13: 2–11. [PubMed] [Google Scholar]
- 36.Murano I., Rutkowski J. M., Wang Q. A., Cho Y-R., Scherer P. E., Cinti S. 2012. Time course of histomorphological changes in adipose tissue upon acute lipoatrophy. Nutr. Metab. Cardiovasc. Dis. 23: 723–731. [DOI] [PMC free article] [PubMed] [Google Scholar]
- 37.Stienstra R., Joosten L. A., Koenen T., van Tits B., van Diepen J. A., van den Berg S. A., Rensen P., Voshol P. J., Fantuzzi G., Hijmans A., et al. 2010. The inflammasome-mediated caspase-1 activation controls adipocyte differentiation and insulin sensitivity. Cell Metab. 12: 593–605. [DOI] [PMC free article] [PubMed] [Google Scholar]
- 38.Dinarello C. A., Donath M. Y., Mandrup-Poulsen T. 2010. Role of IL-1beta in type 2 diabetes. Curr. Opin. Endocrinol. Diabetes Obes. 17: 314–321. [DOI] [PubMed] [Google Scholar]
- 39.Jager J., Grémeaux T., Cormont M., Le Marchand-Brustel Y., Tanti J. F. 2007. Interleukin-1beta-induced insulin resistance in adipocytes through down regulation of insulin receptor substrate-1 expression. Endocrinology. 148: 241–251. [DOI] [PMC free article] [PubMed] [Google Scholar]
- 40.Larsen C. M., Faulenbach M., Vaag A., Volund A., Ehses J. A., Seifert B., Mandrup-Poulsen T., Donath M. Y. 2007. Interleukin-1-receptor antagonist in type 2 diabetes mellitus. N. Engl. J. Med. 356: 1517–1526. [DOI] [PubMed] [Google Scholar]
- 41.Osborn O., Brownell S. E., Sanchez-Alavez M., Salomon D., Gram H., Bartfai T. 2008. Treatment with an interleukin 1 beta antibody improves glycemic control in diet-induced obesity. Cytokine. 44: 141–148. [DOI] [PMC free article] [PubMed] [Google Scholar]
- 42.Stienstra R., van Diepen J. A., Tack C. J., Zaki M. H., van de Veerdonk F. L., Perera D., Neale G. A., Hooiveld G. J., Hijmans A., Vroegrijk I., et al. 2011. Inflammasome is a central player in the induction of obesity and insulin resistance. Proc. Natl. Acad. Sci. USA. 108: 15324–15329. [DOI] [PMC free article] [PubMed] [Google Scholar]
- 43.Martinon F., Tschopp J. 2007. Inflammatory caspases and inflammasomes: master switches of inflammation. Cell Death Differ. 14: 10–22. [DOI] [PubMed] [Google Scholar]
- 44.Bergsbaken T., Fink S. L., Cookson B. T. 2009. Pyroptosis: host cell death and inflammation. Nat. Rev. Microbiol. 7: 99–109. [DOI] [PMC free article] [PubMed] [Google Scholar]
- 45.Schroder K., Tschopp J. 2010. The inflammasomes. Cell. 140: 821–832. [DOI] [PubMed] [Google Scholar]
- 46.Koenen T. B., Stienstra R., Van Tits L. J., De Graaf J., Stalenhoef A. F. H., Joosten L. A. B., Tack C. J., Netea M. G. 2011. Hyperglycemia activates caspase-1 and TXNIP-mediated IL-1β transcription in human adipose tissue. Diabetes. 60: 517–524. [DOI] [PMC free article] [PubMed] [Google Scholar]
- 47.Mariathasan S., Weiss D. S., Newton K., McBride J., O'Rourke K., Roose-Girma M., Lee W. P., Weinrauch Y., Monack D. M., Dixit V. M. 2006. Cryopyrin activates the inflammasome in response to toxins and ATP. Nature. 440: 228–232. [DOI] [PubMed] [Google Scholar]
- 48.Lee G. S., Subramanian N., Kim A. I., Aksentijevich I., Goldbach-Mansky R., Sacks D. B., Germain R. N., Kastner D. L., Chae J. J. 2012. The calcium-sensing receptor regulates the NLRP3 inflammasome trough Ca++ and cAMP. Nature. 492: 123–127. [DOI] [PMC free article] [PubMed] [Google Scholar]
- 49.Cani P. D., Amar J., Iglesias M. A., Poggi M., Knauf C., Bastelica D., Neyrinck A. M., Fava F., Tuohy K. M., Chabo C., et al. 2007. Metabolic endotoxemia initiates obesity and insulin resistance. Diabetes. 56: 1761–1772. [DOI] [PubMed] [Google Scholar]
- 50.Rodríguez-Calvo R., Serrano L., Coll T., Moullan N., Sánchez R. M., Merlos M., Palomer X., Laguna J. C., Michalik L., Wahli W., et al. 2008. Activation of peroxisome proliferator-activated receptor beta/delta inhibits lipopolysaccharide-induced cytokine production in adipocytes by lowering nuclear factor-kappaB activity via extracellular signal-related kinase 1/2. Diabetes. 57: 2149–2157. [DOI] [PMC free article] [PubMed] [Google Scholar]


