

Abstract
Studies of macrophage biology have been significantly advanced by the availability of cell lines such as RAW264.7 cells. However, it is unclear how these cell lines differ from primary macrophages such as thioglycolate-elicited peritoneal macrophages (TGEMs). We used the inflammatory stimulus Kdo2-lipid A (KLA) to stimulate RAW264.7 and TGEM cells. Temporal changes of lipid and gene expression levels were concomitantly measured and a systems-level analysis was performed on the fold-change data. Here we present a comprehensive comparison between the two cell types. Upon KLA treatment, both RAW264.7 and TGEM cells show a strong inflammatory response. TGEM (primary) cells show a more rapid and intense inflammatory response relative to RAW264.7 cells. DNA levels (fold-change relative to control) are reduced in RAW264.7 cells, correlating with greater downregulation of cell cycle genes. The transcriptional response suggests that the cholesterol de novo synthesis increases considerably in RAW264.7 cells, but 25-hydroxycholesterol increases considerably in TGEM cells. Overall, while RAW264.7 cells behave similarly to TGEM cells in some ways and can be used as a good model for inflammation- and immune function-related kinetic studies, they behave differently than TGEM cells in other aspects of lipid metabolism and phenotypes used as models for various disorders such as atherosclerosis.
Keywords: primary macrophage, toll-like receptor 4, transcriptomics, lipidomics, inflammation, lipid and signaling networks, cell cycle, correlation analysis
Macrophages are versatile immune system cells that play indispensable roles in both the innate and adaptive immune responses. They exhibit various immune responses to pathogenic challenge, such as phagocytosis, cytokine secretion, antigen presentation, and adherence. They produce a variety of lipids (e.g., eicosanoids and sphingolipids) as signaling molecules during inflammatory responses. Moreover, macrophages play a central role as modulators of both cholesterol homeostasis and innate immune responses in atherosclerosis. Because of their wide range of functions, macrophages have been extensively studied in order to understand their role in immune response and lipid metabolism (1–8). The LIPID MAPS Consortium utilized macrophages to study the kinetics of hundreds of distinct lipid molecules in the inflammatory response to the activation of the toll-like receptor (TLR)4.
The RAW264.7 cell line, derived from pristane-elicited murine peritoneal macrophages transformed with Abelson leukemia virus (9), has been widely used in the study of macrophage cellular physiology because of their ease of culture, rapid growth rate, and phenotypic resemblance to primary macrophages such as thioglycolate-elicited peritoneal macrophages (TGEMs) and bone marrow-derived macrophages (BMDMs). However, it is still unclear to what extent this transformation has affected the macrophage-like function of the RAW264.7 cells or if immortalized cell lines show the same phenotypes as primary cells. Some studies have shown differences between the cell types with the focus on a number of genes important to macrophage function. For example, qualitative, quantitative, and kinetic differences were found in the prostaglandin (PG) synthetic response of lipopolysaccharide (LPS)-treated RAW264.7 cells versus peritoneal macrophages (10). Also RAW264.7 cells produce much greater quantities of tumor necrosis factor (TNF)α in response to LPS than peritoneal macrophages, primarily because they fail to demonstrate PG-dependent autocrine regulation of TNFα secretion (11). Peroxisome proliferator-activated receptor (PPAR)γ, a nuclear receptor with anti-inflammatory functions, is barely detectable in RAW264.7 cells (12, 13), but it is highly expressed in TGEM cells (13). IL-12p70 and interferon (IFN)-γ are not produced by RAW264.7 cells upon LPS stimulation (14). Caveolin-1 (Cav1), which is essential for the assembly of caveolae and involved in the maintenance of cellular cholesterol homeostasis and lipid transport (15), is upregulated in peritoneal macrophages in response to LPS but downregulated in RAW264.7 cells (16, 17). In RAW264.7 cells, Cav1 is negatively regulated by the Ras-p42/44 mitogen-activated protein kinase (MAPK) pathway, which is involved in proliferation and activated by v-abl during Abelson virus transformation (18). Apolipoprotein E (ApoE) is secreted in TGEMs and BMDMs but not in macrophage-like cell lines, including J774.2 and RAW264.7 (19, 20).
In general, the question of whether cell lines can exhibit a majority of phenotypes displayed by their parent primary cells is an important problem in cell biology. Specifically, we pose the question whether the RAW264.7 cells are comparable to macrophage primary cells, namely TGEMs, which are used extensively in macrophage research, in displaying similar phenotypes. While prior research has amply demonstrated that some characteristic phenotypes such as cytokine activation and macrophage markers are common to the cell line and primary cells, it would be of value to examine in detail a multiplicity of intermediate phenotypes. We consider the transcriptional responses and lipidomic changes to activation as a function of time to be important phenotypes in macrophage cells. In this study we use Kdo2-lipid A (KLA), a nearly homogeneous LPS substructure with endotoxin activity equal to that of native LPS (21), to activate RAW264.7 cells and TGEM cells. Time course data for microarray-based gene expression and lipid measurements from 0.5 to 24 h after treatment with KLA were employed as functional readouts. The systematic assessment reveals several common as well as unique signatures of these two types of cells. Unless specified, the changes in lipid and gene expression levels refer to the fold-change upon KLA treatment with respect to their controls (no treatment).
MATERIALS AND METHODS
Transcriptomic and lipidomic measurements
RAW264.7 and TGEM cells were treated with KLA at t = 0 h. mRNA levels were measured at 0.5, 1, 2, 4, 8, 12, and 24 h using Agilent microarrays. Lipid measurements were carried out in both cell types at t = 0 h and at these seven time points. Gene expression fold-change data and lipid data is available through the LIPID MAPS Consortium's website (22, 23). Additional details of the experiments (cell culture and treatment, RNA and cDNA preparation, microarray experiments, and lipid measurements) are provided in the supplementary Materials and Methods. A description of the methods for statistical analysis of microarray data, and pathway-level comparison of the gene data for the two cell types using paired Student's t-test, Shapiro-Wilk test, and two-sample Kolmogorov-Smirnov test is also provided in the supplementary Materials and Methods.
Use of Pearson correlation and a distance-based correlation to find differently regulated genes
Pearson correlation represents the similarity between the shapes of two time courses (or data sequences in general). Such a correlation is not sufficient to decide whether or not two time courses differ significantly from each other. For example, despite the similarity of shapes, if the data values in first time series mostly remain positive and remain negative in the second time series, then one would classify them as significantly different. Hence, a novel correlation that includes the effect of sign (direction) of the time courses and the effect of magnitude of the data values is developed and used here.
Let and be two vectors, where and are the log2-fold-change values at time (ith time point or sample) for a gene in two different experiments. The Euclidean distance between the vectors x and y is given by:
| (Eq. 1) |
Define a magnification factor, f, as:
| (Eq. 2) |
. The function is used as a smooth approximation of the sign function (24). The parameter sigma1 controls the smoothness. Now, we can define the amplified-distance-based correlation as:
| (Eq. 3) |
The parameter controls how fast the correlation should decrease with increasing distance. Such an approach to computing magnitude-based similarity has been earlier used for signal processing and similarity-search-based fault identification in chemical processes (25).
For comparing the gene data from RAW264.7 and TGEM cells, , , and p = 1 are used. We have found empirically that p = 1 gives good results in terms of differentiating between two time courses. In our analysis, the minimum of Pearson correlation and distance-based correlation {i.e., } is used for filtering the genes to find the list of uniquely regulated genes among the two cell types.
RESULTS
Overall transcriptional responses
In the microarray experiments studying the gene expression changes in RAW264.7 and TGEM cells upon KLA treatment, 20,932 annotated mouse genes were probed. Cyber-T microarray analysis (26), a variance-modeling approach, was applied to identify significantly regulated genes. A gene is identified as significantly regulated if its fold-change upon KLA treatment is at least 2 and the p-value is less than 0.01. Figure 1 shows the number of genes significantly up- or downregulated in RAW264.7 and TGEM cells at various times upon treatment with KLA at t = 0 h. Among 20,932 common genes, 825 genes are significantly regulated in RAW264.7 cells after 4 h, and 1,839 genes after 24 h; 1,853 genes are significantly regulated in TGEM cells after 4 h, and 1,373 genes after 24 h (supplementary Table I). Thus, the general trend is that transcriptional response of TGEM cells peaks at around 4 h, whereas for RAW264.7 cells, it keeps increasing until 24 h. The number of genes upregulated and the number of genes downregulated in the two cell types also follow a similar profile. For example, in RAW264.7 cells, both the number of upregulated genes and the number of downregulated genes increases until 24 h (1,040 genes upregulated and 799 genes downregulated at 24 h). On the other hand, in TGEM cells, the number of upregulated genes peaks at 4 h (1,191 genes) and the number of downregulated genes peaks around 8 h (662 genes at 4 h and 758 genes at 8 h). Another observation is that at any time point, the number of genes upregulated is higher than the number of genes downregulated. Transcriptomic changes are also reflected at the proteomic level in RAW264.7 cells (27, 28).
Fig. 1.
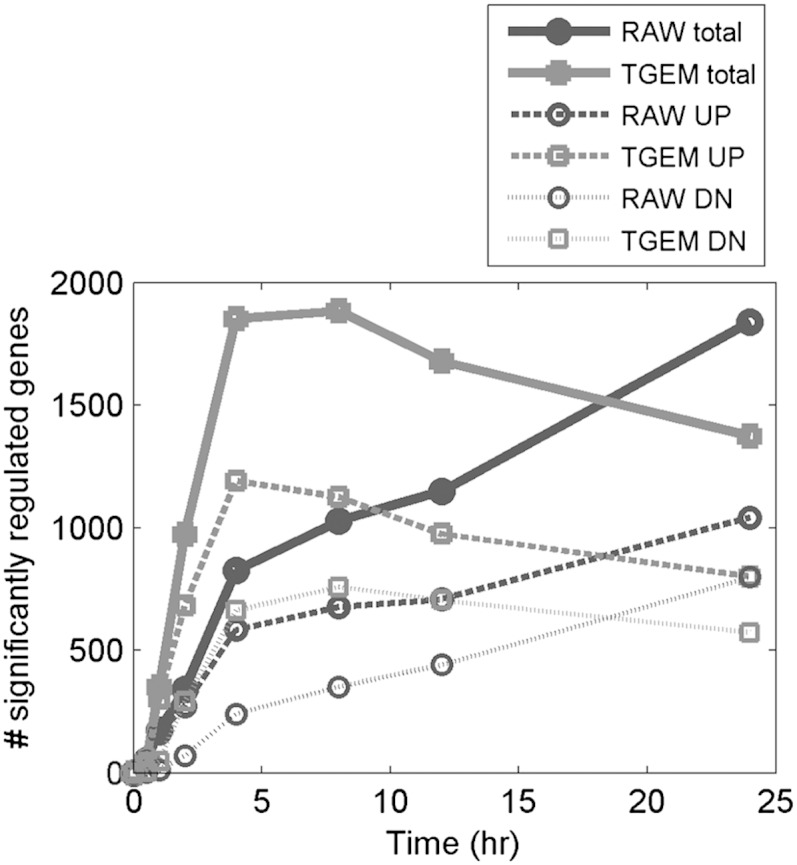
Number of significantly upregulated (UP) and downregulated (DN) genes in RAW264.7 (RAW) and TGEM cells after KLA treatment.
Comparison of the transcriptomic responses at the individual gene level
A gene is defined as being commonly regulated between two cells when it is significantly up- or downregulated in both cells. A gene is defined as being uniquely regulated in one cell when it is significantly upregulated in one cell, but not upregulated in the other cell (not significantly regulated or downregulated); or when it is downregulated in one cell, but not downregulated in the other cell (not significantly regulated or upregulated). Supplementary Fig. I shows the Venn diagram of uniquely and commonly regulated genes for RAW264.7 and TGEM cells.
Commonly regulated genes.
At 1 h, 119 genes are commonly regulated between the RAW264.7 and TGEM cells. The number of commonly regulated genes peaks to 550 at 4 h and then decreases slowly to 404 at 24 h. At 4 h, out of the 550 genes commonly regulated, 437 genes are commonly upregulated in both cell types while only 113 genes are commonly downregulated. At 24 h, out of the 404 genes commonly regulated, 304 genes are commonly upregulated and only 100 genes are commonly downregulated. Some commonly regulated genes are highly upregulated with more than 50-fold at one or more points during 4–24 h. Most of these genes are known to be related to immune response, such as various chemokines [examples are: chemokine (C-X-C motif) ligand (Cxcl)2; 126- and 66-fold at 4 h in RAW264.7 and TGEM cells, respectively and Cxcl10], interferon-induced protein with guanylate nucleotide binding proteins (Gbp3 and Gbp5), interferon-induced protein with tetratricopeptide repeats 1 and 2 [Ifit1 (79- and 170-fold at 4 h in RAW and TGEM cells) and Ifit2], immunoresponsive gene 1 (Irg1), interleukin 1β (Il1b), Schlafens [Slfn4 (schlafen 4); 59-fold in TGEM cells at 24 h], etc. The highly upregulated genes with geometric mean of the fold changes greater than 7.5 are listed in supplementary Table II.
To investigate the rationale for these findings at a biological level, gene enrichment analysis was performed. Here, the enrichment factor (EF) of commonly regulated genes for a pathway is the ratio of the fraction of such genes in this pathway over the fraction of all commonly regulated genes among the 20,932 genes examined. The computation of the EF and its p-value is described in detail in the Materials and Methods section. A subset of this analysis is presented in Table 1, illustrating the commonly regulated genes that are enriched at least 5-fold in various immune and inflammatory responses and related diseases at 4 h and 24 h. For example, TLR signaling pathway is enriched more than 12-fold at 4 h and 24 h. Pathway enrichment p-values for all time points are listed in supplementary Table III (pathways with p-values less than 0.01 are included). NOD-like receptor signaling pathway, which generally acts in concert with the TLR4 signaling pathway, is also enriched more than 12-fold at 4 h and 24 h. Cytokine-cytokine receptor interaction pathway is 5-fold enriched with commonly regulated genes in both cells. Several other interesting pathways such as the chemokine signaling pathway and cell adhesion molecules (CAMs) are also enriched (Table 1).
TABLE 1.
Pathways enriched with genes commonly regulated in RAW264.7 and TGEM cells upon KLA treatment
| KEGG Path Name | Total Genes in the Pathway | At 4 h |
At 24 h |
||||
| Number of Genes Regulated | UP | EF | Number of Genes Regulated | UP | EF | ||
| Cytosolic DNA-sensing pathway | 50 | 17 | 17 | 12.94 | 15 | 15 | 15.54 |
| NOD-like receptor signaling pathway | 59 | 19 | 19 | 12.26 | 15 | 15 | 13.17 |
| Toll-like receptor signaling pathway | 96 | 23 | 23 | 9.12 | 15 | 15 | 8.10 |
| Type I diabetes mellitus | 56 | 9 | 9 | 6.12 | 15 | 14 | 13.88 |
| Adipocytokine signaling pathway | 65 | 9 | 9 | 5.27 | 7 | 6 | 5.58 |
| Chemokine signaling pathway | 172 | 24 | 24 | 5.31 | 17 | 16 | 5.12 |
| Cytokine-cytokine receptor interaction | 235 | 31 | 29 | 5.02 | 23 | 21 | 5.07 |
| Jak-STAT signaling pathway | 145 | 18 | 16 | 4.72 | 11 | 10 | 3.93 |
| Antigen processing and presentation | 74 | 7 | 7 | 3.60 | 16 | 15 | 11.20 |
| Natural killer cell mediated cytotoxicity | 115 | 10 | 9 | 3.31 | 10 | 9 | 4.51 |
| CAMs | 144 | 12 | 12 | 3.17 | 16 | 15 | 5.76 |
EF, the enrichment factor of commonly regulated genes for a pathway is the ratio of the fraction of such genes among all genes in this pathway over the fraction in the 20,932 genes examined. All selected pathways have a p-value less than 0.01 and the number of regulated genes in the pathway is at least 10 or the fold-change for RAW264.7 or TGEM cells is at least 10 (at 4 h or 24 h). The results do not necessarily mean the above pathways are commonly regulated in all aspects in RAW264.7 and TGEM cells.
Furthermore, we have used a computational motif discovery software, Allegro (29), to search for potential transcriptional regulatory elements enriched in the promoter sequences of 550 genes commonly regulated in both cell types at 4 h (intersection zone in the Venn diagram of supplementary Fig. I). The sequence GAAAccGAAA is identified as the most significant motif enriched in the promoter sequences of these 550 genes. This motif is nearly identical to the consensus sequence of interferon response factor (IRF)3 and the IFN-sensitive response element (30–32). The IFN-sensitive response element induces IFNβ. Several other IRFs such as IRF1, IRF2, and IRF8 are also identified as having similar motifs. Further analysis shows that the genes sharing this motif include interferon-activated or -induced genes such as interferon inducible GTPase 1 (Iigp1), interferon activated genes 204 and 205 (Ifi204, Ifi205); matrix metallopeptidase 14; various cytokines and cytokine receptors such as colony stimulating factor (Csf)1, IL-1, IL-10, IL-15, numerous chemokines, and chemokine receptors. Interferon activates JAK-STAT pathways (33). Thus STAT1 and STAT3/4/5/6 are also identified as enriched motifs in this analysis.
Differently (uniquely) regulated genes.
We have analyzed the differently regulated genes in two ways. The first type of analysis uses the gene list from the Venn analysis (supplementary Fig. I), which is generated for each time point individually. These gene lists are specifically used for pathway enrichment. The second type of analysis uses a gene list based on the minimum of Pearson correlation and an amplified-distance-based correlation between the time course of the same gene in the two cell types upon KLA treatment (see Materials and Methods section). Results from both are presented in the appropriate context.
As listed in Table 2, some genes are uniquely and highly upregulated in RAW264.7 cells only. Some examples of such genes are myristoylated alanine-rich protein kinase C substrate (Marcks) (22-fold at 4 h and 47-fold at 24 h), granulocyte macrophage colony-stimulating factor 2 (or CSF2) (13.5-fold at 4 h and 8-fold at 24 h), chemokine (C-C motif) ligand (Ccl)6 (39-fold at 24 h), activating transcription factor 3 (5.2-fold at 4 h and 4.6-fold at 24 h), and growth arrest and DNA-damage-inducible 45 α (Gadd45a) (8-fold at 24 h).
TABLE 2.
Genes highly upregulated in RAW264.7 cells, but not in TGEM cells upon KLA treatment

Top 10 genes in decreasing order of geometric mean of fold-change time course for RAW264.7 cells and minimum (Pearson correlation, distance-based correlation) ≤ −0.50 are listed. Color-scale: 0.1, dark green; 1, white; 4, dark red (linear).
On the other hand, as listed in Table 3, there are also many genes which are considerably upregulated in the TGEM cells, but not in RAW264.7 cells. Some of these genes are related to immune response; for example, interleukin 12b (Il12b) (46-fold upregulated at 4 h) and interleukin 12 receptor β1. Cystatin F (Cst7), which has been implicated in the regulation of antigen presentation and other immune processes (34, 35), is highly upregulated only in TGEM cells (18-fold upregulated at 24 h). Besides, Il12a, Cxcl1, Cxcl3, and vascular cell adhesion molecule 1 are also highly upregulated in TGEM cells only. These play an important role in inflammation and immune system-related processes. In addition, some of those genes commonly regulated only in primary cells are related to lipid metabolism, such as cholesterol 25-hydroxylase (Ch25 h) (more than 100-fold upregulated in TGEM cells at 8 h). Acyl-CoA synthetase long-chain family member 1 (Acsl1) is also highly upregulated in TGEM cells (e.g., more than 10-fold at 12 and 24 h; not shown in Table 3 as the minimum of Pearson correlation and distance-based correlation is more than −0.5 threshold). The same is true for Cav1, for which the fold changes in TGEM cells are more than 12-fold at 4 and 8 h.
TABLE 3.
Genes highly upregulated in TGEM cells, but not in RAW264.7 cells upon KLA treatment

Top 12 genes in decreasing order of geometric mean of fold-change time course for TGEM cells and minimum (Pearson correlation, distance-based correlation) ≤ −0.50 are listed. Color-scale: 0.1, dark green; 1, white; 4, dark red (linear).
Table 4 shows a list of biological pathways [Kyoto Encyclopedia of Genes and Genomes (KEGG)-based] where the uniquely regulated genes in each of the two cell types are enriched at 4 h or 24 h (see also supplementary Table IV for the enrichment p-values at all time points). For instance, the cell cycle pathway is enriched about 4-fold at 24 h with genes uniquely regulated in RAW264.7 cells. Further study shows 33 cell cycle genes are significantly regulated only in RAW264.7 cells, and remarkably, 26 out of 33 are significantly downregulated. It can be noted that these results, based on fold-change with respect to standard culture conditions (control), do not contradict the fact that RAW264.7 cells proliferate under control conditions whereas TGEM cells remain largely postmitotic (in the Go phase). Other genes uniquely regulated in RAW264.7 cells are also enriched in DNA replication (enrichment factor is 9 at 24 h; 21 out of 22 regulated genes are downregulated), mismatch repair (6-fold at 24 h; 9 out of 10 genes downregulated), and pyrimidine metabolism (15 out of 17 genes are downregulated). Systemic lupus erythematosus-related genes are also enriched with a p-value less than 10−9 with mixed up- or downregulation (13 genes upregulated and 13 genes downregulated).
TABLE 4.
Pathways enriched with genes uniquely regulated in RAW264.7 and TGEM cells upon KLA treatment at 4 h and 24 h
| KEGG Pathway Name | Total Number | Number Regulated | UP | DOWN | EF | p | Number Regulated | UP | DOWN | EF | p |
| RAW264.7 cells | 4 h (Regulated genes: 275) | 24 h (Regulated genes: 1,435) | |||||||||
| CAMs | 144 | 7 | 3 | 4 | 3.70 | 2.99E-03 | 13 | 8 | 5 | 1.32 | 1.89E-01 |
| Cell cycle | 122 | 7 | 2 | 5 | 4.37 | 1.16E-03 | 33 | 7 | 26 | 3.95 | 4.76E-12 |
| DNA replication | 35 | 4 | 0 | 4 | 8.70 | 1.11E-03 | 22 | 1 | 21 | 9.17 | 1.32E-17 |
| Glutathione metabolism | 53 | 1 | 1 | 0 | 1.44 | 5.04E-01 | 10 | 4 | 6 | 2.75 | 2.88E-03 |
| Lysosome | 122 | 3 | 2 | 1 | 1.87 | 2.16E-01 | 16 | 11 | 5 | 1.91 | 9.19E-03 |
| Mismatch repair | 22 | 3 | 0 | 3 | 10.38 | 2.87E-03 | 10 | 1 | 9 | 6.63 | 6.70E-07 |
| Pyrimidine metabolism | 93 | 3 | 0 | 3 | 2.46 | 1.24E-01 | 17 | 2 | 15 | 2.67 | 1.76E-04 |
| Systemic lupus erythematosus | 93 | 3 | 1 | 2 | 2.46 | 1.24E-01 | 26 | 13 | 13 | 4.08 | 3.91E-10 |
| TGEM cells | 4 h (Regulated genes: 1,303) | 24 h (Regulated genes: 969) | |||||||||
| Chemokine signaling pathway | 172 | 13 | 8 | 5 | 1.21 | 2.75E-01 | 19 | 12 | 7 | 2.39 | 4.02E-04 |
| ECM-receptor interaction | 84 | 8 | 5 | 3 | 1.53 | 1.51E-01 | 10 | 2 | 8 | 2.57 | 5.35E-03 |
| Focal adhesion | 197 | 25 | 19 | 6 | 2.04 | 5.57E-04 | 19 | 8 | 11 | 2.08 | 2.06E-03 |
| Glycerophospholipid metabolism | 78 | 13 | 8 | 5 | 2.68 | 9.90E-04 | 7 | 3 | 4 | 1.94 | 6.91E-02 |
| Jak-STAT signaling pathway | 145 | 15 | 14 | 1 | 1.66 | 3.67E-02 | 16 | 14 | 2 | 2.38 | 1.13E-03 |
| Lysosome | 122 | 12 | 5 | 7 | 1.58 | 7.76E-02 | 15 | 2 | 13 | 2.66 | 5.18E-04 |
| Phagosome | 161 | 15 | 11 | 4 | 1.50 | 7.71E-02 | 22 | 15 | 7 | 2.95 | 5.32E-06 |
| PPAR signaling pathway | 76 | 11 | 5 | 6 | 2.33 | 7.18E-03 | 15 | 7 | 8 | 4.26 | 1.73E-06 |
| Proteasome | 44 | 6 | 6 | 0 | 2.19 | 5.37E-02 | 12 | 12 | 0 | 5.89 | 4.84E-07 |
| Toll-like receptor signaling pathway | 96 | 17 | 14 | 3 | 2.84 | 8.19E-05 | 11 | 9 | 2 | 2.48 | 4.80E-03 |
EF: the enrichment factor of uniquely regulated genes for a pathway is the ratio of the fraction of such genes among all genes in this pathway over the fraction in the 20,932 genes examined. All selected pathways have a p-value less than 0.01 and the number of regulated genes in the pathway is at least 10 or the fold-change for RAW264.7 or TGEM cells is at least five (at 4 h or 24 h). ECM, extracellular matrix.
The genes for CAMs are also enriched in RAW264.7 cells at 4 h with mixed up- and downregulation. Genes uniquely regulated in TGEM cells at 4 h and 24 h are also highly enriched in several pathways such those related to immune function and inflammation. Examples of immune function-related pathways are chemokine signaling pathway, extracellular matrix-receptor interaction, focal adhesion, and JAK-STAT signaling pathway. All these pathways are enriched by 2-fold or more with a p-value less than 0.01 at either 4 h or 24 h. Genes uniquely regulated in TGEM cells alone are also highly enriched in proteasome (almost 6-fold at 24 h; all 12 out of 12 genes are significantly upregulated). PPAR signaling pathway is enriched more than 4-fold at 24 h with mixed up- and downregulation. Among the KEGG lipidomics pathways, glycerophospholipid metabolism is enriched more than 2-fold with mixed up- and downregulation.
Comparison of the transcriptomic responses at the pathway level
While different gene products in a pathway may have different significance in determining the physiological functionality of the pathway, a standard statistical test can only consider each gene with equal importance. Despite this limitation, a statistical test is still useful in order to systematically examine every KEGG pathway on the null hypothesis that the gene expression on the pathway level does not differ significantly between two cell types. In our study, we have applied the nonparametric two-sampled Kolmogorov-Smirnov test. Table 5 lists the pathways that are differently regulated between the two cell types. These pathways include diverse biological processes such as signal transduction, cell growth and death, genetic information processing, cell communication, and energy metabolism. The genes involved in the cell cycle pathway are significantly downregulated in RAW264.7 cells more than in the TGEM cells at 12 h and 24 h (p ∼ 0.001 and p < 0.001, respectively). The ribosome pathway in TGEM cells is also significantly differently regulated than in RAW264.7 cells at 2 h (p ∼ 10−5). The focal adhesion pathway is also differentially regulated in the two cell types, especially at 24 h (p < 10−5), the average fold-change over all genes being 1.85 (more upregulated) in RAW264.7 cells and 1.27 in TGEM cells. Figure 2 shows a comparison of a select set of pathways in the two cells based on the time course of the fraction of significantly regulated genes (see Materials and Methods section). The four pathways shown in Fig. 2 show differences between the two cell types in terms of kinetics and/or magnitude of the fraction of regulated genes. Cytokine-cytokine receptor interaction, JAK-STAT signaling pathway, and toll-like receptor signaling pathway exhibit differences in terms of the magnitude even though the shapes are similar. The cell cycle pathway exhibits differences in terms of both the kinetics and the magnitude of changes.
TABLE 5.
KEGG pathways differentially regulated on the gene expression level upon KLA treatment

Data are according to the p-values of Kolmogorov-Smirnov two-sample test. Values listed are −log10 (p-value). Color-scale: white, p = 0.01); dark red, p ≤ 1E-5 [linear with respect to −log10 (p-value)].
Fig. 2.

The time course of the fraction of significantly regulated genes in select pathways with differential regulation in RAW264.7 (RAW) and TGEM cells.
Detailed comparison of inflammatory responses
TLR4 is the transmembrane receptor that recognizes molecules derived from gram-negative bacteria (36). In our study, the TLR4 gene itself is not highly regulated for both RAW264.7 and TGEM cells at the seven time points. It is 0.54- and 0.68-fold downregulated at 24 h in RAW264.7 and TGEM cells, respectively (Fig. 3, supplementary Table V).
Fig. 3.

Comparison of gene expression in RAW264.7 (RAW) and TGEM cells treated with KLA for the TLR4 signaling pathway. Ctrl, control.
TLR4 activates the downstream nuclear factor kappa-light-chain-enhancer of activated B cells (NF-κB) signaling pathway via two different sets of adapters (37, 38). An early activation of NF-κB is mediated by a MyD88-dependent pathway (Fig. 3) (39, 40). In this part of the pathway, MyD88 has been upregulated in both cells at 4 h, 8 h, and 12 h, but returns to basal level at 24 h for RAW264.7 cells only. IL-1 receptor-associated kinase (IRAK)3 (also known as IRAK-M), which negatively regulates TLR4 signaling by preventing dissociation of phosphorylated IRAK1 and IRAK4 from MyD88 (41), is upregulated in both cells at 8, 12, and 24 h. A late activation of NF-κB is through the TRIF-dependent pathway (Fig. 3) (42). Two noncanonical IκB kinases, TANK-binding kinase 1 (TBK1) and inducible IκB kinase (IKKi) (also known as IKKε), are significantly upregulated for both cell types at the four late time points (4, 8, 12, and 24 h). IRF3 is constitutively expressed and not inducible, whereas IRF7 and the IRF target gene TNFα are upregulated in both cells at the same four late time points. IFNβ (Ifnb1) is also highly upregulated up to 8 h but later returns to close to basal level at 24 h (fold-change 1.43 in RAW264.7 cells and 2-fold in TGEM cells), especially when compared with its peak response (fold-change 43.28 at 4 h for RAW264.7 cells and 65-fold at 1 h for TGEM cells).
The NF-κB signaling pathway is activated, in both early and late responses to LPS/KLA, through the TRAF6-TAK1 complex, which activates IκB kinase (IKK) complexes. The IKK complex consists mainly of IKK1 (IKKα), IKK2 (IKKβ), and NEMO (the regulatory subunit NF-κB essential modulator, also known as IKKγ). The gene expression of this family is largely noninduced upon KLA treatment, except that IKK2 is marginally upregulated for TGEM cells at 2 h and 4 h.
The IκB family consists of three isoforms: IκBα, IκBβ, and IκBε (Nfkbia/b/e). In our study, IκBα is upregulated in both cells at all seven time points, but the fold changes in TGEM cells are at about one and a half to three times as large as in the RAW264.7 cell line except at 0.5 and 24 h (supplementary Table V). IκBβ is mildly upregulated in both cells. IκBε is considerably upregulated in TGEM cells at later time points (8, 12, and 24 h; 4- to 6-fold), while it is not upregulated at all in RAW264.7 cells at these later time points (8, 12, and 24 h). Furthermore, at 24 h when IκBε is still upregulated by more than 4-fold (fold-change of 4.16) in TGEM cells, it is downregulated in RAW264.7 cells by 2-fold (fold-change of 0.66).
The NF-κB family includes RelA (p65), RelB, Rel (c-Rel), NF-κB1 (p50 and its precursor p105), and NF-κB2 (p52 and its precursor p100). In both cell lines, RelA and RelB are upregulated during early response. RelA returns to basal level at 4 h in RAW264.7 cells and at 24 h in TGEM cells. In RAW264.7 cells, RelB peaks at 2 h and returns to basal levels by 8 h whereas in TGEM cells it peaks at 8 h and remains upregulated until 24 h. The p52 gene is more significantly upregulated in TGEM cells than in RAW264.7 cells. P50 and c-Rel are significantly upregulated in both cells at 1, 2, and 4 h, but at 12 h c-Rel remains significantly upregulated only in RAW264.7 cells (2.1-fold at 12 h).
As shown in Fig. 3, the majority of the NF-κB target genes, such as inducible nitric oxide synthase (iNOS) 2 and various cytokines, are significantly induced in both cell types at later time points (4, 8, 12, and 24 h). Meanwhile, A20 (Tnfaip3), the potent inhibitor of TNF-induced NF-κB activation by facilitating the degradation of receptor interacting protein RIP (43), is also significantly upregulated for both cell types at all seven time points. However, there are some differences. Vascular cell adhesion molecule 1 is upregulated in TGEM cells at six later time points (1, 2, 4, 8, 12, and 24 h), whereas the expression level stays unchanged for RAW264.7 cells at these later time points (supplementary Table V). Intercellular adhesion molecule 1 is upregulated at 1, 2, and 4 h in both cell types. However, it's fold-change in TGEM cells is two to four times higher than in RAW264.7 cells (e.g., 4.2-fold at 2 h in RAW264.7 cells, and 10-fold at 2 h and 16.2-fold at 4 h in TGEM cells). Further, at 24 h it is more than 8-fold upregulated in TGEM cells but about 2-fold downregulated in RAW264.7 cells (fold-change 0.58).
Comparison of cytokine responses
Cytokines are a pleiotropic group of molecules that are usually secreted by cells of the hematopoietic lineage and provide autocrine or paracrine regulation of hematopoietic cell differentiation or regulation of immune function (44). There are eight cytokine families, which include chemokines (34 members investigated), class I cytokines (hematopoietin family, 27 members), class II cytokines (interferon/IL-10 family, 11 members), PDGF family (25 members), TNF family (17 members), IL-1 family (9 members), IL-17 family (6 members), and TGF-β family (22 members). Our study shows that chemokines, cytokines, and the IL-1 family are the mostly highly upregulated cytokine families in both RAW264.7 and TGEM cell types (Table 6, Fig. 3). Several cytokines from the TNF family are also highly upregulated in TGEM cells. In RAW264.7 cells, only a few of these are significantly upregulated (supplementary Table VI).
TABLE 6.
Number of upregulated genes among each cytokine family
| Cytokine Family | Number of Genes | Number of Genes Upregulated in RAW264.7 Cells |
Number of Genes Upregulated in TGEM Cells |
||||||||||||
| 0.5 h | 1 h | 2 h | 4 h | 8 h | 12 h | 24 h | 0.5 h | 1 h | 2 h | 4 h | 8 h | 12 h | 24 h | ||
| Chemokines | 34 | 2 | 7 | 10 | 16 | 12 | 11 | 12 | 4 | 11 | 13 | 16 | 17 | 17 | 17 |
| Class I cytokines (hematopoietin family) | 27 | 0 | 2 | 4 | 5 | 4 | 4 | 4 | 0 | 6 | 7 | 4 | 5 | 5 | 5 |
| Class II cytokines (interferon/IL-10 family) | 11 | 0 | 2 | 3 | 2 | 3 | 2 | 1 | 1 | 3 | 4 | 4 | 3 | 4 | 4 |
| IL-1 family | 9 | 1 | 2 | 3 | 4 | 5 | 5 | 5 | 2 | 3 | 4 | 4 | 4 | 4 | 4 |
| IL-17 family | 6 | 0 | 0 | 0 | 0 | 0 | 0 | 0 | 0 | 0 | 0 | 0 | 0 | 0 | 0 |
| PDGF family | 25 | 0 | 0 | 2 | 3 | 2 | 1 | 3 | 0 | 0 | 2 | 2 | 2 | 2 | 1 |
| TGF-β family | 22 | 0 | 0 | 0 | 0 | 0 | 1 | 1 | 1 | 1 | 0 | 0 | 0 | 0 | 0 |
| TNF family | 17 | 2 | 2 | 3 | 4 | 3 | 1 | 2 | 2 | 3 | 5 | 7 | 6 | 5 | 5 |
Chemokines direct the chemotactic migration of leukocytes from the blood, across the endothelium, and into an affected tissue during an inflammatory response. Our study shows approximately 50% of chemokines are upregulated upon KLA treatment for both the cells types at one or more time points (Table 6). Some highly induced genes are listed in supplementary Table VI. The highly induced genes include macrophage inflammatory proteins [e.g., MIP1α (Ccl3) and monocyte chemotactic protein (MCP)1β (Ccl4)], MCPs [e.g., MCP2 (Ccl7) and MCP3 (Ccl8)], interferon γ-inducible protein 10 (IP-10) (also known as Cxcl10), regulated on activation normal T-cell expressed and secreted (RANTES) (also known as Ccl5), etc. Essentially, they are coexpressed during macrophage activation for immune response. On the other hand, some chemokines, such as stromal cell-derived factor 1 (SDF-1) (Cxcl12), macrophage derived chemokine (MDC) (Ccl22), thymus-expressed chemokine (TECK) (Ccl25), and EBI (EBV-induced gene) 1-ligand chemokine (ELC) (Ccl19), are not significantly regulated. Despite the similar patterns of gene regulation among the chemokine family in the RAW264.7 and TGEM cells, there are also some evident differences. A few chemokines are much more upregulated in TGEM cells than in RAW264.7 cells at several time points. For example, Cxcl1 (also known as KG or GRO1) is only upregulated in TGEM cells during the entire time course (maximum fold-change 177 at 2 h) (supplementary Table VI). In RAW264.7 cells, KG is not regulated. Cxcl9 (also known as MIG) is considerably upregulated in TGEM cells at several time points (>22-fold at 8 h and 16-fold at 24 h), while only mildly upregulated in RAW264.7 cells at 4 h (2.4-fold) and returns to the basal level at 24 h. On the other hand, some chemokines, such as Ccl6, are much more upregulated in RAW264.7 cells (upregulation increases with time; 39-fold at 24 h) than in TGEM cells. Ccl6 is involved in cell-cell communication and also has chemo-attractant properties. Although a detailed mechanism is not established, early activation of granulocyte M-CSF (Csf2) and granulocyte colony-stimulating factor (Csf3) in RAW264.7 cells may contribute to upregulation of Ccl6 at later times.
Class I cytokines (hematopoietin) stimulate the survival, proliferation, and differentiation of both immature and maturing hematopoietic cells through class I cytokine receptors (45, 46). Several common and distinct temporal patterns exist. Gene expression of IL-6 is upregulated substantially in both cell types throughout the time course (e.g., 23-fold and 179-fold in RAW264.7 and TGEM cells, respectively, at 4 h) (supplementary Table VI). IL-6 is both pro- and anti-inflammatory and it can also stimulate immune response (47). Oncostatin-M (OSM) is upregulated in RAW264.7 cells only. IL-15 is upregulated in RAW264.7 cells only at 4 h (6-fold), whereas it is upregulated at all t ≥ 2 h in TGEM cells. Upregulation of granulocyte colony-stimulating factor (Csf3) increases with time in RAW264.7 cells (4.7-, 17.8-, and 29.8-fold at 1, 4 and 24 h, respectively) whereas in TGEM cells, it achieves a maximum of 3-fold at 8 h and then decreases to 2.5-fold at 24 h. IL-12α and IL-12β are upregulated at most time points in TGEM cells only. IL-2, -3, -4, -5, -7, -11, and -13 are not significantly regulated in either cell type (not listed in supplementary Table VI). Gene expression of Csf2 is highly upregulated in RAW264.7 cells at several time points (13.5-, 20-, 32-, and 8-fold at 4, 8, 12, and 24 h, respectively), but in TGEM cells, it is significantly upregulated only at 1 h (4.3-fold) and 2 h (2.6-fold). Cardiotrophin-like cytokine factor 1 (Clcf1) and IL-23, α subunit p19 (Il23α), are not upregulated in RAW264.7 cells, but in TGEM cells they are upregulated at early time points. Interestingly, IL-9 is the only gene that is downregulated (mildly in RAW264.7 cells and significantly in TGEM cells).
Class II cytokines show divergent physiological roles, although they share structural similarities and the similar class II cytokine receptors. For example, IL-10 is a major anti-inflammatory cytokine, while IFN-γ is a major pro-inflammatory cytokine. Several interferons also have antiviral and antitumor properties, which are exploited by the immune system in fighting viral infection and blocking its spread (48). IL-10 gene expression is significantly upregulated in both cell types. In RAW264.7 cells its expression peaks at 8 h (18.9-fold) and then reduces to 5.8-fold at 24 h, whereas in TGEM cells it peaks during 2–4 h (6- to 7-fold) and then slowly reduces to 2.6-fold at 24 h. Thus, some temporal and magnitude differences still exist. IFNγ is upregulated in TGEM cells at t ≥ 4 h, while not significantly regulated in RAW264.7 cells at any time. IFNα gene expression is not significantly regulated in either cell type. IFNβ1 gene expression is significantly upregulated in both cell types during 1–8 h (RAW264.7 cells) and 1–24 h (TGEM cells).
Other cytokines, such as IL-1α, IL-1β, and IL-18 (members of the IL-1 family), are similarly upregulated in both cell types at several time points. IL-1 stimulates the immune response at the tissue level (49). M-CSF (Csf1), TNF and TNF-related apoptosis-inducing ligand (TRAIL) (Tnfsf10), and Tnfsf9 are also similarly upregulated in both cell types at some time points. On the other hand, platelet-derived growth factors (Pdgfa, Pdgfb, and Pdgfc) are either mildly upregulated or unregulated in RAW264.7 cells, but are mildly or significantly downregulated in TGEM cells at both early and late time points. Angiopoietin 2 (Angpt2) and vascular endothelial growth factor B (Vegfb) are both downregulated in both cell types, although temporal differences exist for Angpt2. For example, Angpt2 is downregulated in RAW264.7 cells at both early and late time points, whereas in TGEM cells its response returns to basal levels at 24 h. This suggests that at the tissue level, vascular growth and angiogenesis are reduced.
Supplementary Table VI also lists the relevant cytokines as being pro- or anti-inflammatory. RAW264.7 and TGEM cells show some common and some distinct patterns with respect to these cytokines. For example, various CCLs, such as Ccl2, -3, -4, -5, and -7 are upregulated in both cell types. The level of upregulation is stronger in TGEM cells, e.g., fold-change for Ccl4 is 36 and 44 at 4 and 12 h, respectively, in RAW cells, whereas the corresponding fold-changes in TGEM cells are 255 and 13.9, respectively. Overall, a similar pattern is observed for IFNβ1, IL-1α, IL-1β, and TNFα (Tnf). On the other hand, Ccl8, IFNγ, and IL-12α are upregulated in TGEM cells but do not change in RAW264.7 cells. A different pattern is observed for colony-stimulating factors Csf2, Csf2ra (CSF2 receptor A), and Csf3 which are more upregulated in RAW264.7 cells. For example, Csf3 is 20- to 30-fold upregulated in RAW264.7 cells during 8–24 h as compared with 2- to 3-fold in TGEM cells (supplementary Table VI). Also, in RAW264.7 cells, the level of upregulation of Csf3 monotonically increases, whereas in TGEM cells the response peaks at 8 h (3-fold) and then reduces to 2-fold at 12 h and again increases to 2.5-fold at 24 h.
IL-6 can function as both a pro- and anti-apoptotic molecule (see the text for class I cytokines). It is upregulated in TGEM cells. The number of cytokines that have anti-inflammatory characteristics is less than that of pro-inflammatory cytokines. IL-10 is a prominent anti-inflammatory cytokine. It is about 3-fold more upregulated in RAW264.7 cells than in TGEM cells. Several cytokine receptors and related molecules such as the IL-1 receptor antagonist (IL1r-n), IL-4 receptor α (IL4ra), IL10ra, and IL13ra1 are also anti-inflammatory (supplementary Table VI). Similar to IL-10, IL1r-n and IL13ra1 are also more upregulated in RAW264.7 cells. IL4ra is upregulated in RAW264.7 cells but unregulated in TGEM cells, whereas IL10ra is the only interleukin receptor that is only mildly upregulated in RAW264.7 cells versus more upregulated in TGEM cells. Overall, there is an interesting similarity, albeit with some interesting differences, between the two cell types with respect to pro- and anti-inflammatory cytokines.
Detailed comparisons of lipid metabolism
Eicosanoids.
Eicosanoids (e.g., PGs and leukotrienes) are well-established signaling molecules involved in inflammatory responses (50). The pathway for the production of PGs is illustrated in Fig. 4.
Fig. 4.

A comparison of the gene expression and eicosanoid metabolite changes in RAW264.7 (RAW) and TGEM cells treated with KLA is shown for the arachidonic acid metabolism pathway. Eicosanoid changes were measured in the media. Ctrl, control.
In our experiments, several phospholipase A2 (PLA2) isoforms are significantly upregulated in both RAW264.7 and TGEM cells (Fig. 4, supplementary Table VII). Arachidonate 5-lipoxygenase (Alox5) is downregulated in both cells at 8, 12, and 24 h, and 5-hydroxy-6E,8Z,11Z,14Z-eicosatetraenoic acid (5-HETE) was not different from control experiments in either cell type consistent with a failure to activate 5-lipoxygenase by this stimulation sequence. Prostaglandin E synthase (Ptges) is upregulated by up to about 8-fold in RAW264.7 cells (24 h) and up to about 19-fold in TGEM cells (8 and 12 h).
Despite the above similarities, there are some clear differences (Fig. 4). Cyclooxygenase (Cox)1 (Ptgs1) is not regulated in RAW264.7 cells, but is downregulated in TGEM cells at later time points (8, 12, and 24 h). Cox2 (Ptgs2) is significantly upregulated in both cells. However, the expression profile of Cox2 is different: its upregulation is 7-fold (2 h) to 45-fold (24 h) in RAW264.7 cells, whereas its upregulation is about 6-fold at 2 h, 11-fold at 4 h, and returns to a moderate fold-change of 3 at 24 h in TGEM cells (supplementary Table VII). Consistent with this expression pattern of the inducible Cox2 gene, the media level of all the PGs measured (i.e., PGD2, PGE2, PGJ2, PGF2a, 15-deoxy-PGD2, and 15-deoxy-PGJ2) are significantly increased (e.g., more than 100-fold for PGD2 and PGJ2 at 8, 12 and 24 h) by KLA treatment in the RAW264.7 cells. The PG productions upon KLA treatment are much attenuated in TGEM cells with an increase of no more than 3-fold. Particularly, the production of PGF2a, PGJ2, and 15-deoxy-PGD2 either does not increase at all (PGF2a) or increases slightly (1.4-fold for PGJ2, and 1.75-fold for 15-deoxy-PGD2) in TGEM cells.
Sphingolipids.
Sphingolipids are major components of the eukaryotic plasma membrane. The pathway of sphingolipid biosynthesis, with lipidomic data mapped only for the N-acyl C16 chain length, is illustrated in supplementary Fig. II (pathway maps with data projected for all chain lengths are shown in supplementary Fig. III). The mRNAs for two subunits of serine palmitoyltransferase (Sptlc1/2), the enzyme catalyzing the first and rate-limiting step of sphingolipid biosynthesis, go up moderately for RAW264.7 and TGEM cells (supplementary Table VIII). Lass6 (CerS6), which preferentially produces ceramides with C14 and C16 N-acyl chains (51), goes up for both cells (up to 2-fold for RAW264.7 cells and 5.5-fold for TGEM cells). The gene expression data suggests an upregulation of de novo synthesis of sphingolipids by the KLA treatments. In fact, C16, C18, C20, C22, C24, and C24:1 N-acyl chain ceramides increase considerably at 24 h in RAW264.7 and TGEM cells. On the other hand, some important differences can be found between RAW264.7 and TGEM cells in our experiments. For instance, Sphk2 is modestly upregulated in RAW264.7 cells at 8, 12, and 24 h, but not in TGEM cells. Sphk1 does not change much in RAW264.7 cells, but in TGEM cells it is upregulated by 4-fold at 4 h and later it is downregulated at 24 h (fold-change of 0.6). Ceramide kinase (Cerk) is downregulated in both cell types (2-fold in RAW264.7 cells and 3-fold in TGEM cells at 4 h), but because ceramide levels increase slightly at 12 and 24 h in both cell types, the level of ceramide phosphate (CerP) shows a mixed response although the change is small.
Cholesterol.
Cholesterol is a major component of the eukaryotic plasma membrane and plays an indispensable role in maintaining lipid rafts in a functional state (52–55). In addition to the structural function, cholesterol is an important precursor of signaling molecules such as oxysterols and steroid hormones. The cellular cholesterol level is tightly controlled by de novo biosynthesis, metabolism, transport, influx, and efflux. In our study, we focus mainly on de novo biosynthesis, influx, and efflux of cholesterol.
A simplified version of de novo biosynthesis of cholesterol is illustrated in Fig. 5. In both RAW264.7 and TGEM cells, the gene expressions of HMG-CoA reductase (Hmgcr) and squalene epoxidase (Sqle) are modestly upregulated and downregulated, respectively (supplementary Table IX). At 24 h, lanosterol goes up about 30-fold in RAW264.7 cells, whereas it only goes up by 1.7-fold in TGEM cells. At 24 h, desmosterol goes up about 2-fold in RAW264.7 cells, whereas its levels actually decreases in TGEM cells.
Fig. 5.

A comparison of gene expression and lipid metabolite changes in RAW264.7 (RAW) and TGEM cells treated with KLA is shown for the sterol biosynthesis pathway. Ctrl, control.
Cellular influx or uptake of cholesterol can take several different pathways. Modified lipoproteins such as oxidized or acetylated lipoproteins can be taken up by macrophages via scavenger receptors, including scavenger receptor A (SR-A, Msr1), CD36, macrophage receptor with collagenous structure (MARCO), lectin-like oxidized LDL receptor (LOX-1), and scavenger receptor-BI (SR-BI) (56, 57). Our results show that expression of SR-A is upregulated in both RAW264.7 and TGEM cells during 4–24 h (supplementary Table X). CD36, a member of class B scavenger receptors, is upregulated in RAW264.7 cells (2.2-fold at 8 h and 7.2-fold at 24 h), but is downregulated in TGEM cells (fold-change is 0.7 at 4 h and 0.4 at 24 h). MARCO is significantly upregulated in TGEM cells (4.2-, 7.2-, and 14-fold at 8, 12, and 24 h, respectively), but not in RAW264.7 cells. The gene expression of LOX-1 (Olr1) is upregulated substantially in TGEM cells during 1–24 h (9.6-fold at 8 h). In RAW264.7 cells, its level is significantly upregulated only at 2 h (2.7-fold). In addition to the above receptors which bind modified lipoproteins, macrophages also utilize some other receptors to take up unmodified lipoproteins. Those receptors include the SR-BI, the LDL receptor, the VLDL receptor, and the LDL receptor-related protein 1 (56). In our experiments, the gene expression of SR-BI is mildly downregulated in both cell types (supplementary Table X). Meanwhile, the LDL receptor is modestly upregulated in both cell types at two to three time points, and the LDL receptor-related protein 1 is mildly downregulated in TGEM cells at later time points.
The major mechanism of cholesterol efflux in macrophages is to utilize ATP binding cassette transporters (ABCs) (58–61). In our experiments, gene expression of Abca1 is upregulated by more than 2-fold at 8 h in RAW264.7 cells and at 8 and 12 h in TGEM cells (supplementary Table X). Abcg1 is downregulated in both cell types at both early and late time points. In RAW264.7 cells, at 2 and 4 h, Abcg1 is downregulated by more than 2-fold, whereas in TGEM cells the downregulation is about 3- and 5-fold, respectively. At 24 h, Abcg1 is downregulated by about 2-fold in either cell type. Abcg4 remains unchanged in both cell types. In addition, ApoE molecules can mediate the cholesterol efflux from the macrophages that originally secreted it (autocrine effect) or from surrounding macrophages (paracrine effect) (62–64). In our results, ApoE is downregulated in both cell types during 8–24 h.
Overall, the cellular cholesterol level increases only slightly in either cell type (1.4-fold at 24 h in RAW264.7 cells and 1.3-fold at 12 h in TGEM cells). Sterol O-acyltransferase 2 (Soat2) is upregulated in RAW264.7 cells moderately at 12 h (2-fold) and 24 h (1.6-fold). Consistently, the level of several cholesterol esters goes up by 2-fold at 12 h and 24 h in RAW264.7 cells, but does not change much in TGEM cells. At the extreme, in RAW264.7 cells cholesterol ester CE(20:2) increases by 50.7-fold and cholesterol ester CE(22:1) increases by 13.6-fold at 4 h. The expression of cholesterol 25-hydroxylase (Ch25h) goes up considerably for TGEM cells at later time points [4 h (82-fold), 8 h (110-fold), 12 h (90-fold), and 24 h (34-fold)] but does not change in RAW264.7 cells (largest fold-change is only 1.3-fold at 4 h). Consistently at 24 h, the 25-hydroxy-cholesterol level increases only 1.3-fold for RAW264.7 cells, whereas it increases 80-fold in TGEM cells.
DISCUSSION
Later time peaked response of RAW264.7 cells to inflammatory stimulus
Our results show that a much lower number of genes are significantly regulated in RAW264.7 cells than in TGEM cells at 4 h, but the result is opposite at 24 h after treatment with KLA. This result is self-evident in Fig. 1. The number of regulated genes in RAW264.7 cells monotonically increases with time until 24 h, whereas for TGEM cells it peaks at 4 h. A similar trend persists for the number of genes upregulated and downregulated for the two cell types. In general, at all times, the number of genes upregulated is more than the number of genes downregulated. Further analysis into the temporal aspect of the time courses for fold-change for genes showed that there are about 500 genes which show an early peak (upregulated or downregulated; tpeak ≤ 8 h) in TGEM cells but a late peak (at 24 h) in RAW264.7 cells. On the contrary, there are only about 100 genes which show an early peak in RAW264.7 cells and a late peak in TGEM cells.
Upregulation of Marcks and downregulation of cell cycle in RAW264.7 cells
Marcks is a predominant specific substrate of protein kinase C (PKC), and its phosphorylation has been used as a marker of PKC activation in vivo (65). It was reported to be phosphorylated during macrophage activation by LPS two decades ago (66). In contrast to substantial upregulation of Marcks in RAW264.7 cells upon KLA treatment (Table 2), it is expressed constitutively at high levels in TGEM cells. A similar observation is reported in the literature for BMDM cells due to the induction by M-CSF (or Csf-1) (67), which is present in the cell culture medium. For TGEM cells as well, Csf-1 or other cytokines produced during in vivo stimulation by thioglycolate are a possible cause for high levels of Marcks. Marcks is also a cross-linking protein between the plasma membrane and the actin filament, and besides its phosphorylation by PKC, it is also regulated by calmodulin (68, 69). It appears to be an essential component in membrane-cytoskeletal signaling events for controlling cell shape changes such as cell adhesion, migration, secretion, endocytosis, exocytosis, and phagocytosis in a variety of cell types (65, 70). Moreover, growing evidence has suggested a role for Marcks in regulating cell cycle. For example, the concentration of Marcks is attenuated in several transformed cell lines (71–73). Marcks over-expression strongly depresses the proliferation of cancer cells, such as human tumor-derived choroidal melanoma cells (OCM-1) (74). Consistently, our results show that the expression level of cell-cycle genes is downregulated in RAW264.7 cells with the drastic upregulation of Marcks.
Effect on cell cycle progression
RAW264.7 cells proliferate under resting conditions (control), while TGEM cells are for the most part in the Go phase. This is observed in the DNA measurements for the controls in the two cell types (not shown). However, this characteristic difference in the two cell types changes under KLA-treatment conditions. There are temporal differences between the two cell types with respect to the expression level fold-changes for several key genes controlling the progression of the cell cycle. The Gadd45a gene is upregulated at all time points in RAW264.7 cells (e.g., ∼8-fold upregulated at 2 h and 24 h and 5-fold upregulated at 12 h) but in TGEM cells it is downregulated at most of the time points (0.4-fold downregulated at 4 h and 0.34-fold downregulated at 24 h) (supplementary Fig. IV, supplementary Table XI). The Gadd45a gene is a member of a group of genes whose transcript levels are increased following stressful growth arrest conditions and treatment with DNA-damaging agents (75). The levels of Gadd45a are regulated in response to environmental stresses via activation of the p38/JNK pathway followed by activation of MTK1/MEKK4 kinase. The DNA damage-induced transcription of this gene is mediated by both p53-dependent and -independent mechanisms. Because p53 transcript levels are not changed significantly at any time point in both RAW264.7 and TGEM cells (a fold-change of 0.57 in RAW264.7 cells at 24 h is still more than the threshold of 0.5), Gadd45a upregulation in RAW264.7 cells may be through a p53 independent mechanism. The strong upregulation of Mdm2, which inhibits p53 in both cell types, provides further evidence for this hypothesis. The increase in Gadd45a levels results in significant downregulation of cyclin B2 (Ccnb2) in RAW264.7 cells (0.2-fold at 24 h), which inhibits G2 to M phase transition. Cyclin E1 (Ccne1) is another important molecule for the progression of cell cycle. Cyclin E1 forms a complex with and functions as a regulatory subunit of cyclin-dependent kinase 2 (CDK2), whose activity is required for cell cycle G1/S transition (76). The downregulation of cyclin E1 in RAW264.7 cells (e.g., 0.4-fold at 4 h) implicates that cell cycle progression is reduced at this stage. Compared with this, in TGEM cells cyclin E1 levels are upregulated at t ≥ 4 h. Similar to cyclin E1, cyclin D2/3 forms a complex with cdk6 whose activity is also required for cell cycle G1/S transition (77). Cyclin D2 and cyclin D3 are less upregulated in RAW264.7 cells (less than 2.5-fold at any time) compared with TGEM cells (9- to 21-fold during 2–12 h; supplementary Table XI). The net effect of cyclin E1 and cyclin D2/3 appears to inhibit cell cycle progression at G1/S phase in RAW264.7 cells. In contrast, in TGEM cells G1/S phase transition may be promoted due to strong upregulation of cyclin D2/3. The replication process-related genes are also differently regulated in the two cell types at later time points. Mini-chromosome maintenance proteins are highly conserved and are essential for the initiation of eukaryotic genome replication (78). Mini-chromosome maintenance proteins 2–7 are downregulated in RAW264.7 cells at t ≥ 4 h, suggesting that replication (DNA biosynthesis) is downregulated whereas there is little effect on these genes in TGEM cells. Further support for reduced DNA replication in RAW264.7 cells comes from the downregulation of origin recognition complex (ORC) proteins Orc2 and Orc6 which promote the initiation of DNA replication (79). Consistent with all these transcriptomic changes is the finding that DNA-level fold-changes with respect to the control are reduced significantly at 24 h in RAW264.7 cells [a fold-change of 0.67 (supplementary Fig. V)].
Similarity of TLR4 signaling pathway regulation between RAW264.7 and TGEM cells
The gene regulation of the TLR4/LPS signaling pathway appears to be similar between the RAW264.7 and TGEM cells. Particularly, the gene regulation in the IRF branch of the TLR4 signaling pathway is largely common between the two cell types. Because the activation of IRF3 belongs to the late-phase response to LPS/KLA, it is not surprising that the IRF3 binding site is found to be the most significant motif enriched in the promoter sequences of the commonly regulated genes at 4 h.
In the IκB family, IκBα is the most potent negative regulator and also one of the target genes of NF-κB. Continued cycles of IκBα degradation and synthesis can give rise to oscillations in NF-κB activity. IκBβ and IκBε have functional roles in damping the oscillatory propensity of the NF-κB-IκBα negative feedback loop (80). Our results show that IκBα is less upregulated in RAW264.7 cells than in TGEM cells, and IκBε is considerably upregulated in TGEM cells, but downregulated in RAW264.7 cells at 24 h. Despite some differences, as elaborated above and presented in the Results section, the TLR4 pathway response is similar in the two cell types. This is also evident from the similar qualitative shapes of the time course of the fraction of genes up- or downregulated in the two cell types (Fig. 2, left-bottom panel). Nevertheless, the specific differences do suggest some uncertainty as to which cell type is the best model to study the kinetics of the TLR4 signaling pathway.
Critical differences between RAW264.7 and TGEM cell lipid metabolism
In sphingolipid metabolism, both transcriptomic and lipidomic data suggest the upregulation of de novo synthesis of sphingolipids upon KLA treatment. Gene expression levels for Sptlc1/2, which catalyze the rate-limiting step of sphingolipid synthesis, go up moderately for both cell types (supplementary Table VIII). Lass6 (CerS6) is also upregulated for both cell types. At the lipid level, C16, C18, C20, C24:1, C26, and C26:1 N-acyl chain ceramides increase substantially at 12 or 24 h for both cells. Sphingosine-1-phosphate (S1P) is increased in RAW264.7 cells at only 12 h (fold-change 1.42). In TGEM cells, S1P is increased by 1.64-fold at 1 h and 1.53-fold at 4 h. This temporal difference is likely to be biologically significant because the S1P levels in cells are tightly regulated by the balance between its synthesis and degradation. Numerous studies have shown that ceramide and sphingosine mediate apoptosis, cell cycle arrest, and differentiation, whereas S1P promotes proliferation, survival, and inhibition of apoptosis (81–83). Because ceramide, sphingosine, and S1P exert opposing effects on cell survival and these sphingolipid metabolites are inter-convertible with each other, sphingolipid rheostat has been proposed implying that the relative levels of these lipids in response to stress stimuli determine the cell fate (83, 84). Supplementary Fig. VI shows the changes in the ratio of fold-change (KLA/control) of S1P to sphingosine in RAW264.7 and TGEM cells. In RAW264.7 cells, the S1P to sphingosine ratio initially decreases up to 8 h and then returns to about 1.2 at 12 and 24 h (similar to its value at 0.5 h), while in TGEM cells this ratio increases up to 1.9 at 8 h and then returns to a value of 1 at 24 h (supplementary Fig. VI). The shift of this ratio in RAW264.7 cells may serve as a counterbalance against the downregulation of cell cycle genes, so that a fine control of cell fate can be achieved.
In eicosanoid metabolism, the difference between RAW264.7 and TGEM cells is remarkable. The media level of most PGs measured are significantly increased (e.g., more than 100-fold for PGD2 and PGJ2 at 8, 12, and 24 h) by KLA treatment in the RAW264.7 cells. However, the media levels of all the PGs measured go up only modestly or do not change at all across the time points for TGEM cells upon treatment with KLA. In fact, the diminished capacity of PG production in TGEM cells has been demonstrated as a consequence of in vivo inflammatory stimulus such as thioglycolate (85, 86). Based on our results, several plausible explanations can account for the diminished arachidonic acid metabolism in TGEM cells. For example, the deacylation of membrane phospholipids, which is the rate-limiting step of PG production, can be repressed in TGEM cells. No significant increase of arachidonic acid release has been found for TGEM cells in the current experiment, whereas levels of arachidonic acid in the media go up more than 1.3-fold as early as 0.5 h after treatment with KLA, and more than 3-fold at 1 h in RAW264.7 cells. Moreover, the induction of Cox2 (Ptgs2) gene expression has been much attenuated in TGEM cells (supplementary Table VII). Similar results are also found in other microarray experiments (87). Upregulation of Cox2 levels in RAW264.7 cells is also observed at the proteomic level (27).
In cholesterol homeostasis, the de novo synthesis of cholesterol upon KLA treatment goes up more significantly in RAW264.7 than in TGEM cells, as demonstrated by the considerable increase in the intermediates lanosterol and desmosterol in RAW264.7 but not in TGEM cells. Genes involved in the influx and efflux of cholesterols are also differently regulated, as stated in the Results section and supplementary Table IX. Overall, the cellular cholesterol level increases only moderately in either cell type. The tight regulation of the cholesterol levels can be owed in part to the fact that it is being produced and used in several reactions besides being affected by the influx and efflux through the plasma membrane. Also, the level of overall cholesterol esters increases in RAW264.7 cells at 12 and 24 h, but does not change much in TGEM cells.
Cholesterol 25-hydroxylase (Ch25h) and its product 25-hydroxy-cholesterol (25-OH-Ch) are strongly upregulated in TGEM cells at later time points (110-fold at 8 h), but not so strongly in RAW264.7 cells (at most 1.3-fold at 4 h). 24,25-Epoxy-cholesterol increases slightly in RAW264.7 cells but it decreases in TGEM cells at several time points (0.56-fold at 24 h). Differences can be found in other oxysterols between the two cells. The levels of those oxysterols provide negative feedback inhibition to the cholesterol biosynthesis. Among them, 25-hydroxy-cholesterol has been known as the most potent suppressor of Hmgcr and Sqle gene transcription in cultured cells (88–93). This suppressive effect of 25-OH-Ch (more increase in TGEM cells) on Sqle (more downregulated in TGEM cells) is clearly observed in our experiments (Fig. 5, supplementary Table IX) although Hmgcr shows slight upregulation for either cell type. Partially consistent with lesser downregulation of Sqle in RAW264.7 cells, more increase is observed in lanosterol at later time points (Fig. 5). This is despite moderate downregulation of lanosterol synthase (Lss) in RAW264.7 cells (supplementary Table IX); unmeasured levels of the substrates/precursors of lanosterol, namely, squalene and squalene-2,3-epoxide may account for the apparent mismatch. Further, oxysterols, as the endogenous ligands of liver X receptors (LXRs), can also regulate cholesterol trafficking through the activation of LXRs, which can induce Abca1, Abcg1, Abcg5, etc. The gene expression for LXRs (e.g., Nr1h3) is unchanged to slightly downregulated in RAW264.7 cells at 24 h (0.8-fold). However, in TGEM cells it is downregulated until 2 h (0.76-fold at 2 h) and upregulated at later times (3.2-fold at 8 h), which is also consistent with the increase in 25-OH-Ch in TGEM cells. These results are partially consistent with other reports that TLR4 activation suppresses LXR levels (94, 95). Lss, a target of LXR, shows a moderate downregulation in RAW264.7 cells despite the moderate increase in 25-OH-Ch, suggesting a negative regulation of Lss by LXRs. However, in TGEM cells 25-OH-Ch is increased and LXR is also upregulated but expression levels of Lss are unchanged, possibly suggesting a different mechanism than in RAW264.7 cells. Beyond the capacity to regulate cholesterol homeostasis in a variety of ways, oxysterols can also play an important anti-inflammatory role through the activation of LXRs. In LPS-activated macrophages activated LXRs suppress the induction of a number of inflammatory genes including prostaglandin E synthase (Ptges), iNOS, IL-6, MCP-1, IL-1β, matrix metalloproteinase 9, and osteopontin (Spp1) (3, 94–99). It is possible that the dynamics of various oxysterols decide the LXR's functional specificities. Correlated with the different oxysterol levels among RAW264.7 and TGEM cells, our studies also show that some of the LXR targets are regulated differently. For example, matrix metalloproteinase-9 and osteopontin are considerably upregulated in only RAW264.7 cells (supplementary Table XII). Cox2 is strongly upregulated in RAW264.7 cells (supplementary Table VII) at late time points. Abca1 is upregulated significantly in only RAW264.7 cells at several times points whereas it is upregulated in TGEM cells at 8, 12, and 24 h. The coupling of cholesterol homeostasis and inflammatory responses through the oxysterol-LXR signaling pathway is particularly relevant in the context of atherogenesis.
Differences between genes related to energy metabolism in RAW264.7 and TGEM cells
Figure 6 shows a schematic of energy metabolism in the mitochondria and related processes. Fatty acids (FAs) are transported inside the cell via the FA transporters (FAT/CD36). FAT is upregulated in RAW264.7 cells (more than 7-fold at 24 h), but is downregulated in TGEM cells (more than 2-fold downregulated at 12 and 24 h) (supplementary Table XIII). Inside the cells, FAs are converted into acyl-CoA through the enzyme acyl-CoA synthases (ACSs). In our experiments, long-chain ACSs are more strongly upregulated in TGEM cells than in RAW264.7 cells, whereas short-chain ACSs are moderately upregulated in TGEM cells but show mixed response in RAW264.7 cells (up- and downregulated at different time points). Acyl-CoA is transported into the mitochondria by the enzymes carnitine palmitoyltransferase 1a (Cpt1a or CPT-1) and CPT-2. While CPT-1 is downregulated in both RAW264.7 cells (relatively strongly) and TGEM cells (mildly), CPT-2 is relatively less downregulated in RAW264.7 cells than in TGEM cells. Inside the mitochondria, the key processes, such as β-oxidation which converts longer-chain-length acyl-CoA into acetyl-CoA (100, 101), TCA cycle (102), and oxidative phosphorylation, are all downregulated in both cell types. The citrate made in the TCA cycle is transported out of mitochondria through the mitochondrial citrate transport protein which is moderately upregulated in RAW264.7 cells but generally unchanged in TGEM cells {see Slc25a1 [solute carrier family 25 (mitochondrial carrier, citrate transporter), member 1] in supplementary Table XIII}. Other important genes involved in FA metabolism, such as malonyl-CoA decarboxylase (Mlycd or MCD), fatty acid synthase (Fasn or FAS), and FA transporter protein (genes Slc27a1/4 in supplementary Table XIII) are all overall downregulated in both cell types. FA transporter protein appears to exhibit mixed response. Other genes, such as ATP citrate lyase (Acly) and citrate synthase (Cs), are not regulated in either cell type. Overall, energy metabolism is downregulated in both cell types, more so in RAW264.7 cells. For RAW264.7 cells, this may contribute in part to less cellular proliferation and more cell death (supplementary Figs. IV, V).
Fig. 6.

Changes in the genes and processes related to mitochondrial metabolism in RAW264.7 and TGEM cells treated with KLA. The up or down arrows indicate whether the gene (or most of the genes in the case of a pathway) is upregulated or downregulated commonly in both cells. For the genes showing different/unique regulation in the two cell types, the gene is enclosed in an ellipsoid and upregulation (red) or downregulation (green) is indicated in two circles (left circle, RAW264.7 cells; right circle, TGEM cells). Based on a diagram by Yihua Zhao.
Supplementary Material
Acknowledgments
The authors acknowledge the contributions of the late Dr. Christian Raetz, who was the former director of Core K for LIPID MAPS. The authors thank LIPID MAPS personnel Jeremy C. Allegood, Aaron Armando, Michelle D. Armstrong, Robert Byrnes, Christopher A. Haynes, Pavlina T. Ivanova, Samuel Kelly, Reza Kordestani, Holly A. Lincoln, Rebecca Shaner, and Elaine Wang for their technical assistance and Masada Disenhouse for administrative assistance. Walter A. Shaw, director of the synthesis core (Avanti Polar Lipids, Inc., Alabaster, AL), provided the standards for the lipid measurements. The authors appreciate the advice and support of Dr. Jean Chin, Program Director, National Institute of General Medical Sciences, the National Institutes of Health.
Footnotes
Abbreviations:
- ACS
- acyl-CoA synthase
- BMDM
- bone marrow-derived macrophage
- CAM
- cell adhesion molecule
- Cav1
- caveolin-1
- Ccl
- chemokine (C-C motif) ligand
- Cox
- cyclooxygenase
- CPT
- carnitine palmitoyltransferase
- Csf
- colony stimulating factor
- Cxcl
- chemokine (C-X-C motif) ligand
- EF
- enrichment factor
- Gadd45a
- growth arrest and DNA-damage-inducible 45 α Hmgcr, HMG-CoA reductase
- IKK
- IκB kinase
- iNOS
- inducible nitric oxide synthase
- IRAK
- IL-1 receptor-associated kinase
- IRF
- interferon response factor
- KEGG
- Kyoto Encyclopedia of Genes and Genomes
- KLA
- Kdo2-lipid A
- LPS
- lipopolysaccharide
- Lss
- lanosterol synthase
- LXR
- liver X receptor
- Marcks
- myristoylated alanine-rich protein kinase C substrate
- MCP
- monocyte chemotactic protein
- M-CSF
- macrophage colony-stimulating factor
- NF-κB
- nuclear factor kappa-light-chain-enhancer of activated B cells
- PG
- prostaglandin
- PKC
- protein kinase C
- PPAR
- peroxisome proliferator-activated receptor
- RANTES
- regulated on activation normal T-cell expressed and secreted
- S1P
- sphingosine-1-phosphate
- Sqle
- squalene epoxidase
- SR-BI
- scavenger receptor-BI
- TGEM
- thioglycolate-elicited peritoneal macrophage
- TLR
- toll-like receptor
- TNF
- tumor necrosis factor
Centralized funding for this research was provided by National Institute of General Medical Sciences Large-Scale Collaborative “Glue” Grant U54 GM-69338. This research was also supported by National Science Foundation Collaborative Grants DBI-0835541 and STC-0939370, and National Institutes of Health Collaborative Grants R01HL-106579 and R01HL-108735 to S.S.
The online version of this article (available at http://www.jlr.org) contains supplementary data in the form of six figures and six tables.
REFERENCES
- 1.Bird D. A., Gillotte K. L., Horkko S., Friedman P., Dennis E. A., Witztum J. L., Steinberg D. 1999. Receptors for oxidized low-density lipoprotein on elicited mouse peritoneal macrophages can recognize both the modified lipid moieties and the modified protein moieties: implications with respect to macrophage recognition of apoptotic cells. Proc. Natl. Acad. Sci. USA. 96: 6347–6352. [DOI] [PMC free article] [PubMed] [Google Scholar]
- 2.Liu G., Xia X. P., Gong S. L., Zhao Y. 2006. The macrophage heterogeneity: difference between mouse peritoneal exudate and splenic F4/80+ macrophages. J. Cell. Physiol. 209: 341–352. [DOI] [PubMed] [Google Scholar]
- 3.Shibata N., Glass C. K. 2009. Regulation of macrophage function in inflammation and atherosclerosis. J. Lipid Res. 50: S277–S281. [DOI] [PMC free article] [PubMed] [Google Scholar]
- 4.Rigamonti E., Chinetti-Gbaguidi G., Staels B. 2008. Regulation of macrophage functions by PPAR-alpha, PPAR-gamma, and LXRs in mice and men. Arterioscler. Thromb. Vasc. Biol. 28: 1050–1059. [DOI] [PubMed] [Google Scholar]
- 5.Jeyaseelan S., Young S. K., Fessler M. B., Liu Y., Malcolm K. C., Yamamoto M., Akira S., Worthen G. S. 2007. Toll/IL-1 receptor domain-containing adaptor inducing IFN-beta (TRIF)-mediated signaling contributes to innate immune responses in the lung during Escherichia coli pneumonia. J. Immunol. 178: 3153–3160. [DOI] [PubMed] [Google Scholar]
- 6.Archer K. A., Roy C. R. 2006. MyD88-dependent responses involving toll-like receptor 2 are important for protection and clearance of Legionella pneumophila in a mouse model of Legionnaires’ disease. Infect. Immun. 74: 3325–3333. [DOI] [PMC free article] [PubMed] [Google Scholar]
- 7.Cunnick J., Kaur P., Cho Y., Groffen J., Heisterkamp N. 2006. Use of bone marrow-derived macrophages to model murine innate immune responses. J. Immunol. Methods. 311: 96–105. [DOI] [PubMed] [Google Scholar]
- 8.Salojin K. V., Owusu I. B., Millerchip K. A., Potter M., Platt K. A., Oravecz T. 2006. Essential role of MAPK phosphatase-1 in the negative control of innate immune responses. J. Immunol. 176: 1899–1907. [DOI] [PubMed] [Google Scholar]
- 9.Raschke W. C., Baird S., Ralph P., Nakoinz I. 1978. Functional macrophage cell lines transformed by Abelson leukemia virus. Cell. 15: 261–267. [DOI] [PubMed] [Google Scholar]
- 10.Norris P. C., Reichart D., Dumlao D. S., Glass C. K., Dennis E. A. 2011. Specificity of eicosanoid production depends on the TLR-4-stimulated macrophage phenotype. J. Leukoc. Biol. 90: 563–574. [DOI] [PMC free article] [PubMed] [Google Scholar]
- 11.Rouzer C. A., Jacobs A. T., Nirodi C. S., Kingsley P. J., Morrow J. D., Marnett L. J. 2005. RAW264.7 cells lack prostaglandin-dependent autoregulation of tumor necrosis factor-alpha secretion. J. Lipid Res. 46: 1027–1037. [DOI] [PubMed] [Google Scholar]
- 12.Castrillo A., Mojena M., Hortelano S., Bosca L. 2001. Peroxisome proliferator-activated receptor-gamma-independent inhibition of macrophage activation by the non-thiazolidinedione agonist L-796,449. Comparison with the effects of 15-deoxy-delta(12,14)-prostaglandin J(2). J. Biol. Chem. 276: 34082–34088. [DOI] [PubMed] [Google Scholar]
- 13.Ricote M., Li A. C., Willson T. M., Kelly C. J., Glass C. K. 1998. The peroxisome proliferator-activated receptor-gamma is a negative regulator of macrophage activation. Nature. 391: 79–82. [DOI] [PubMed] [Google Scholar]
- 14.Matsuura M., Saito S., Hirai Y., Okamura H. 2003. A pathway through interferon-gamma is the main pathway for induction of nitric oxide upon stimulation with bacterial lipopolysaccharide in mouse peritoneal cells. Eur. J. Biochem. 270: 4016–4025. [DOI] [PubMed] [Google Scholar]
- 15.Gargalovic P., Dory L. 2003. Caveolins and macrophage lipid metabolism. J. Lipid Res. 44: 11–21. [DOI] [PubMed] [Google Scholar]
- 16.Lei M. G., Morrison D. C. 2000. Differential expression of caveolin-1 in lipopolysaccharide-activated murine macrophages. Infect. Immun. 68: 5084–5089. [DOI] [PMC free article] [PubMed] [Google Scholar]
- 17.Frank P. G., Lisanti M. P. 2004. Caveolin-1 and caveolae in atherosclerosis: differential roles in fatty streak formation and neointimal hyperplasia. Curr. Opin. Lipidol. 15: 523–529. [DOI] [PubMed] [Google Scholar]
- 18.Engelman J. A., Zhang X. L., Razani B., Pestell R. G., Lisanti M. P. 1999. p42/44 MAP kinase-dependent and -independent signaling pathways regulate caveolin-1 gene expression. Activation of Ras-MAP kinase and protein kinase a signaling cascades transcriptionally down-regulates caveolin-1 promoter activity. J. Biol. Chem. 274: 32333–32341. [DOI] [PubMed] [Google Scholar]
- 19.Meir K. S., Leitersdorf E. 2004. Atherosclerosis in the apolipoprotein-E-deficient mouse: a decade of progress. Arterioscler. Thromb. Vasc. Biol. 24: 1006–1014. [DOI] [PubMed] [Google Scholar]
- 20.Werb Z., Chin J. R. 1983. Onset of apoprotein E secretion during differentiation of mouse bone marrow-derived mononuclear phagocytes. J. Cell Biol. 97: 1113–1118. [DOI] [PMC free article] [PubMed] [Google Scholar]
- 21.Raetz C. R. H., Garrett T. A., Reynolds C. M., Shaw W. A., Moore J. D., Smith D. C., Jr, Ribeiro A. A., Murphy R. C., Ulevitch R. J., Fearns C., et al. 2006. Kdo2-Lipid A of Escherichia coli, a defined endotoxin that activates macrophages via TLR-4. J. Lipid Res. 47: 1097–1111. [DOI] [PubMed] [Google Scholar]
- 22.Dennis E. A., Deems R. A., Harkewicz R., Quehenberger O., Brown H. A., Milne S. B., Myers D. S., Glass C. K., Hardiman G., Reichart D., et al. 2010. A mouse macrophage lipidome. J. Biol. Chem. 285: 39976–39985. [DOI] [PMC free article] [PubMed] [Google Scholar]
- 23.LIPID Metabolites and Pathways Strategy (LIPID MAPS). Accessed April 23, 2013, at http://www.lipidmaps.org/.
- 24.MathWorks. Accessed May 14, 2013 at http://www.mathworks.com/.
- 25.Maurya M. R., Rengaswamy R., Venkatasubramanian V. 2007. Fault diagnosis using dynamic trend analysis: a review and recent developments. Eng. Appl. Artif. Intell. 20: 133–146. [Google Scholar]
- 26.Baldi P., Long A. D. 2001. A Bayesian framework for the analysis of microarray expression data: regularized t-test and statistical inferences of gene changes. Bioinformatics. 17: 509–519. [DOI] [PubMed] [Google Scholar]
- 27.Sabidó E., Quehenberger O., Shen Q., Chang C-Y., Shah I., Armando A. M., Andreyev A., Vitek O., Dennis E. A., Aebersold R. 2012. Targeted proteomics of the eicosanoid biosynthetic pathway completes an integrated genomics-proteomics-metabolomics picture of cellular metabolism. Mol. Cell. Proteomics. 11: M111.014746. [DOI] [PMC free article] [PubMed] [Google Scholar]
- 28.Subramaniam S., Fahy E., Gupta S., Sud M., Byrnes R. W., Cotter D., Dinasarapu A. R., Maurya M. R. 2011. Bioinformatics and systems biology of the lipidome. Chem. Rev. 111: 6452–6490. [DOI] [PMC free article] [PubMed] [Google Scholar]
- 29.Halperin Y., Linhart C., Ulitsky I., Shamir R. 2009. Allegro: analyzing expression and sequence in concert to discover regulatory programs. Nucleic Acids Res. 37: 1566–1579. [DOI] [PMC free article] [PubMed] [Google Scholar]
- 30.Juang Y. T., Lowther W., Kellum M., Au W. C., Lin R., Hiscott J., Pitha P. M. 1998. Primary activation of interferon A and interferon B gene transcription by interferon regulatory factor 3. Proc. Natl. Acad. Sci. USA. 95: 9837–9842. [DOI] [PMC free article] [PubMed] [Google Scholar]
- 31.Wietek C., Miggin S. M., Jefferies C. A., O'Neill L. A. J. 2003. Interferon regulatory factor-3-mediated activation of the interferon-sensitive response element by Toll-like receptor (TLR) 4 but not TLR3 requires the p65 subunit of NF-kappa. J. Biol. Chem. 278: 50923–50931. [DOI] [PubMed] [Google Scholar]
- 32.Yoneyama M., Suhara W., Fukuhara Y., Fukuda M., Nishida E., Fujita T. 1998. Direct triggering of the type I interferon system by virus infection: activation of a transcription factor complex containing IRF-3 and CBP/p300. EMBO J. 17: 1087–1095. [DOI] [PMC free article] [PubMed] [Google Scholar]
- 33.Platanias L. C. 2005. Mechanisms of type-I- and type-II-interferon-mediated signalling. Nat. Rev. Immunol. 5: 375–386. [DOI] [PubMed] [Google Scholar]
- 34.Schüttelkopf A. W., Hamilton G., Watts C., van Aalten D. M. 2006. Structural basis of reduction-dependent activation of human cystatin F. J. Biol. Chem. 281: 16570–16575. [DOI] [PubMed] [Google Scholar]
- 35.Honey K., Rudensky A. Y. 2003. Lysosomal cysteine proteases regulate antigen presentation. Nat. Rev. Immunol. 3: 472–482. [DOI] [PubMed] [Google Scholar]
- 36.Poltorak A., He X., Smirnova I., Liu M-Y., Huffel C. V., Du X., Birdwell D., Alejos E., Silva M., Galanos C., et al. 1998. Defective LPS signaling in C3H/HeJ and C57BL/10ScCr mice: mutations in Tlr4 gene. Science. 282: 2085–2088. [DOI] [PubMed] [Google Scholar]
- 37.Kawai T., Akira S. 2007. Signaling to NF-kappa] by Toll-like receptors. Trends Mol. Med. 13: 460–469. [DOI] [PubMed] [Google Scholar]
- 38.Pålsson-McDermott E. M., O'Neill L. A. 2004. Signal transduction by the lipopolysaccharide receptor, Toll-like receptor-4. Immunology. 113: 153–162. [DOI] [PMC free article] [PubMed] [Google Scholar]
- 39.Kawai T., Adachi O., Ogawa T., Takeda K., Akira S. 1999. Unresponsiveness of MyD88-deficient mice to endotoxin. Immunity. 11: 115–122. [DOI] [PubMed] [Google Scholar]
- 40.Naiki Y., Michelsen K. S., Schroder N. W. J., Alsabeh R., Slepenkin A., Zhang W., Chen S., Wei B., Bulut Y., Wong M. H., et al. 2005. MyD88 is pivotal for the early inflammatory response and subsequent bacterial clearance and survival in a mouse model of Chlamydia pneumoniae pneumonia. J. Biol. Chem. 280: 29242–29249. [DOI] [PubMed] [Google Scholar]
- 41.Kobayashi K., Hernandez L. D., Galan J. E., Janeway C. A., Jr, Medzhitov R., Flavell R. A. 2002. IRAK-M is a negative regulator of Toll-like receptor signaling. Cell. 110: 191–202. [DOI] [PubMed] [Google Scholar]
- 42.Yamamoto M., Sato S., Hemmi H., Hoshino K., Kaisho T., Sanjo H., Takeuchi O., Sugiyama M., Okabe M., Takeda K., et al. 2003. Role of adaptor TRIF in the MyD88-independent toll-like receptor signaling pathway. Science. 301: 640–643. [DOI] [PubMed] [Google Scholar]
- 43.Wertz I. E., O'Rourke K. M., Zhou H., Eby M., Aravind L., Seshagiri S., Wu P., Wiesmann C., Baker R., Boone D. L., et al. 2004. De-ubiquitination and ubiquitin ligase domains of A20 downregulate NF-kappaB signalling. Nature. 430: 694–699. [DOI] [PubMed] [Google Scholar]
- 44.Arai K. I., Lee F., Miyajima A., Miyatake S., Arai N., Yokota T. 1990. Cytokines: coordinators of immune and inflammatory responses. Annu. Rev. Biochem. 59: 783–836. [DOI] [PubMed] [Google Scholar]
- 45.Watowich S. S., Wu H., Socolovsky M., Klingmuller U., Constantinescu S. N., Lodish H. F. 1996. Cytokine receptor signal transduction and the control of hematopoietic cell development. Annu. Rev. Cell Dev. Biol. 12: 91–128. [DOI] [PubMed] [Google Scholar]
- 46.Robb L. 2007. Cytokine receptors and hematopoietic differentiation. Oncogene. 26: 6715–6723. [DOI] [PubMed] [Google Scholar]
- 47.van der Poll T., Keogh C. V., Guirao X., Buurman W. A., Kopf M., Lowry S. F. 1997. Interleukin-6 gene-deficient mice show impaired defense against pneumococcal pneumonia. J. Infect. Dis. 176: 439–444. [DOI] [PubMed] [Google Scholar]
- 48.Fensterl V., Sen G. C. 2009. Interferons and viral infections. Biofactors. 35: 14–20. [DOI] [PubMed] [Google Scholar]
- 49.Bankers-Fulbright J. L., Kalli K. R., McKean D. J. 1996. Interleukin-1 signal transduction. Life Sci. 59: 61–83. [DOI] [PubMed] [Google Scholar]
- 50.Funk C. D. 2001. Prostaglandins and leukotrienes: advances in eicosanoid biology. Science. 294: 1871–1875. [DOI] [PubMed] [Google Scholar]
- 51.Mizutani Y., Kihara A., Igarashi Y. 2005. Mammalian Lass6 and its related family members regulate synthesis of specific ceramides. Biochem. J. 390: 263–271. [DOI] [PMC free article] [PubMed] [Google Scholar]
- 52.Simons K., Ikonen E. 1997. Functional rafts in cell membranes. Nature. 387: 569–572. [DOI] [PubMed] [Google Scholar]
- 53.Edidin M. 2003. The state of lipid rafts: from model membranes to cells. Annu. Rev. Biophys. Biomol. Struct. 32: 257–283. [DOI] [PubMed] [Google Scholar]
- 54.Pike L. J. 2004. Lipid rafts: heterogeneity on the high seas. Biochem. J. 378: 281–292. [DOI] [PMC free article] [PubMed] [Google Scholar]
- 55.Brown D. A., London E. 1998. Functions of lipid rafts in biological membranes. Annu. Rev. Cell Dev. Biol. 14: 111–136. [DOI] [PubMed] [Google Scholar]
- 56.Pennings M., Meurs I., Ye D., Out R., Hoekstra M., Van Berkel T. J. C., Eck M. V. 2006. Regulation of cholesterol homeostasis in macrophages and consequences for atherosclerotic lesion development. FEBS Lett. 580: 5588–5596. [DOI] [PubMed] [Google Scholar]
- 57.de Villiers W. J., Smart E. J. 1999. Macrophage scavenger receptors and foam cell formation. J. Leukoc. Biol. 66: 740–746. [DOI] [PubMed] [Google Scholar]
- 58.van Eck M., Bos I. S., Kaminski W. E., Orso E., Rothe G., Twisk J., Bottcher A., Van Amersfoort E. S., Christiansen-Weber T. A., Fung-Leung W. P., et al. 2002. Leukocyte ABCA1 controls susceptibility to atherosclerosis and macrophage recruitment into tissues. Proc. Natl. Acad. Sci. USA. 99: 6298–6303. [DOI] [PMC free article] [PubMed] [Google Scholar]
- 59.Singaraja R. R., Fievet C., Castro G., James E. R., Hennuyer N., Clee S. M., Bissada N., Choy J. C., Fruchart J. C., McManus B. M., et al. 2002. Increased ABCA1 activity protects against atherosclerosis. J. Clin. Invest. 110: 35–42. [DOI] [PMC free article] [PubMed] [Google Scholar]
- 60.Aiello R. J., Brees D., Bourassa P. A., Royer L., Lindsey S., Coskran T., Haghpassand M., Francone O. L. 2002. Increased atherosclerosis in hyperlipidemic mice with inactivation of ABCA1 in macrophages. Arterioscler. Thromb. Vasc. Biol. 22: 630–637. [DOI] [PubMed] [Google Scholar]
- 61.Schmitz G., Kaminski W. E. 2002. ATP-binding cassette (ABC) transporters in atherosclerosis. Curr. Atheroscler. Rep. 4: 243–251. [DOI] [PubMed] [Google Scholar]
- 62.Dove D. E., Linton M. F., Fazio S. 2005. ApoE-mediated cholesterol efflux from macrophages: separation of autocrine and paracrine effects. Am. J. Physiol. Cell Physiol. 288: C586–C592. [DOI] [PubMed] [Google Scholar]
- 63.Dory L. 1989. Synthesis and secretion of apoE in thioglycolate-elicited mouse peritoneal macrophages: effect of cholesterol efflux. J. Lipid Res. 30: 809–816. [PubMed] [Google Scholar]
- 64.Tall A. R. 2008. Cholesterol efflux pathways and other potential mechanisms involved in the athero-protective effect of high density lipoproteins. J. Intern. Med. 263: 256–273. [DOI] [PubMed] [Google Scholar]
- 65.Aderem A. 1992. The MARCKS brothers: a family of protein kinase C substrates. Cell. 71: 713–716. [DOI] [PubMed] [Google Scholar]
- 66.Aderem A. A., Albert K. A., Keum M. M., Wang J. K. T., Greengard P., Cohn Z. A. 1988. Stimulus-dependent myristoylation of a major substrate for protein kinase C. Nature. 332: 362–364. [DOI] [PubMed] [Google Scholar]
- 67.Chang S., Stacey K. J., Chen J., Costelloe E. O., Aderem A., Hume D. A. 1999. Mechanisms of regulation of the MacMARCKS gene in macrophages by bacterial lipopolysaccharide. J. Leukoc. Biol. 66: 528–534. [DOI] [PubMed] [Google Scholar]
- 68.Hartwig J. H., Thelen M., Resen A., Janmey P. A., Nairn A. C., Aderem A. 1992. MARCKS is an actin filament crosslinking protein regulated by protein kinase C and calcium-calmodulin. Nature. 356: 618–622. [DOI] [PubMed] [Google Scholar]
- 69.Arbuzova A., Schmitz A. A. P., Vergeres G. 2002. Cross-talk unfolded: MARCKS proteins. Biochem. J. 362: 1–12. [DOI] [PMC free article] [PubMed] [Google Scholar]
- 70.Myat M. M., Anderson S., Allen L-A. H., Aderem A. 1997. MARCKS regulates membrane ruffling and cell spreading. Curr. Biol. 7: 611–614. [DOI] [PubMed] [Google Scholar]
- 71.Brooks G., Brooks S. F., Goss M. W. 1996. MARCKS functions as a novel growth suppressor in cells of melanocyte origin. Carcinogenesis. 17: 683–689. [DOI] [PubMed] [Google Scholar]
- 72.Otsuka M., Yang H. C. 1991. Decreased expression of the myristoylated alanine-rich C kinase substrate in transformed BALB/c 3T3 mouse fibroblasts. Biochem. Biophys. Res. Commun. 178: 494–500. [DOI] [PubMed] [Google Scholar]
- 73.Wojtaszek P. A., Stumpo D. J., Blackshear P. J., Macara I. G. 1993. Severely decreased MARCKS expression correlates with ras reversion but not with mitogenic responsiveness. Oncogene. 8: 755–760. [PubMed] [Google Scholar]
- 74.Manenti S., Malecaze F., Chap H., Darbon J-M. 1998. Overexpression of the myristoylated alanine-rich C kinase substrate in human choroidal melanoma cells affects cell proliferation. Cancer Res. 58: 1429–1434. [PubMed] [Google Scholar]
- 75.Barreto G., Schafer A., Marhold J., Stach D., Swaminathan S. K., Handa V., Doderlein G., Maltry N., Wu W., Lyko F., et al. 2007. Gadd45a promotes epigenetic gene activation by repair-mediated DNA demethylation. Nature. 445: 671–675. [DOI] [PubMed] [Google Scholar]
- 76.Honda R., Lowe E. D., Dubinina E., Skamnaki V., Cook A., Brown N. R., Johnson L. N. 2005. The structure of cyclin E1/CDK2: implications for CDK2 activation and CDK2-independent roles. EMBO J. 24: 452–463. [DOI] [PMC free article] [PubMed] [Google Scholar]
- 77.Cole A. M., Myant K., Reed K. R., Ridgway R. A., Athineos D., Van den Brink G. R., Muncan V., Clevers H., Clarke A. R., Sicinski P., et al. 2010. Cyclin D2-cyclin-dependent kinase 4/6 is required for efficient proliferation and tumorigenesis following Apc loss. Cancer Res. 70: 8149–8158. [DOI] [PMC free article] [PubMed] [Google Scholar]
- 78.Cortez D., Glick G., Elledge S. J. 2004. Minichromosome maintenance proteins are direct targets of the ATM and ATR checkpoint kinases. Proc. Natl. Acad. Sci. USA. 101: 10078–10083. [DOI] [PMC free article] [PubMed] [Google Scholar]
- 79.Duncker B. P., Chesnokov I. N., McConkey B. J. 2009. The origin recognition complex protein family. Genome Biol. 10: 214. [DOI] [PMC free article] [PubMed] [Google Scholar]
- 80.Hoffmann A., Levchenko A., Scott M. L., Baltimore D. 2002. The Ikappa B-NF-kappa B signaling module: temporal control and selective gene activation. Science. 298: 1241–1245. [DOI] [PubMed] [Google Scholar]
- 81.Maceyka M., Milstien S., Spiegel S. 2009. Sphingosine-1-phosphate: the Swiss army knife of sphingolipid signaling. J. Lipid Res. 50: S272–S276. [DOI] [PMC free article] [PubMed] [Google Scholar]
- 82.Takabe K., Paugh S. W., Milstien S., Spiegel S. 2008. “Inside-out” signaling of sphingosine-1-phosphate: therapeutic targets. Pharmacol. Rev. 60: 181–195. [DOI] [PMC free article] [PubMed] [Google Scholar]
- 83.Spiegel S., Milstien S. 2003. Sphingosine-1-phosphate: an enigmatic signalling lipid. Nat. Rev. Mol. Cell Biol. 4: 397–407. [DOI] [PubMed] [Google Scholar]
- 84.Cuvillier O., Pirianov G., Kleuser B., Vanek P. G., Coso O. A., Gutkind S., Spiegel S. 1996. Suppression of ceramide-mediated programmed cell death by sphingosine-1-phosphate. Nature. 381: 800–803. [DOI] [PubMed] [Google Scholar]
- 85.Scott W. A., Pawlowski N. A., Murray H. W., Andreach M., Zrike J., Cohn Z. A. 1982. Regulation of arachidonic acid metabolism by macrophage activation. J. Exp. Med. 155: 1148–1160. [DOI] [PMC free article] [PubMed] [Google Scholar]
- 86.Humes J. L., Burger S., Galavage M., Kuehl F. A., Jr, Wightman P. D., Dahlgren M. E., Davies P., Bonney R. J. 1980. The diminished production of arachidonic acid oxygenation products by elicited mouse peritoneal macrophages: possible mechanisms. J. Immunol. 124: 2110–2116. [PubMed] [Google Scholar]
- 87.Gilchrist M., Thorsson V., Li B., Rust A. G., Korb M., Roach J. C., Kennedy K., Hai T., Bolouri H., Aderem A. 2006. Systems biology approaches identify ATF3 as a negative regulator of Toll-like receptor 4. Nature. 441: 173–178. [Erratum. 2008. Nature. 451: 1022.] [DOI] [PubMed] [Google Scholar]
- 88.Brown M. S., Goldstein J. L. 1974. Suppression of 3-hydroxy-3-methylglutaryl coenzyme A reductase activity and inhibition of growth of human fibroblasts by 7-ketocholesterol. J. Biol. Chem. 249: 7306–7314. [PubMed] [Google Scholar]
- 89.Kandutsch A. A., Chen H. W. 1974. Inhibition of sterol synthesis in cultured mouse cells by cholesterol derivatives oxygenated in the side chain. J. Biol. Chem. 249: 6057–6061. [PubMed] [Google Scholar]
- 90.Lehmann J. M., Kliewer S. A., Moore L. B., Smith-Oliver T. A., Oliver B. B., Su J. L., Sundseth S. S., Winegar D. A., Blanchard D. E., Spencer T. A., et al. 1997. Activation of the nuclear receptor LXR by oxysterols defines a new hormone response pathway. J. Biol. Chem. 272: 3137–3140. [DOI] [PubMed] [Google Scholar]
- 91.Nishimura T., Inoue T., Shibata N., Sekine A., Takabe W., Noguchi N., Arai H. 2005. Inhibition of cholesterol biosynthesis by 25-hydroxycholesterol is independent of OSBP. Genes Cells. 10: 793–801. [DOI] [PubMed] [Google Scholar]
- 92.Peet D. J., Turley S. D., Ma W., Janowski B. A., Lobaccaro J. M., Hammer R. E., Mangelsdorf D. J. 1998. Cholesterol and bile acid metabolism are impaired in mice lacking the nuclear oxysterol receptor LXR alpha. Cell. 93: 693–704. [DOI] [PubMed] [Google Scholar]
- 93.Wang Y., Rogers P. M., Su C., Varga G., Stayrook K. R., Burris T. P. 2008. Regulation of cholesterologenesis by the oxysterol receptor, LXRalpha. J. Biol. Chem. 283: 26332–26339. [DOI] [PMC free article] [PubMed] [Google Scholar]
- 94.Castrillo A., Joseph S. B., Marathe C., Mangelsdorf D. J., Tontonoz P. 2003. Liver X receptor-dependent repression of matrix metalloproteinase-9 expression in macrophages. J. Biol. Chem. 278: 10443–10449. [DOI] [PubMed] [Google Scholar]
- 95.Castrillo A., Joseph S. B., Vaidya S. A., Haberland M., Fogelman A. M., Cheng G., Tontonoz P. 2003. Crosstalk between LXR and toll-like receptor signaling mediates bacterial and viral antagonism of cholesterol metabolism. Mol. Cell. 12: 805–816. [DOI] [PubMed] [Google Scholar]
- 96.Bensinger S. J., Bradley M. N., Joseph S. B., Zelcer N., Janssen E. M., Hausner M. A., Shih R., Parks J. S., Edwards P. A., Jamieson B. D., et al. 2008. LXR signaling couples sterol metabolism to proliferation in the acquired immune response. Cell. 134: 97–111. [DOI] [PMC free article] [PubMed] [Google Scholar]
- 97.Joseph S. B., Castrillo A., Laffitte B. A., Mangelsdorf D. J., Tontonoz P. 2003. Reciprocal regulation of inflammation and lipid metabolism by liver X receptors. Nat. Med. 9: 213–219. [DOI] [PubMed] [Google Scholar]
- 98.Ninomiya Y., Yasuda T., Kawamoto M., Yuge O., Okazaki Y. 2007. Liver X receptor ligands inhibit the lipopolysaccharide-induced expression of microsomal prostaglandin E synthase-1 and diminish prostaglandin E2 production in murine peritoneal macrophages. J. Steroid Biochem. Mol. Biol. 103: 44–50. [DOI] [PubMed] [Google Scholar]
- 99.Ogawa D., Stone J. F., Takata Y., Blaschke F., Chu V. H., Towler D. A., Law R. E., Hsueh W. A., Bruemmer D. 2005. Liver x receptor agonists inhibit cytokine-induced osteopontin expression in macrophages through interference with activator protein-1 signaling pathways. Circ. Res. 96: e59–e67. [DOI] [PubMed] [Google Scholar]
- 100.Cabrero A., Cubero M., Llaverias G., Jove M., Planavila A., Alegret M., Sanchez R., Laguna J. C., Carrera M. V. 2003. Differential effects of peroxisome proliferator-activated receptor activators on the mRNA levels of genes involved in lipid metabolism in primary human monocyte-derived macrophages. Metabolism. 52: 652–657. [DOI] [PubMed] [Google Scholar]
- 101.Garrett R. H., Grisham C. M. 2010. Biochemistry. 4th edition. Brooks/Cole, Cengage Learning, Boston, MA. [Google Scholar]
- 102.Barnes S. J., Weitzman P. D. 1986. Organization of citric acid cycle enzymes into a multienzyme cluster. FEBS Lett. 201: 267–270. [DOI] [PubMed] [Google Scholar]
Associated Data
This section collects any data citations, data availability statements, or supplementary materials included in this article.