Abstract
Both pharmacophore models of the human ether-à-go-go-related gene (hERG) channel blockers and phospholipidosis (PLD) inducers contain a hydrophobic moiety and a hydrophilic motif / positively charged center, so it is interesting to investigate the overlap between the ligand chemical spaces of both targets. We have assayed over 4,000 non-redundant drug-like compounds for both their hERG inhibitory activity and PLD inducing potential in a quantitative high throughput screening (qHTS) format. Seventy-seven percent of PLD inducing compounds identified from the screening were also found to be hERG channel blockers, and 96.9% of the dually active compounds were positively charged. Among the 48 compounds that induced PLD without inhibiting hERG channel, 24 compounds (50.0%) carried steroidal structures. According to our results, hERG channel blockers and PLD inducers share a large chemical space. In addition, a positively charged hERG channel blocker will most likely induce PLD, while a steroid PLD inducer is less likely a hERG channel blocker.
Keywords: hERG, phospholipidosis, qHTS
Drug-induced QT interval prolongation has demonstrated great impact on drug discovery, and has resulted in several drugs withdrawn from the market.1 QT prolongation, which can potentially develop into the life-threatening ventricular tachyarrhythmia called Torsades de Pointes, is frequently associated with mutations in or blockage of a potassium ion (K+) channel – the human ether-à-go-go-related gene (hERG) encoded channel.2, 3 The hERG encoding proteins form pores on the surface of cell membranes that can open or close in response to the membrane voltage.4, 5 Although a broad spectrum of structurally diverse chemicals can block the hERG channel, many of them share some common pharmacophores – a positively charged center plus one or two hydrophobic sites.6 Interestingly, these hERG pharmacophores resemble the structural requirements for compounds that can induce phospholipidosis (PLD), another side effect that should be avoided in drug discovery.7
Phospholipids are important members of the lipid family. They are the major components of all cell membranes, serving an extremely important function in the human bodies – enclosing the cytoplasm and other contents in a cell. A phospholipid is composed of two fatty acids, a glycerol unit, a phosphate group and a polar molecule such as choline. Like many other lipids, phospholipids are amphiphilic – the phosphate group and polar head region of the molecule is hydrophilic, while the fatty acid tail is hydrophobic. When placed in water, phospholipids will orient themselves into a bilayer in which the non-polar tail region forms the inner layer of the bilayer, and the polar head region forms the outer layer that interacts with the water.
Phospholipidosis (PLD) is a type of phospholipid storage disorder characterized by excessive accumulation of intracellular phospholipids in a variety of tissue types, including lung, liver, brain, kidney, heart, circulating lymphocytes, etc.7 Many drugs can accumulate in these tissues to a remarkable degree by forming complexes with the polar phospholipids in the lysosome, giving rise to the so-called drug-induced PLD.8 Many PLD inducing drugs share some common structural features – typically a hydrophobic region with one or more aromatic rings and a hydrophilic side chain with one or more positively charged centers at physiological pH.9 These compounds are also known as cationic amphiphilic drugs (CADs).8 In this study, we investigated the extent to which hERG blockers overlap with PLD inducers using data generated from the primary qHTS of cell-based PLD and hERG channel assays.
Compounds from two collections were included in this study – Sigma’s Library of Pharmacologically Active Compounds (LOPAC:1280 compounds), and the National Institutes of Health Chemical Genomics Center (NCGC) Pharmaceutical Collection (NPC: 2816 compounds) of approved and investigational drugs.10 The library was screened for the induction of phospholipidosis in HepG2 cells, a human hepatocellular carcinoma, and the inhibition of hERG channel that was expressed in U-2 OS cells, a human osteosarcoma cell line. The details of the qHTS assays have been published elsewhere.11, 12
After the primary qHTS, a concentration-response curve (CRC) was generated for every compound with concentrations ranging from 2.45 nM to 38 μM. Analysis of compound CRC was performed as previously described.13 Concentration–response data for each compound were fitted to a four-parameter Hill equation, yielding concentrations of half-maximal activity (AC50) and maximal response (efficacy) values. Compounds were designated as Class 1–4 according to the type of CRC observed.13 Curve classes are heuristic measures of data confidence, classifying concentration–responses on the basis of efficacy, the number of data points observed above background activity, and the quality of fit. Compounds with class 1.1, 1.2, 2.1 or 2.2 with > 50% efficacy were defined as active. Compounds with class 4 curves were defined as inactive and compounds with other curve classes were considered inconclusive. The compounds were processed through a Pipeline Pilot14 protocol to remove salts, redundant, and heavy metal containing compounds. Originally, active, inconclusive and inactive compounds were assigned a score of 2, 1, and 0 respectively. An average score was computed for replicated compounds. The compound was labeled active if the average score was above 1.5, or inactive if the score was below 0.5. The compounds with a score between 0.5 and 1.5 were considered inconclusive and removed from the dataset.
After removal of inconclusive compounds, the remaining 2,734 of the 4,096 compounds comprise the working dataset with assigned activities against both hERG channel and PLD assays. There were 386 (14.1%) compounds showing hERG channel inhibition activity, 209 (7.6%) compounds exhibiting PLD inducing potential, and 161 (5.9%) compounds demonstrating dual activity. More than three quarters (77.0%) of the PLD inducers were also hERG inhibitors (Fig. 1a). Figure 2 depicts a typical hERG / PLD dual ligand, three pharmacophore features of which, one cation and two hydrophobes, are common structural features of hERG blockers. These features fit the general definition of CADs, which are likely known PLD inducers.
Figure 1.
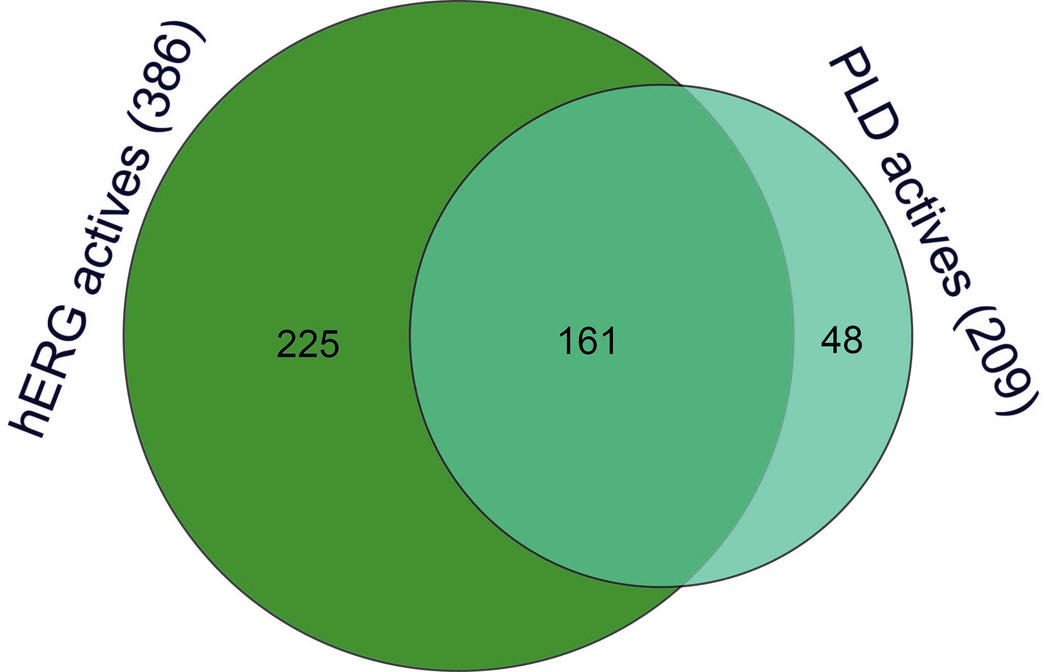
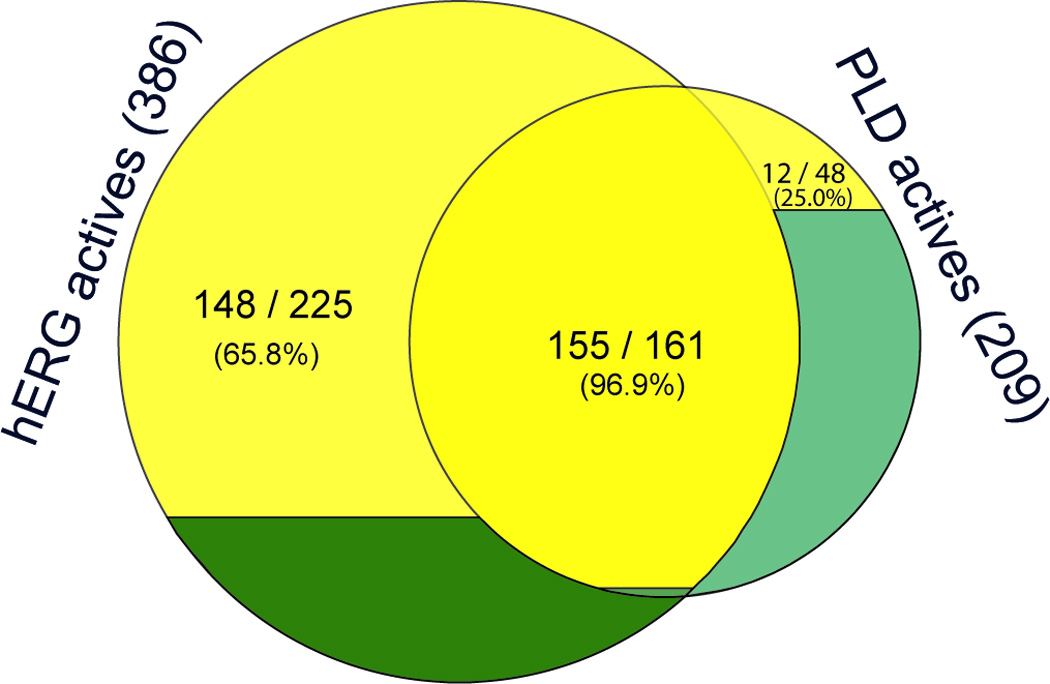
Venn diagrams showing (a) the overlap between the hERG blockers and PLD inducers, and (b) the percentages of positively charged molecules (colored in yellow) in hERG only, PLD only and dual ligands.
Figure 2.
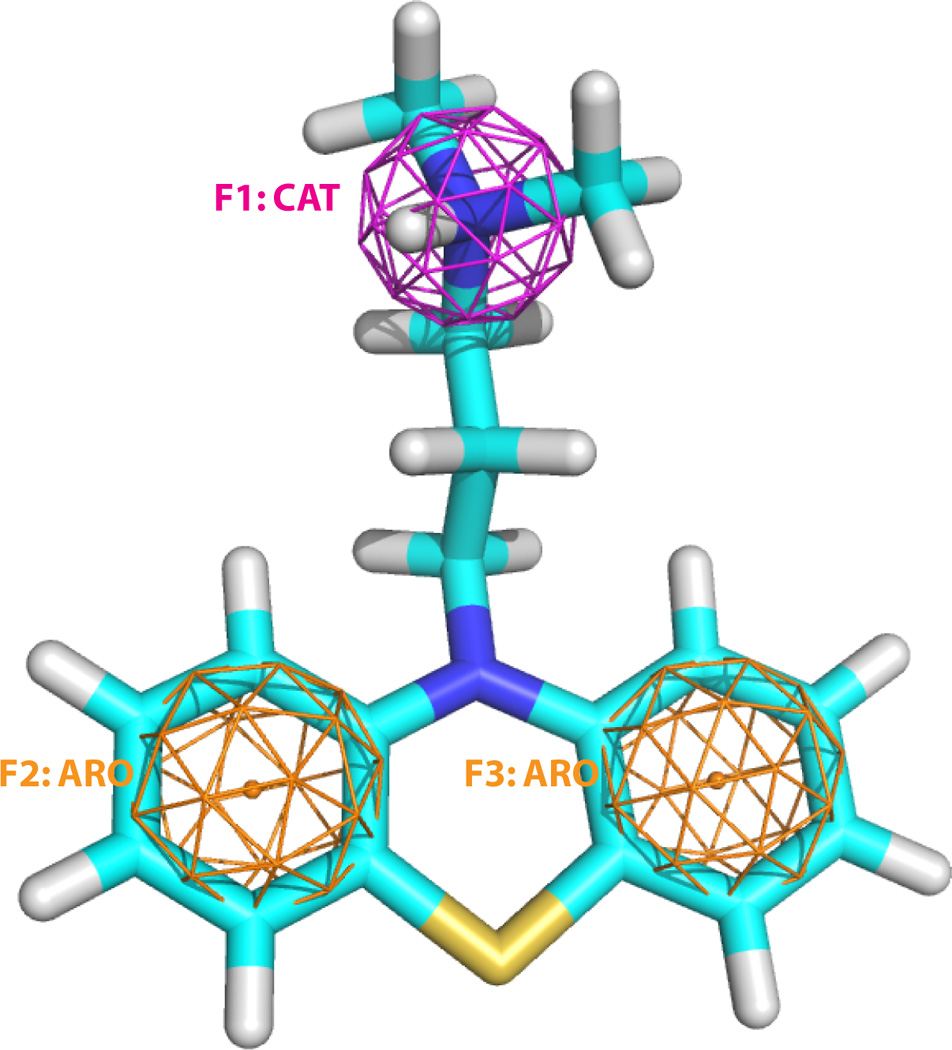
The structure of the antipsychotic drug Promazine, both a hERG blocker and a PLD inducer, and its pharmacophore features. F1 is cation, and F2 and F3 are aromatic.
155 of the 161, or 96.3%, dual hERG/PLD ligands are positively charged molecules. The percentage of positively charged molecules dropped to 65.8% (148 / 225) (p-value = 1.29×10⁻¹¹) for the compounds inhibiting hERG channel without inducing PLD. There were only 25.0% (12 / 48) positively charged molecules that showed PLD activity but not active against hERG channel (Fig. 1b). The results indicated that a positively charged hERG blocker has a greater chance to induce PLD than a neutral compound, and a neutral or negatively charged PLD inducer is less likely to inhibit hERG function.
None of 161 dual ligands carried a steroidal structure. However, among the 225 hERG-only ligands, four, or 1.8%, are steroids, and all these four steroids are ketones (Fig. 3). These four ketone steroids have ketone in one end and another hydrophilic group, such as ester, in the other end of the molecule, therefore they are not amphiphilic. As a result, they did not induce PLD. A significant enrichment (p-value = 2.67×10⁻¹⁷) of steroids was observed in the PLD-only ligands – 50% of the 48 PLD-only ligands have steroidal structures.
Figure 3.
The structures of four ketone steroids that block the hERG channel without inducing PLD.
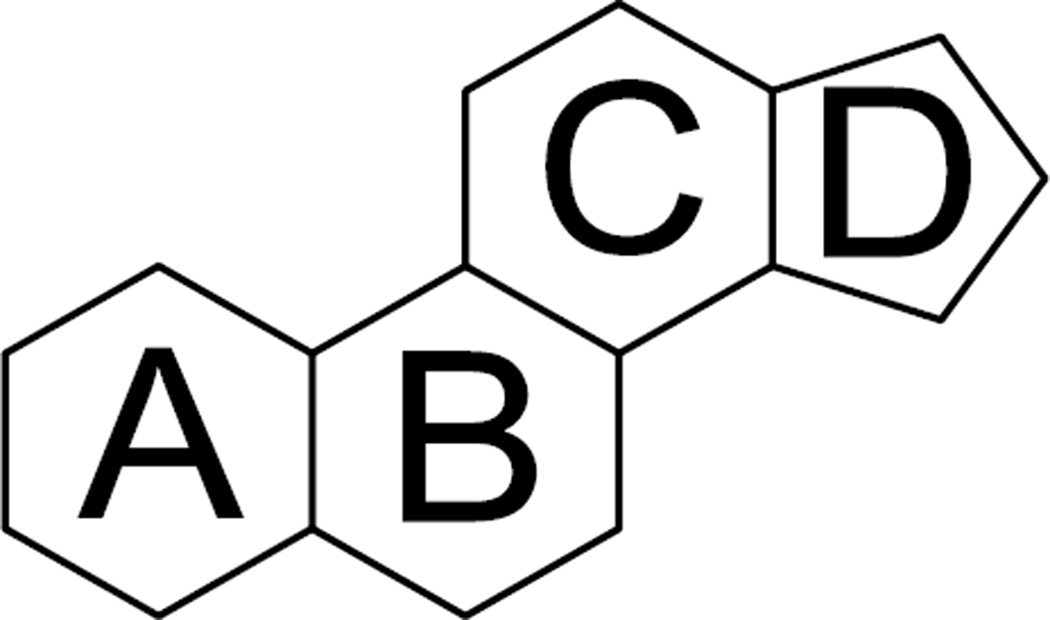
Steroids, derived from the same fused four-ring core skeleton (Fig. 4), are known to form nonspecific interactions with phospholipids.15–18 Actually, steroids are major lipid constituents of many membranes of mammalian cells. The mechanism of PLD induction by some steroids is not clear and needs further investigation. There were totally 133 steroids in the dataset and 24 of which induced PLD (p-value = 1.26×10⁻⁴). It is worth noting that there were 10 steroids, where ring A is a phenyl ring, and none of them induced PLD. Among the 109 steroids that did not induce PLD, there was only one coupled to saccharides, while 7 of 24 PLD inducing steroids had saccharides attached to ring A through an ether bond.
Figure 4.
The fused four-ring core skeleton of steroids.
Analysis of the 2,734 non-redundant drug-like molecules with conclusive PLD and hERG channel activities resulted in the following observations (Fig. 5): 1. 386 (14.1%) compounds were active in the hERG channel inhibition assay, 209 (7.6%) compounds exhibited PLD inducing potential, and 161 (5.9%) compounds demonstrated dual activity; 2. 77.0% of PLD positive compounds also blocked hERG channel; 3. 96.3% of hERG / PLD dual ligands were found positively charged, while the percentage dropped to 65.8% and 25.0% for hERG+/PLD-and hERG−/PLD+ compounds. In other words, a positively charged PLD inducer is most likely a hERG blocker, while a positively charged hERG blocker may not induce PLD; 4. Half of 48 hERG−/PLD+ compounds were steroids, and 7 of them carrying saccharides; while none of the dual ligands had steroidal structure and only four hERG+/PLD− compounds were ketone steroids; 5. None of the 10 steroids with a phenyl ring in ring A showed activity in either assays. The observations unveiled a clear linkage between the chemical space of hERG channel blockers and PLD inducers, and offered a general guideline to avoid PLD activities in the projects where the hERG channel is the therapeutic target.19
Figure 5.
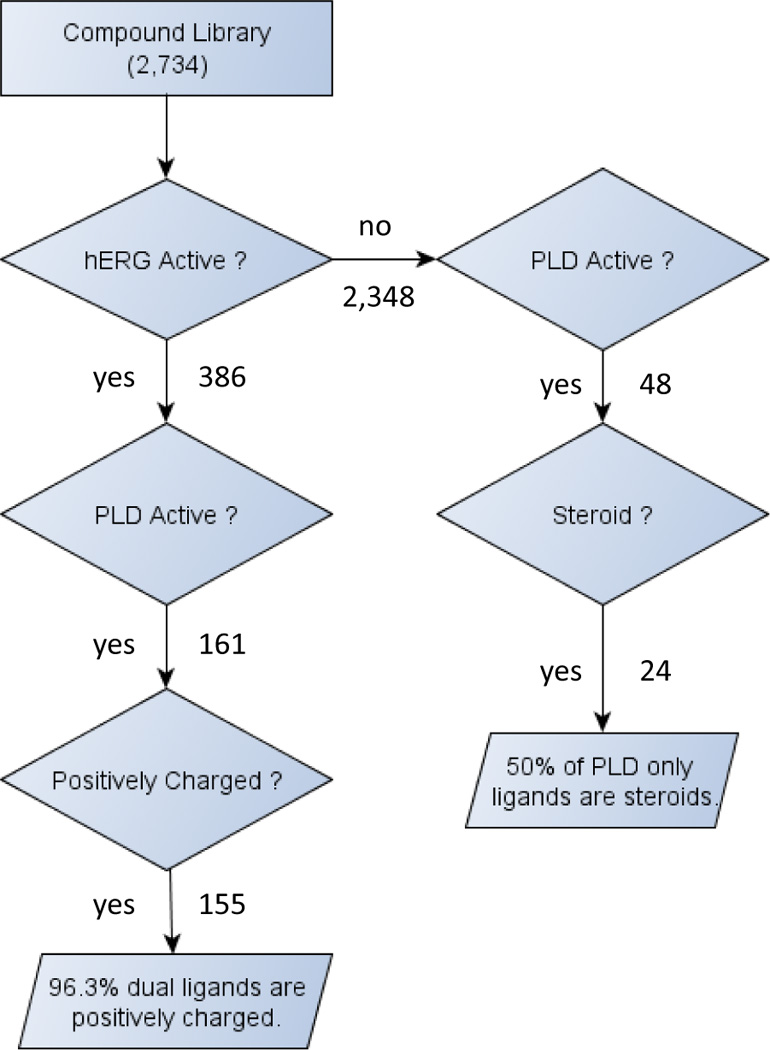
The flow chart of hERG channel blockers and PLD inducers.
Footnotes
Publisher's Disclaimer: This is a PDF file of an unedited manuscript that has been accepted for publication. As a service to our customers we are providing this early version of the manuscript. The manuscript will undergo copyediting, typesetting, and review of the resulting proof before it is published in its final citable form. Please note that during the production process errors may be discovered which could affect the content, and all legal disclaimers that apply to the journal pertain.
References
- 1.Fermini B, Fossa AA. Nat Rev Drug Discov. 2003;2:439. doi: 10.1038/nrd1108. [DOI] [PubMed] [Google Scholar]
- 2.Towbin JA, Wang Z, Li H. Drug Metab Dispos. 2001;29:574. [PubMed] [Google Scholar]
- 3.Antzelevitch C, Shimizu W. Curr Opin Cardiol. 2002;17:43. doi: 10.1097/00001573-200201000-00007. [DOI] [PubMed] [Google Scholar]
- 4.Jiang Y, Lee A, Chen J, Ruta V, Cadene M, Chait BT, MacKinnon R. Nature. 2003;423:33. doi: 10.1038/nature01580. [DOI] [PubMed] [Google Scholar]
- 5.Mitcheson JS, Chen J, Lin M, Culberson C, Sanguinetti MC. Proc Natl Acad Sci U S A. 2000;97:12329. doi: 10.1073/pnas.210244497. [DOI] [PMC free article] [PubMed] [Google Scholar]
- 6.Aronov AM. Drug Discov Today. 2005;10:149. doi: 10.1016/S1359-6446(04)03278-7. [DOI] [PubMed] [Google Scholar]
- 7.Anderson N, Borlak J. FEBS Lett. 2006;580:5533. doi: 10.1016/j.febslet.2006.08.061. [DOI] [PubMed] [Google Scholar]
- 8.Lullmann H, Lullmannrauch R, Wassermann O. Biochem Pharmacol. 1978;27:1103. doi: 10.1016/0006-2952(78)90435-5. [DOI] [PubMed] [Google Scholar]
- 9.Ploemen JPHTM, Kelder J, Hafmans T, Van De Sandt H, van Burgsteden JA, Salemink PJM, Van Esch E. Exp Toxicol Pathol. 2004;55:347. doi: 10.1078/0940-2993-00338. [DOI] [PubMed] [Google Scholar]
- 10.Huang R, Southall N, Wang Y, Yasgar A, Shinn P, Jadhav A, Nguyen DT, Austin CP. Sci Transl Med. 2011;3:80ps16. doi: 10.1126/scitranslmed.3001862. [DOI] [PMC free article] [PubMed] [Google Scholar]
- 11.Xia M, Shahane SA, Huang R, Titus SA, Shum E, Zhao Y, Southall N, Zheng W, Witt KL, Tice RR, Austin CP. Toxicol Appl Pharmacol. 2011;252:250. doi: 10.1016/j.taap.2011.02.016. [DOI] [PMC free article] [PubMed] [Google Scholar]
- 12.Shahane S, Huang R, Gerhold D, Austin CP, Xia M. Journal of Biomolecular Screening. doi: 10.1177/1087057113502851. Submitted. [DOI] [PMC free article] [PubMed] [Google Scholar]
- 13.Inglese J, Auld DS, Jadhav A, Johnson RL, Simeonov A, Yasgar A, Zheng W, Austin CP. Proc Natl Acad Sci U S A. 2006;103:11473. doi: 10.1073/pnas.0604348103. [DOI] [PMC free article] [PubMed] [Google Scholar]
- 14. [Accessed 04/24/2011]; http://accelrys.com/products/pipeline-pilot/
- 15.Makriyannis A, DiMeglio CM, Fesik SW. J Med Chem. 1991;34:1700. doi: 10.1021/jm00109a024. [DOI] [PubMed] [Google Scholar]
- 16.Huang CH. Nature. 1976;259:242. doi: 10.1038/259242a0. [DOI] [PubMed] [Google Scholar]
- 17.Yeagle PL, Hutton WC, Huang CH, Martin RB. Proc Natl Acad Sci U S A. 1975;72:3477. doi: 10.1073/pnas.72.9.3477. [DOI] [PMC free article] [PubMed] [Google Scholar]
- 18.Mavromoustakos T, Theodoropoulou E, Yang DP. Biochim Biophys Acta. 1997;1328:65. doi: 10.1016/s0005-2736(97)00078-3. [DOI] [PubMed] [Google Scholar]
- 19.Witchel HJ. Expert Opin Ther Targets. 2007;11:321. doi: 10.1517/14728222.11.3.321. [DOI] [PubMed] [Google Scholar]


