Abstract
Hyperpolarized 13C magnetic resonance spectroscopy (MRS) provides a unique opportunity to detect real-time metabolic fluxes as a means to measure metabolic treatment responses in vivo. Here we show that pharmacological inhibition of lactate dehydrogenase A suppressed the conversion of hyperpolarized 13C-pyruvate to lactate in murine xenografts of P493 human lymphoma. In contrast, a glutaminase inhibitor reduced conversion of 13C-pyruvate to alanine without affecting conversion of pyruvate to lactate. These results illustrate the ability to monitor biomarkers for responses to anti-metabolic therapy in real time, paving the way for clinical development of imaging biomarkers to monitor metabolic pharmacodynamics.
Introduction
Many cancer cells are characterized by high rates of glucose uptake and elevated lactate production. Oncogenes and tumor suppressors can be directly linked to oncogenic alterations of cancer metabolism and increased glucose metabolism1–3. Glucose metabolism is initiated by glucose transporters (GLUT) and hexokinases (HK) which result in glucose being trapped via intracellular phosphorylation. The six carbon glucose molecule is further catabolized to three carbon pyruvate, which is converted to alanine through transamination, and to acetyl-CoA by pyruvate dehydrogenase for oxidation in the TCA cycle, or to lactate by lactate dehydrogenase A (LDH-A). Increased glycolysis has a number of relevant sequelae, including acid production and the diversion of glucose-derived carbons to anabolic processes. Besides glycolysis, glutaminolysis, in which glutaminase converts glutamine to glutamate for oxidation in the tricarboxylic acid (TCA) cycle, provides a major nitrogen and carbon source for the growing cells. The glutamine skeleton is also vital for the production of aspartate and other amino acids.
The tetrameric LDH-A enzyme kinetically favors the conversion of pyruvate to lactate, a hallmark of the Warburg effect, and hence is an attractive therapeutic target. Underscoring its appeal as a target are the high levels of LDH-A that have been documented in human cancers4. We have recently observed that inhibition of LDH-A with a small drug-like molecule, FX11, curbed lymphoma and pancreatic tumor growth, with the caveat that there could be off-target effects in vivo5. We further documented that an allosteric inhibitor of glutaminase, bis-2-(5-phenylacetamido-1,2,4-diathiazol-2-yl) ethyl sulfide (BPTES), could also delay the growth of lymphoma xenografts6. Hence, cancer metabolism as a maturing field holds promise for new therapeutic agents. Currently, the ability to detect metabolism clinically is largely limited to 18F-fluorodeoxyglucose PET imaging of glucose uptake into tumors7. Notably, 18F labeled tracers of glutamine metabolism are in development8. Although it is highly sensitive, PET imaging is unable to dynamically measure metabolic conversion and is thus generally limited to static measures of tissue accumulation.
13C magnetic resonance spectroscopy (MRS) has long been used in the investigation of static metabolic processes in vivo9. Recently, with the advent of dynamic nuclear polarization (DNP) techniques, 13C MR spectroscopy and imaging can measure dynamics of metabolic conversions in vivo10. DNP (“hyperpolarization”) can increase 13C-MRS sensitivity by 10,000-fold or more, allowing for detection of 13C-labeled compounds and their downstream metabolic products in real time in vivo10–12. In DNP, the large polarization of electron spins is transferred to the nuclear spins, enhancing the signal intensities for subsequent nuclear magnetic resonance (NMR) spectroscopy and imaging. Flux exchange of hyperpolarized 13C label between pyruvate and lactate is governed by the combination of: tumor perfusion, membrane transport of pyruvate, endogenous lactate concentration, and lactate dehydrogenase (LDH) activity13–14. The principal drawback of DNP, is the short spin-lattice relaxation time (T1), which leads to polarization decay. Notably, the T1 of [1-13C] pyruvate is about 30 – 40 seconds in vivo, which is sufficient to measure metabolic interconversion. Signal is observable for 5 × T1, which means that the material must be injected and imaged within ~ 2 to 3 minutes. Several orders of magnitude enhancement of the NMR signal, combined with the long T1 relaxation time, make this a promising technique for hyperpolarizing tracers with potential applications in medical imaging.
In the present study, we report that 13C MRS can assess the metabolic conversion of lactate from pyruvate and, consequently evaluate the in vivo efficacy of a LDH-A inhibitor (FX11) to cancer treatment. We monitored the dynamic conversion of hyperpolarized [1-13C]-pyruvate to lactate and detected responses of tumors to FX11 treatment aimed at inhibiting LDH-A. Inhibition of glutaminase with BPTES, which could also curb tumor growth, did not affect the conversion of pyruvate to lactate and was comparable with DMSO vehicle control treated tumors. BPTES did, however, reduce the conversion of [1-13C]-pyruvate to alanine, which was also observable in these dynamic scans. FX11 had no significant effect on pyruvate-to-alanine conversion. Our studies establish for the first time the use of hyperpolarized [1-13C]-pyruvate to distinguish the responses of tumors to inhibition of LDH-A and glutaminase, relative to vehicle controls.
Materials and Methods
Animal Studies
All animal experiments were performed in accordance with the NIH Guide for the Care and Use of Laboratory Animals and were approved by the Institutional Animal Care and Use Committee (IACUC) of the University of South Florida, which regulates animal care and use at the Moffitt Cancer Center. To generate the xenograft model, 2.0 × 10⁷ P493 human lymphoma B cells were injected s.c. into male SCID mice (National Cancer Institute) as previously described (Ref. 5). When the tumor volume reached about 700 mm3 (within 3 – 4 weeks), mice were injected daily with control 2% (vol/vol) DMSO or 42 µg of FX11 (2.1 mg/kg bodyweight) and 200 µg (10 mg/kg bodyweight) of BPTES via intraperitoneal (i.p.) injection to monitor therapy response. Tumor volumes were calculated using the following formula: [length (mm) × width (mm) × width (mm) × 0.52].
To prepare mice for 13C MRS studies, a jugular catheter was surgically implanted to facilitate injections. The jugular vein, rather than tail vein, was used for MRS experiments as it accommodates larger injectate volumes (up to 0.5 mL, compared to 0.2 mL) and multiple injections in tail veins of the same animal were associated with a high failure rate. Jugular vein catheterization allowed multiple injections over a week for therapy response study. The tumors were treated with FX11 or BPTES for seven days, whereas the control group received DMSO. 13C MRS acquisitions continued every 24 hours for a week.
For the MRI/MRS studies, mice were induced with isofluorane in a plastic anesthesia chamber with scavenging. Once unconscious, they were placed in a mouse-specific holder within the MRI coil, outfitted with a mouse-specific nose cone inhalant anesthesia and scavenging system for imaging. This system also contained a pad for respiration monitoring, an endorectal fiber optic temperature monitoring probe, and a heated pad for maintaining core body temperature at 37° C.
Pyruvate polarization and injection procedures
Experiments were performed using 30 µL [1-13C]-labeled pyruvic acid (Cambridge Isotope Labs; http://www.isotope.com) containing 15 mM trityl radical OX63 (GE Healthcare), Gd2+-dotarem (Guerbet; http://www.guerbet-us.com) at 1.4° K and a 3.35 T field strength and was hyperpolarized for an hour at 94.082 GHz microwaves using an Oxford Instruments DNP polarizer (HyperSense®). Before the injection into the mouse via jugular vein catheter, the polarized substrate was quickly dissolved in Tris/ETDA and NaOH at 37° C, yielding 80 mM pyruvate at physiologic pH. At the start of each dynamic 13C MRS scan, 350 µL of the hyperpolarized pyruvate was injected over a period of 12–15 seconds. The injection was immediately followed by a 100 µL saline flush to clear the pyruvate solution from the tubing.
In-vivo 13C MRS
All 13C spectra were acquired using a 7 T, 31-cm horizontal bore magnet (Agilent, Palo Alto, CA) utilizing a 35 mm dual tuned 1H - 13C volume coil (M2M; http://www.m2mimaging.com). Anatomical reference images to determine location and size of the xenograft tumors were acquired with T2-weighted FSE (fast spin echo) multislice (TR = 4 s, TE = 60 ms, echo train length = 8, matrix 128 × 128, slice thickness = 1 mm, 15 slices). In-vivo data acquisition started immediately prior to the pyruvate injection with a repetition time (TR) of 1 second and flip angle 9° and single transient spectra were acquired over a period of 150 s from a 6-mm-thick tumor slice oriented at an oblique angle in order to acquire signal from tumor.
Statistical Analysis
Values reported are means ± SD. Statistical significance between the control and treatment groups were assessed by using a two-sample t test assuming unequal variances. Significant differences were assessed by using a paired two-sample t test for means. Statistical significance was considered at the P <0.05 level.
Results
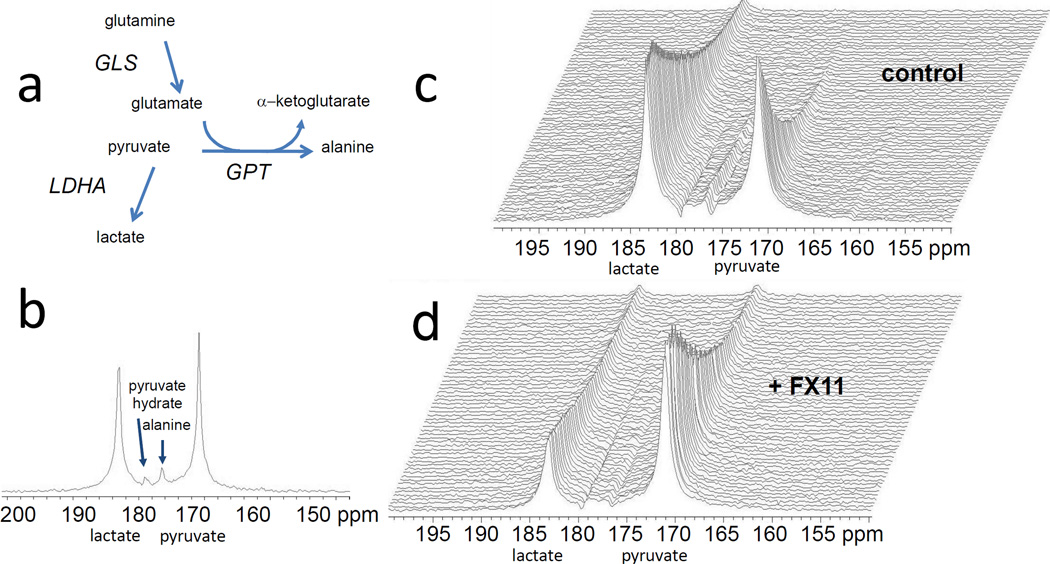
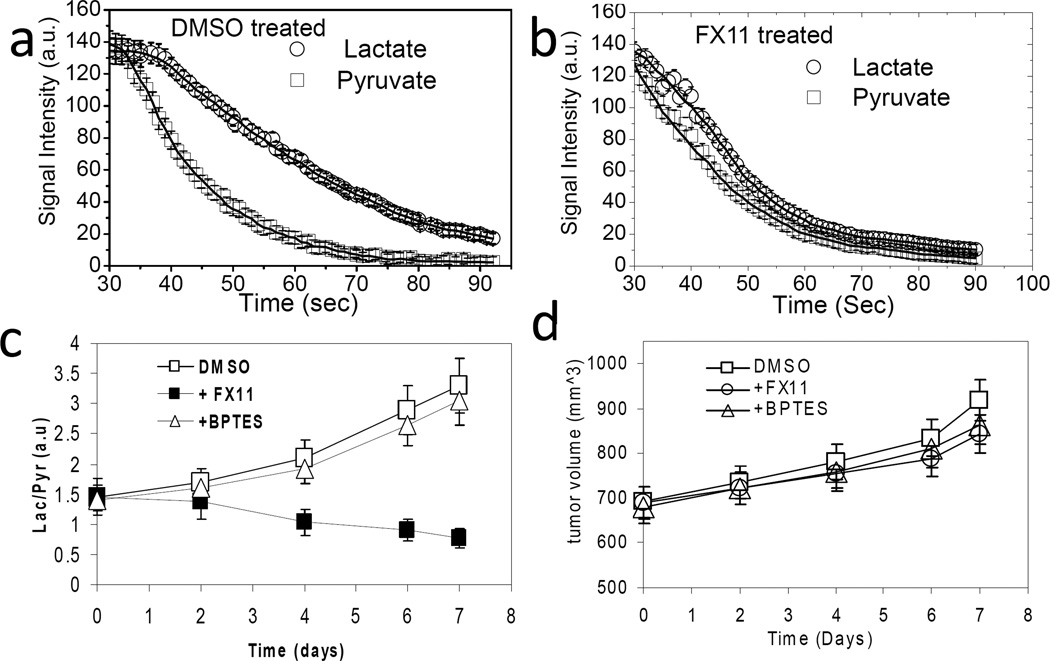
The conversion of hyperpolarized [1-13C]-pyruvate to lactate was monitored with MRS to assess the response of human P493 B cell lymphoma xenografts to FX11, an inhibitor of LDH-A, or to BPTES, an inhibitor of glutaminase. Tumor xenografts were established and animals were treated with DMSO vehicle or drug via intraperitoneal injection. Figure 1a & b depict a relevant metabolic pathways and the 13C MR spectrum obtained from a 6 mm thick slice across the tumor after hyperpolarized pyruvate injection respectively. It displays the prominent peak of pyruvate (171 ppm) and its conversion by LDH to lactate (183 ppm) along with its conversion by glutamate-pyruvate transaminase (GPT) to alanine (176 ppm). Pyruvate hydrate (179 ppm) is formed non-enzymatically in solution and is in equilibrium with dehydrated pyruvate. Figure 1c displays sequential dynamic spectra acquired from a 6 mm tumor slice over a total acquisition time of 100 seconds in DMSO treated mice (control), illustrating a robust conversion of pyruvate-to-lactate in tumor. After six days of FX11 treatment, the pyruvate-to-lactate conversion flux in tumors diminished considerably (Fig. 1d). There is an overall signal decay due to T1 relaxation of the hyperpolarized substrate. Figure 2a & b document the lactate and pyruvate peak intensities as a function of time in DMSO treated and FX11 treated mice respectively for four days. A reduction in lactate flux was evident in the FX11 treated tumor. The flux ratio of tumor lactate and pyruvate (Lac/Pyr) was considered to be a drug therapy response marker in this study. The Lac/Pyr flux ratio was calculated from area under the curve (as regarded a “Model-Free” approach) of the metabolic profile from the dynamic scan. The Lac/Pyr flux ratios of FX11 treated tumors were compared with DMSO treated tumors at different treatment days to assess the response to therapy. The Lac/Pyr ratio increased with time in DMSO treated animals, and progressively lowered in the FX11 treated group, (p < 0.01), confirming the FX11 drug response (Fig. 2c). We have also evaluate the conversion rate constants (kp = pyruvate-to-lactate and kL= lactate-to-pyruvate) using two-site exchange model (Ref. 14). The ratio of rate constants (kp/kL) decreases with FX11 treatment and increases in DMSO treated tumors (Table I). The tumor volume was monitored during the treatment time window using T2-weighted MR imaging. Although there is a slight growth of tumor in all groups (Fig. 2d), no significant differences in tumor volumes between groups were observed.
Figure 1.
(a) Schema depicting metabolic pathways relevant to 13C-pyruvate MRS spectra (GLS, glutaminase; GPT, glutamate-pyruvate transaminase; LDH-A, lactate dehydrogenase A). (b) Hyperpolarized 13C MRS acquired from a 6 mm thick slice across the tumor after 20 sec of pyruvate injection (i.v) into a mouse. Representative dynamic 13C MR spectra after delivering hyperpolarized pyruvate in (c) DMSO treated (control) and (d) FX11 treated mice for 6 days. Spectra are acquired every second.
Figure 2.
Tumor [1-13C] lactate and [1-13C] pyruvate peak intensities with time after i.v. injection of hyperpolarized [1-13C] pyruvate in (a) DMSO treated (control) and (b) FX11 treated tumors for 4 days. The initial 30 s of data were not shown because of the time taken to pyruvate deliver and uptake by the tumor. The data were also fitted to two-site exchange model to estimate the rate constants kP and kL. (c) The lactate-to-pyruvate flux ratio (Lac/Pyr) increased with treatment days in DMSO and BPTES treated mice and decreased in FX11 treated mice. (d) A slight increment of tumor volume (measured from T2-weighted MRI) was observed with no significant differences between groups. Error bars are the standard deviation (s.d) from the mean values, n = 8 for each group of mice.
Table I.
FX11 and DMSO treatment response
| Days of treatment |
FX11 treatment | DMSO treatment | ||
|---|---|---|---|---|
| Lac/Pyr (area under the curve) |
kP/kL (two-site exchange) |
Lac/Pyr (area under the curve) |
kP/kL (two-site exchange) |
|
| 0 | 1.45±0.04 | 3.7±0.4 | 1.46±0.04 | 3.8±0.4 |
| 4 | 1.32±0.05 | 2.9±0.5 | 2.11±0.05 | 4.3±0.6 |
| 6 | 1.07±0.03 | 2.1±0.6 | 2.89±0.03 | 4.7±0.5 |
| 7 | 0.84±0.04 | 1.8±0.5 | 3.31±0.04 | 5.5±0.6 |
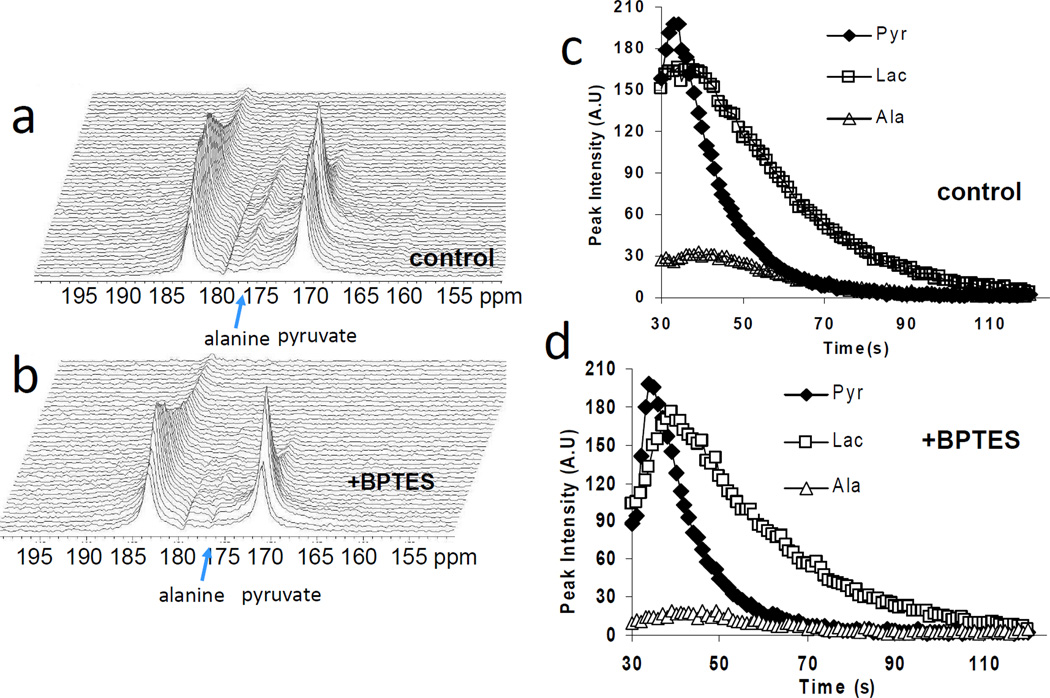
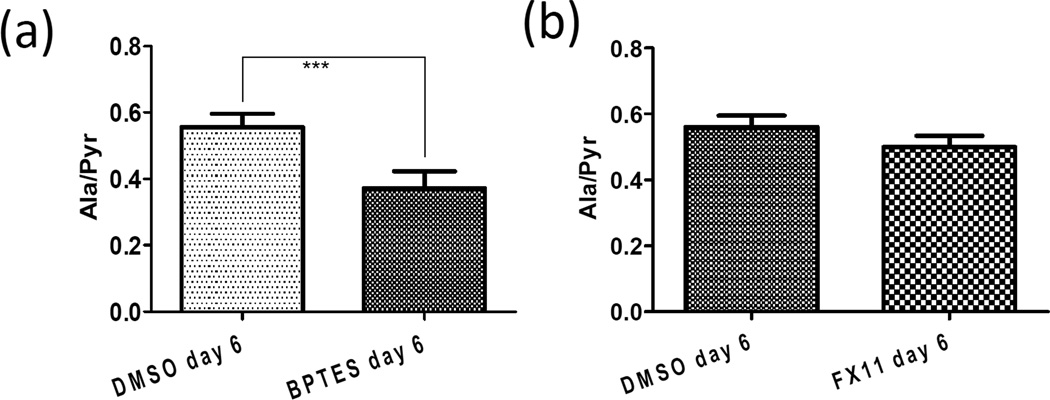
To test the specificity of the hyperpolarized [1-13C]-pyruvate in the assessment of LDH-A inhibition in vivo, we used BPTES, a glutaminase inhibitor which has previously been observed to reduce growth of P493 tumor xenografts6. BPTES did not affect in vivo pyruvate-to-lactate conversion and the Lac/Pyr ratio was comparable to DMSO treated control as shown in Figure 2c. BPTES inhibits the conversion of glutamine to glutamate in tumor cells15. Because the resulting glutamate is a substrate for the transamination of pyruvate to alanine by glutamate-pyruvate transaminase (GPT; Fig. 1a), we sought to determine whether hyperpolarized [1-13C]-pyruvate conversion to alanine might be diminished by BPTES. In this regard, the BPTES-treated animals had a reduced pyruvate to alanine conversion compared to controls (Fig. 3 a–d). Figure 4a illustrates the significant (p < 0.001) reduction of alanine-to-pyruvate flux ratio (Ala/Pyr) by BPTES in replicated experiments. The Ala/Pyr flux ratio, however, was not significantly (p = 0.112) diminished by FX11 (Fig. 4b). These data represent the first use of the pyruvate-to-alanine conversion flux ratio and document an effect of BPTES in vivo.
Figure 3.
Representative dynamic 13C MR spectra after delivering hyperpolarized pyruvate in (a) DMSO treated (control) and (b) BPTES treated mice for 6 days. Peak intensity profile for pyruvate, lactate and alanine with time in (c) DMSO treated and (d) BPTES treated mice.
Figure 4.
Differences in Alanine-to-Pyruvate flux ratio (Ala/Pyr) between (a) DMSO and BPTES groups (n = 8 for each group, error bars = s.d. from the mean, p<0.001) and (b) DMSO and FX11 groups (n = 8 for each group, error bars = s.d. from the mean, p = 0.112). Table I summarizes the FX11 and DMSO treatment response in terms of Lactate-to-Pyruvate flux ratio ((Lac/Pyr) and conversion rate constant ratio (kp/kL).
Discussion
The resurgence of interest in cancer metabolism has increased expectations for targeting specific metabolic pathways in cancers. Advances in molecular metabolic imaging have emerged with new tools to measure tumor metabolism in situ. Hence, we sought to provide a proof-of-concept that hyperpolarized [1-13C]-pyruvate MRS could be deployed as an imaging biomarker of therapeutic response to inhibition of lactate dehydrogenase and/or glutaminase in lymphoma tumor xenografts. Notably, 13C MRS imaging involves no ionizing radiation and, because it is a multispectral modality, it has the ability to detect simultaneously the metabolic fluxes of a variety of substrates16. The conversion of hyperpolarized 13C-labeled pyruvate to lactate or alanine provides a non-invasive method for assessing directly LDH and indirectly glutaminase activities in vivo within the same acquisition.
In this study, we document that P493 lymphoma xenografts displayed high levels of native 13C-pyruvate-to-lactate conversion, consistent with the findings in previous studies of mouse lymphoma xenografts and other tumor models14,17–19. The LDH-A inhibitor FX11, but not the glutaminase inhibitor BPTES, diminished the conversion of 13C-pyruvate to lactate, suggesting that 13C-pyruvate-to-lactate conversion could serve as a biomarker of LDH-A inhibition. This may be a generalizable response biomarker, however, as decreased pyruvate-to-lactate conversion has also been observed in response to etoposide in murine lymphoma, apparently through a different mechanism14. Etoposide was reported to induce apoptosis and necrosis, leading to PARP-mediated depletion of the coenzyme NADH pool and consequently to a decrease in the apparent pyruvate-to-lactate flux through LDH14. Steady-state lactate levels in MR spectra have also been observed to decrease within 1–3 days of chemotherapy or radiation therapy of murine models of sarcoma (RIF-1) and breast cancer (EMT6)20. In the current study, the specificity of the FX11 response was substantiated by a lack of effect of BPTES on pyruvate-to-lactate conversion. However, while our studies demonstrated a selective alteration of Lac/Pyr flux ratio by FX11 versus BPTES, these other studies offer a cautionary note regarding other mechanisms leading to altered lactate production after treatment. Although BPTES was observed to not affect conversion of pyruvate to lactate, it was observed to reduce the conversion of pyruvate to alanine as shown in Figure 3a–d, presumably through deprivation of the glutamate pool. This documents for the first time the potential use of Ala/Pyr flux ratio to monitor glutaminase inhibition in vivo.
The current use of hyperpolarized 13C-pyruvate MR to study tumor xenografts in vivo has demonstrated the ability of this technique to examine living animals serially throughout the course of a disease and its response to different therapies. This work has demonstrated the potential for hyperpolarized 13C MRS to follow metabolic pathway fluxes in vivo, noninvasively, particularly to monitor and understand metabolically targeted cancer therapies, which are likely to emerge clinically in the next several years.
Conclusion
This study documents that the metabolic consequences of treatment with an LDH-A inhibitor in lymphoma can be detected by monitoring the diminished pyruvate-to-lactate conversion in vivo using hyperpolarized 13C MRS. It also documents for the first time the use of pyruvate-to-alanine conversion as a pharmacodynamic marker of glutaminase inhibition. Our results indicate that monitoring aerobic glycolysis using 13C MRS with hyperpolarized pyruvate is a promising technique that could potentially detect the molecular effect of various emerging therapies that target cell signaling and metabolism, and thus provide a radiation-free method to assess tumor response longitudinally.
Acknowledgements
This work was supported by the Wayne Huizinga Trust, R01 CA077575 (to RJG); R01 CA057341, Leukemia & Lymphoma Society Translational Research Grant 636311 and Stand-Up-to-Cancer translational grant (to CVD); R21 NS074151(to TT); The Sol Goldman Pancreatic Cancer Research fund 80028595, Lustgarten fund 90049125 and R21CA169757 (to Anne Le).
Footnotes
Disclosure of Potential Conflicts of Interest: Authors do not have any conflicts of interest to disclose
Author Contributions
RJG, CVD, PD, AL, GVM, DLV and TT designed the study. PD performed the experiments and CVD, RJG, PD, AL, GVM analyzed and interpreted the data and wrote the manuscript. All authors contributed to the final version of the paper.
References
- 1.Gillies RJ, Robey I, Gatenby RA. Causes and consequences of increased glucose metabolism of cancers. J Nucl Med. 2008;49(Suppl 2):24S–42S. doi: 10.2967/jnumed.107.047258. [DOI] [PubMed] [Google Scholar]
- 2.Hsu PP, Sabatini DM. Cancer cell metabolism: Warburg and beyond. Cell. 2008;134(5):703–707. doi: 10.1016/j.cell.2008.08.021. [DOI] [PubMed] [Google Scholar]
- 3.Tennant DA, Duran RV, Gottlieb E. Targeting metabolic transformation for cancer therapy. Nat Rev Cancer. 2010;10(4):267–277. doi: 10.1038/nrc2817. [DOI] [PubMed] [Google Scholar]
- 4.Goldman RD, Kaplan NO, Hall TC. Lactic Dehydrogenase in Human Neoplastic Tissues. Cancer Res. 1964;24:389–399. [PubMed] [Google Scholar]
- 5.Le A, et al. Inhibition of lactate dehydrogenase A induces oxidative stress and inhibits tumor progression. Proc Natl Acad Sci U S A. 2010;107(5):2037–2042. doi: 10.1073/pnas.0914433107. [DOI] [PMC free article] [PubMed] [Google Scholar]
- 6.Le A, et al. Glucose-independent glutamine metabolism via TCA cycling for proliferation and survival in B cells. Cell Metab. 2012;15(1):110–121. doi: 10.1016/j.cmet.2011.12.009. [DOI] [PMC free article] [PubMed] [Google Scholar]
- 7.Vander Heiden MG. Targeting cancer metabolism: a therapeutic window opens. Nat Rev Drug Discov. 2011;10(9):671–684. doi: 10.1038/nrd3504. [DOI] [PubMed] [Google Scholar]
- 8.Lieberman BP, et al. PET imaging of glutaminolysis in tumors by 18F-(2S,4R)4-fluoroglutamine. J Nucl Med. 2012;52(12):1947–1955. doi: 10.2967/jnumed.111.093815. [DOI] [PubMed] [Google Scholar]
- 9.Shulman RG, et al. Cellular applications of 31P and 13C nuclear magnetic resonance. Science. 1979;205(4402):160–166. doi: 10.1126/science.36664. [DOI] [PubMed] [Google Scholar]
- 10.Golman K, Zandt RI, Lerche M, Pehrson R, Ardenkjaer-Larsen JH. Metabolic imaging by hyperpolarized 13C magnetic resonance imaging for in vivo tumor diagnosis. Cancer Res. 2006;66(22):10855–10860. doi: 10.1158/0008-5472.CAN-06-2564. [DOI] [PubMed] [Google Scholar]
- 11.Ardenkjaer-Larsen JH, et al. Increase in signal-to-noise ratio of > 10,000 times in liquid-state NMR. Proc Natl Acad Sci U S A. 2003;100(18):10158–10163. doi: 10.1073/pnas.1733835100. [DOI] [PMC free article] [PubMed] [Google Scholar]
- 12.Kurhanewicz J, et al. Analysis of cancer metabolism by imaging hyperpolarized nuclei: prospects for translation to clinical research. Neoplasia. 2011;13(2):81–97. doi: 10.1593/neo.101102. [DOI] [PMC free article] [PubMed] [Google Scholar]
- 13.Witney TH, Kettunen MI, Brindle KM. Kinetic modeling of hyperpolarized 13C label exchange between pyruvate and lactate in tumor cells. J Biol Chem. 2011;286(28):24572–24580. doi: 10.1074/jbc.M111.237727. [DOI] [PMC free article] [PubMed] [Google Scholar]
- 14.Day SE, et al. Detecting tumor response to treatment using hyperpolarized C-13 magnetic resonance imaging and spectroscopy. Nature Medicine. 2007;13(11):1382–1387. doi: 10.1038/nm1650. [DOI] [PubMed] [Google Scholar]
- 15.Seltzer MJ, et al. Inhibition of glutaminase preferentially slows growth of glioma cells with mutant IDH1. Cancer Res. 2010;70(22):8981–8987. doi: 10.1158/0008-5472.CAN-10-1666. [DOI] [PMC free article] [PubMed] [Google Scholar]
- 16.Bohndiek SE, Kettunen MI, Hu D, Brindle KM. Hyperpolarized 13C spectroscopy detects early changes in tumor vasculature and metabolism after VEGF neutralization. Cancer Res. 2012;72(4):854–864. doi: 10.1158/0008-5472.CAN-11-2795. [DOI] [PMC free article] [PubMed] [Google Scholar]
- 17.Seth P, et al. On-target inhibition of tumor fermantative glycolysis as visualized by hyperpolarized pyruvate. Neoplasia. 2011;13(1):60–71. doi: 10.1593/neo.101020. [DOI] [PMC free article] [PubMed] [Google Scholar]
- 18.Hu S, et al. 13C-pyruvate imaging reveals alterations in glycolysis that precede c-Myc-induced tumor formation and regression. Cell Metab. 2011;14:131–142. doi: 10.1016/j.cmet.2011.04.012. [DOI] [PMC free article] [PubMed] [Google Scholar]
- 19.Albers MJ, et al. Hyperpolarized 13C lactate, pyruvate, and alanine: noninvasive biomarkers for prostate cancer detection and grading. Cancer Res. 2008;68(20):8607–8615. doi: 10.1158/0008-5472.CAN-08-0749. [DOI] [PMC free article] [PubMed] [Google Scholar]
- 20.Aboagye EO, Bhujwalla ZM, Shungu DC, Glickson JD. Detection of tumor response to chemotherapy by 1H nuclear magnetic resonance spectroscopy: effect of 5-fluorouracil on lactate levels in radiation-induced fibrosarcoma 1 tumors. Cancer Res. 1998;58:1063–1067. [PubMed] [Google Scholar]


