

Abstract
The human brain possesses a remarkable capacity to interpret and recall novel sounds as spoken language. These linguistic abilities arise from complex processing spanning a widely distributed cortical network and are characterized by marked individual variation. Recently, graph theoretical analysis has facilitated the exploration of how such aspects of large-scale brain functional organization may underlie cognitive performance. Brain functional networks are known to possess small-world topologies characterized by efficient global and local information transfer, but whether these properties relate to language learning abilities remains unknown. Here we applied graph theory to construct large-scale cortical functional networks from cerebral hemodynamic (fMRI) responses acquired during an auditory pitch discrimination task and found that such network properties were associated with participants’ future success in learning words of an artificial spoken language. Successful learners possessed networks with reduced local efficiency but increased global efficiency relative to less successful learners and had a more cost-efficient network organization. Regionally, successful and less successful learners exhibited differences in these network properties spanning bilateral prefrontal, parietal, and right temporal cortex, overlapping a core network of auditory language areas. These results suggest that efficient cortical network organization is associated with sound-to-word learning abilities among healthy, younger adults.
Introduction
The phylogeny of the human neocortex has led to the remarkable human capacity to recognize and store novel acoustical information as spoken language. Although the brain shows the highest plasticity to second language acquisition from childhood through early adolescence (Johnson & Newport, 1989), language learning abilities are maintained through adulthood. Notably, however, these linguistic abilities are characterized by substantial individual variation (Wong & Perrachione, 2007; Snow & Hoefnagel-Hohle, 1979). Although successful language learning has been attributed to several behavioral factors, including motivation, verbal working memory (Miyake & Friedman, 1998), and the extent and quality of language training (Birdsong, 1999; Bongaerts, 1999), language comprehension is ultimately a neurophysiological process that requires coordinated dynamics among the peripheral auditory and central nervous systems. Thus, differences in language learning and processing must ultimately derive from anatomical and neurophysiological sources, and recent imaging studies have identified such individual differences to be associated with neuroanatomical factors such as volume of Heschl’s gyrus as well as local (fMRI) activation patterns involving auditory cortex and several other language-related areas (Eisner, McGettigan, Faulkner, Rosen, & Scott, 2010; Wong, Ettlinger, Sheppard, Gunasekaran, & Dhar, 2010; Warrier et al., 2009; Wong et al., 2008; Golestani, Molko, Dehaene, LeBihan, & Pallier, 2007; Wong, Perrachione, & Parrish, 2007; Peach & Wong, 2004).
Although such neurophysiological findings contribute to our understanding of the human auditory system, recent emphasis centers on expanding beyond analyses of isolated brain regions toward a framework that views cognition as an emergent phenomenon resulting from dynamic functional organization among large-scale distributed brain networks (Bressler & Menon, 2010). As a vastly complex system, the brain achieves innumerable higher-level functions (including language) through associations between many overlapping subsystems (Sporns, Chialvo, Kaiser, & Hilgetag, 2004; Sporns, Tononi, & Edelman, 2000). At the cortical level alone, for instance, language perception requires low-level analysis of incoming acoustical information in primary auditory cortex followed by higher-level speech processing in a network spanning the temporal, premotor, lateral, and prefrontal cortices, as well as parts of the inferior parietal cortex at the TPJ (Hickok & Poeppel, 2007). Presumably, efficient integration of information across this distributed network should be paramount for spoken language perception and learning (Tononi, Edelman, & Sporns, 1998).
Recently, graph theoretical analysis offers a powerful data-driven approach to investigate these large-scale aspects of coordinated brain function (Bullmore & Sporns, 2009; Stam & Reijneveld, 2007; Watts & Strogatz, 1998). Past graph theoretical studies of brain functional and anatomical networks have established a “small-world” topology characterized by both high local and global efficiency of functional organization relative to random networks (Gong et al., 2009; Iturria-Medina, Sotero, Canales-Rodriguez, Aleman-Gomez, & Melie-Garcia, 2008; Achard, Salvador, Whitcher, Suckling, & Bullmore, 2006; Eguiluz, Chialvo, Cecchi, Baliki, & Apkarian, 2005; Salvador et al., 2005; Stam, 2004), while meeting these demands under spatial constraints and physiological wiring costs (Achard & Bullmore, 2007). These observations have led to the hypothesis that neural systems evolved to achieve maximum efficiency of information transfer at low connection costs (Bassett et al., 2009). Moreover, these economical small-world properties are believed to be essential for cognition, because cognitive functions require the brain to meet opposing demands of segregative (i.e., local) and integrative (i.e., global) neural processing (Bressler & Kelso, 2001). Given the link between complex brain organization and cognition, one may hypothesize that higher-level cognitive abilities are associated with measurable differences in emergent, small-world properties of brain networks. Indeed, recent studies have reported associations between global efficiency of brain functional networks and behavioral measures including working memory ability (Bassett et al., 2009) and even intelligence (van den Heuvel, Stam, Kahn, & Hulshoff Pol, 2009; Micheloyannis et al., 2006).
However, whether characteristics of large-scale brain functional organization are also associated with aspects of language learning remains to be seen. Furthermore, a majority of past graph theoretical studies have considered network properties of resting-state brain function, for which the relationship to active task performance remains unclear (for a review of several recent studies, see Bassett & Bullmore, 2009). Although there are strong arguments for the utility of intrinsic (resting-state) functional connectivity analysis (Bressler & Menon, 2010), paradigms involving performance of relevant behavioral tasks can arguably allow one to relate these network properties more directly to specific cognitive processes. As far as we are aware, however, previous task-related studies using graph theory to investigate such network performance relationships are restricted to EEG and magneto-encephalography (MEG) experiments (Bassett et al., 2009; Micheloyannis et al., 2006), which are limited by reduced spatial resolution.
In the present set of experiments, we used fMRI and graph theoretical analysis to construct cortical functional networks related to an auditory discrimination task and investigated whether small-world properties of the cortical networks were associated with individual differences in sound-to-word learning abilities. During scanning, native English-speaking participants performed same–different judgments on the pitch patterns of foreign speech sounds that they were subsequently trained to identify as words in an artificial language (Wong et al., 2007). Following scanning, participants were taught to associate the words of this artificial spoken language with target objects during multiple training sessions (Wong & Perrachione, 2007). Learning these words required discrimination of linguistic pitch patterns (i.e., rising, level, and falling tones), which are utilized in tone languages such as Mandarin Chinese but were absent from the participants’ native language (English). Following training, participants were classified as either successful or less successful sound-to-word learners based on their ability to reach near-perfect accuracy on a word–object identification test. We hypothesized that successful and less successful learners would show significant differences in small-world properties of cortical functional networks and tested this hypothesis by comparing network measures of global and local efficiency between the learner groups at both the whole-cortex level (henceforth, whole-cortex measures) and in individual cortical regions (henceforth, regional measures). To our knowledge, this is a first study to investigate how small-world properties of cortical functional networks may associate with individual differences in linguistic abilities.
Methods
Overview
The current article applies graph theoretical analysis to characterize functional networks associated with a pitch discrimination task that were obtained from a previous fMRI study by our laboratory (Wong et al., 2007) and seeks to associate these large-scale network characteristics with participants’ sound-to-word learning success as gauged in a separate behavioral study by our laboratory involving the same set of speech stimuli and same cohort of participants (Wong & Perrachione, 2007). In particular, we considered acquisition of words from an artificial language that differs in basic auditory cues from the individual’s native language. To achieve this, we created an artificial set of words that combined pseudosyllables of American English (our participants’ native language) with auditory pitch information (i.e., rising, level, and falling tones). Although pitch patterns determine word meaning in tonal languages such as Mandarin Chinese or Thai (none of which our participants had prior exposure to), they are absent in English. Learning the pseudowords therefore required participants to recognize both the syllable and pitch pattern associated with a given word and to associate each word with a target object. Because this required participants’ ability to use, store, and recall pitch information in lexical contexts, it also engaged lexical and long-term memory processes.
Over the course of multiple sessions spanning 3–4 weeks, we trained participants to match the words of our artificial language with target objects, with the goal of achieving full sound-to-word learning attainment. However, because we scanned participants before beginning sound-to-word training, it was not possible to directly test their knowledge of the words during the fMRI experiment. Instead, we asked participants to perform a same–different judgment in the scanner in which they determined whether pairs of spoken words from the artificial language (presented via headphones) contained the same or different pitch patterns (see Wong et al., 2007). This pitch discrimination task required participants to recognize and differentiate between the nonnative pitch patterns in our artificial language. Following the imaging experiment and subsequent sound-to-word training, we classified participants as successful or less successful learners based on their ability to reach and maintain near-perfect (above 95%) accuracy on word identification tests administered at the end of each training session, which assessed participants’ word comprehension (Wong & Perrachione, 2007). Overall, this experimental setup allowed us to explore how large-scale properties of brain functional networks related to performance on a sublexical pitch discrimination task were associated with longer-term sound-to-word learning abilities.
Participant Recruitment
Seventeen healthy younger adult participants (19–26 years; mean age = 20.65 years, SD = 2.26 years; 10 women) were recruited for the experiment. All participants were native speakers of American English, and none had previous exposure to any tone language. We also collected survey information from all participants on their past second language experiences. Thirteen participants reported some second (but not tonal) language experience ranging from “basic” to “conversational,” with only one of these participants reporting fluency. The remaining four participants reported no second language exposure. All participants gave informed consent for the experiment under the approval of the local institutional review board and were compensated monetarily for their participation.
Generation of Pseudoword Stimuli
Pseudoword stimuli were generated from a total of six sets of words, each altered to follow three different pitch patterns (level, rising, and falling), for a total of 18 pseudowords. Thus, the sets of three words generated from the same base syllable differed only in their pitch contours. All pseudoword stimuli were produced in a sound-attenuated chamber by a native male speaker of American English using a SHURE SM58 microphone and were sampled at 44.1 kHz. Each recorded stimulus was then resynthesized to create corresponding stimuli with the three pitch patterns. We resynthesized stimuli using linear interpolation across the voice portion of the stimulus by using the “pitch-synchronous overlap and add” (PSOLA) method in the software package Praat (Boersman & Weeknik, 2005). The resulting pseudoword stimuli were judged to be perceptually natural by eight native Mandarin speakers.1
For pseudowords containing the “level” tone, the starting and ending pitches were kept identical and were equal to the mean fundamental frequency (F0) of the entire list of words produced by our speaker. For the “rising” tone, the ending pitch was kept equal to the pitch of the level tone, but the starting pitch was 26% lower. For the “falling” tone, the starting pitch was 10% higher than the pitch of the level tone, and the ending pitch was lowered by 82% (from the starting pitch of the tone).
Besides F0, all other acoustic parameters (e.g., duration, voice quality, etc.) were left unaltered from the talker’s original productions, so that F0 was the only parameter that differed between the three modified versions of each base stimulus. Thus, stimuli varied somewhat in duration but were typically around 350–400 msec in length. To verify that our artificial pseudowords were perceptually similar to natural stimuli from a tonal language, we tested pitch classification (rising, level, or falling) of our stimuli on a cohort of eight Mandarin speakers who correctly classified the pitch contours as rising, level, or falling with over 97% accuracy. For further details, we refer the reader to the original article describing our sound-to-word learning study (Wong & Perrachione, 2007).
Pitch Pattern Discrimination (inside Scanner)
The pitch pattern discrimination task consisted of a base stimulus set of six English pseudosyllables (“pesh,” “dree,” “ner,” “vece,” “nuck,” or “fute”) produced by a Native speaker of American English (Wong et al., 2007). Initial syllables were resynthesized with Praat software (Boersman & Weeknik, 2005) to follow three Mandarin pitch patterns (level, rising, and falling), generating 18 pseudowords in total. In the scanner, participants were presented with pairs of these stimuli via headphones and asked to perform a same–different judgment using a response box to indicate whether each stimulus pair contained the same or different pitch patterns regardless of the base syllable. Half of the presented stimulus pairs actually contained the same pitch pattern. Stimulus pairs were presented to participants in 12-sec blocks via headphones. Each block included six pairs of stimuli, with the second stimulus in the pair played immediately following the presentation of the first stimulus in the pair. On the basis of the potential variability in typical stimulus durations (350–400 msec), this means that the duration of the silent period during which participants could respond before the presentation of the next stimulus pair was around 1200–1300 msec. On average, participants responded substantially faster than this (mean RT averaged across all participants’ trials = 401 msec). In total, 60 blocks of stimuli and 20 blocks of silent rest trials were presented in pseudorandomized order.
Sound-to-Word Training and Learning Assessment
Following MRI scanning, participants underwent a behavioral training paradigm (Wong & Perrachione, 2007), consisting of three to four training sessions per week (with no more than one session per day), which trained them to associate each individual pseudoword with target objects. For instance, participants heard the syllable “pesh” with a level tone while being presented with a drawing of a glass. Learning the word meanings therefore required participants to recognize both the pitch pattern and base syllable of each word. We chose the word meanings (i.e., the objects depicted in the drawings) based on a set of 18 high-frequency English nouns obtained from the Florida Semantics Battery (Raymer et al., 1990). We divided the set of 18 words into six groups of three stimuli each to facilitate participants’ sound-to-word learning (Curtin, Goad, & Pater, 1998). Each group contained one word with each type of lexical tone, but none of the words in any group contained the same base syllable.
During each training session, participants were given four presentations each of every pseudoword paired with the drawing of its target object. The presentations were blocked by the six separate groups such that each presentation set consisted of a set of three pseudowords. We considered these training presentations comparable with second-language sound-to-word learning, because participants had to form a mapping from a nonnative lexical sound pattern to a mental representation of each object. After presenting each set of three stimuli, participants were quizzed on the words just learned. Participants were presented one of the previous words and had to choose the correct drawing from the three objects just paired to the three words of the stimulus set. The purpose of these quizzes was to provide the participants with feedback (correct or incorrect) so that they could identify and correct any mistakes.
Following these six blocks of training followed by quizzes (for each set of pseudowords), a retention test was administered at the end of each training session. Here, we presented participants with all 18 trained pseudowords in randomized order, with these presentations repeated three times for a total of 54 trials. We asked participants to select the drawing of the corresponding object for each pseudoword, given all 18 possible choices and providing no feedback. Participants were allotted as much time as necessary for identifying the words. We used participants’ scores on this last word identification test at the end of every training session both to assess sound-to-word learning success and to determine whether criteria were met to terminate training (see next paragraph). In total, each of these behavioral sessions lasted around 30 min.
We trained participants in multiple sessions with the aim of achieving complete sound-to-word learning attainment. Participants were classified as successful learners (9 of 17) if they achieved at least 95% accuracy on the word identification test in two consecutive sessions. We selected a relatively stringent criterion for “successful learning” (>95% accuracy), because we only required participants to learn 18 total words, and in earlier pilot experiments, some pilot participants achieved near 100% accuracy in only a few sessions. Participants performing below this level (<95% accuracy) were classified as less successful learners (8 of 17) if they failed to improve by at least 5% over four consecutive sessions (i.e., if their accuracy plateaued below 95%). For all participants, we considered training complete when and only when one of these two termination criteria was met. This approach helped ensure that participants had sufficient training to reach their maximal performance level (falling near ceiling performance for successful learners or at some lower asymptotic level for less successful learners).2 We felt that using these criteria for classifying successful versus less successful learning was reasonable because, by definition, participants who reach 95% accuracy can no longer improve their score by more than 5%. Although only around half of the participants in our cohort met our criteria for “successful” learning, all 17 performed substantially above chance levels (i.e., 1/18 or 5.6%) on the word identification tests, with the poorest participant plateauing near 35% accuracy (Wong & Perrachione, 2007). For further details on individual participants’ performance over the course of their sound-to-word training and for additional methodological details on our training procedures, please see our original behavioral article (Wong & Perrachione, 2007).
MRI Acquisition
MRI data were acquired on a Siemens 3T Trio machine at the Center for Advanced MRI at Northwestern University. T1-weighted, high-resolution volumes were acquired sagittally (magnetization prepared rapid gradient echo; repetition time [TR]/echo time = 2100 msec/2.4 msec; flip angle = 15°; inversion time = 1100 msec; matrix size = 256 × 256; field of view = 22 cm; slice thickness = 1 mm), in addition to T2*-weighted functional images acquired with a susceptibility-weighted EPI pulse sequence (echo time = 30 msec; flip angle = 90°; in-plane resolution = 3.4375 mm × 3.4375 mm; 38 slices with 3-mm thickness [field of view = 114 mm] and zero gap acquired in an interleaved measurement). Two seconds of functional image acquisition followed each 12-sec stimulus block, leading to a long TR of 14 sec. This sparse sampling method minimized potential contamination of the hemodynamic response due to auditory noise from the scanner (Wong et al., 2007; Belin, Zatorre, Hoge, Evans, & Pike, 1999; Hall et al., 1999).
MRI Data Preprocessing
Preprocessing of MRI data was performed using AFNI (Cox, 1996), SUMA (Saad, Reynolds, Argall, Japee, & Cox, 2004), and the FreeSurfer analysis suite (Dale, Fischl, & Sereno, 1999). Initial preprocessing consisted of removal of the first functional scan to improve T1 equilibration effects, motion and slice-timing correction, and linear detrending. Additionally, nuisance signals, including the average signals across the whole brain, the lateral ventricles, the cerebral white matter, and the first temporal derivatives of these signals, were regressed out of the functional time courses to reduce physiological noise. This initial preprocessing stage was conducted in three-dimensional (volumetric) space. Next, functional data sets were mapped onto two-dimensional, standardized surface meshes of the cerebral cortex, on which all subsequent analysis was performed. To avoid introducing artificial local correlations in the functional data, no spatial filtering was performed (van den Heuvel, Stam, Boersma, & Hulshoff Pol, 2008).
Subsequently, the cortical surface vertices of each hemisphere were classified into 998 regions of approximately equal size, defining the nodes of the cortical network. This classification was based on a high-resolution parcellation of 66 cortical areas defined in the Desikan-Killiany atlas (see Figure 1) and was described in previous publications (Gigandet et al., 2008; Hagmann et al., 2008; Desikan et al., 2006). Functional time courses were then averaged across surface vertices within each node, and concatenated vectors consisting of all stimulus blocks (which did not include the silent rest blocks) were extracted. A correlation matrix (R) of size N x N was generated for each participant by calculating the zero time lag Pearson’s correlation between these vectors (V) for each pair of nodes such that
Figure 1.
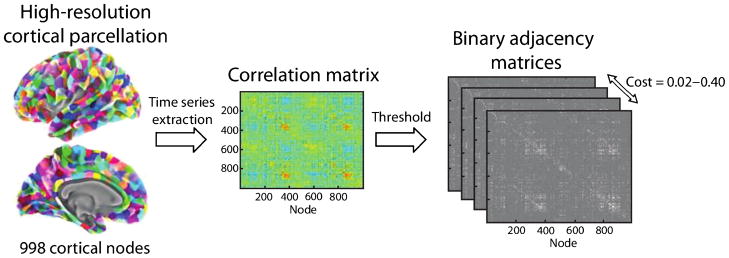
Schematic of construction and thresholding of cortical networks. First, standardized cortical surfaces are prepared for each participant, and averaged functional time courses are extracted from a high-resolution cortical parcellation into 998 nodes. Next, a correlation matrix is obtained for each participant by computing the zero-time lag Pearson’s correlations between functional time courses in each pair of network nodes. Finally, the correlation matrix is thresholded to obtain binary, undirected adjacency matrices with costs in the range of 0.02 – 0.40.
| (1) |
for nodes i and j, where σ2 (V(i))= 〈V(i,t)2〉− 〈V(i,t)〉2 and 〈·〉 represents temporal averages (Eguiluz et al., 2005). Thresholds were then applied to each subject’s correlation matrix to obtain binary, undirected adjacency matrices (A), defining cortical graphs G for each participant across a range of connection thresholds. Connections (edges) were specified when the correlation of the fMRI signal between any pair of nodes exceeded a specified cost threshold (rc) in absolute value (Aij = 1 if |rij| ≥ rc; Aij = 0 if |rij| < rc, where Aij represents element <i,j> of the adjacency matrix and zeros are specified along the main diagonal). To facilitate comparisons of network properties between participants, separate thresholds were applied to each correlation matrix to generate networks of fixed costs (equal to the fraction of existing to possible connections in the network):
| (2) |
wherein N and K equal the total number of network nodes and edges, respectively. This allowed comparisons to be controlled for the number of nodes and edges in each network. We thresholded networks over a cost range of 0.02–0.40 at increments of 0.02. Figure 1 provides a schematic outlining the cortical parcellation and construction of functional networks.
Network Measures
The degree (ki) of a given node equals the total number of edges shared with other nodes:
| (3) |
This measure provides a basic indication of a node’s connectivity within the network.
Originally, the characteristic path length (Lnet) and cluster coefficient (Cnet) were proposed for quantifying small-world network properties (Watts & Strogatz, 1998). Alternatively, the efficiency metric proposed by Latora and Marchiori may be implemented to describe both global and local aspects of parallel information transfer and has conceptual and practical advantages over Lnet and Cnet (Wang et al., 2009; Achard & Bullmore, 2007; Latora & Marchiori, 2001). The global efficiency of an individual node (Eglob(i)) defines the efficiency of information transfer between that node and the network at large:
| (4) |
where Lij equals the shortest numbers of edges connecting node i to each other node j. Thus, Eglob(i) is the average of the reciprocal shortest path lengths (1/Lnet) between node i and every other node in the network and falls between 0 and 1. Smaller and larger values of Eglob(i) indicate that node i requires many or few edges (on average) to connect to any other node, respectively. Global efficiency is also advantageous because it takes into account any disconnected pairs of nodes (which have infinite path lengths), whereas these cases must be omitted from the calculation of the characteristic path length.
Analogous to the cluster coefficient, the local efficiency of an individual node i (Eloc(i)) gauges the efficiency of information flow within the local subgraph Gi of nodes directly connected to (but not including) node i:
| (5) |
where the degree ki equals the number of nodes directly connected to node i.3 Operationally, Eloc(i) is equal to the average of the reciprocal shortest path lengths (1/Lnet) between every possible pair of nodes that are both neighbors of (but not including) node i, ranging between 0 and 1. Smaller and larger values of Eloc(i) indicate that any given pair of nodes in the local network surrounding node i are connected by relatively few or many intervening edges, respectively. Thus, local efficiency gauges how well the local circuit architecture surrounding a given node is optimized for efficient processing apart from the rest of the network (Latora & Marchiori, 2001). Local efficiency also reflects the network fault tolerance, because it represents the efficiency of the remaining local subgraphs after each individual node is removed from the network (Achard & Bullmore, 2007). Averaging these measures across all nodes yields the global and local network efficiency of the entire network, Eglob and Eloc. In the context of cortical networks, we refer to these average metrics as whole-cortex network measures. Similarly, averaging network measures across nodes particular to a specific region of the network (e.g., a cortical region) produces averaged regional network measures that describe the network properties in a given region. At the whole-network level, small-world networks possess Eglob greater than a lattice network and comparable to (but slightly less than) that of random networks with equivalent numbers of nodes and edges ( ), and Eloc greater than random but less than lattice networks ( ).
The network cost efficiency (CE) is defined as Eglob minus the network cost:
| (6) |
Positive cost efficiencies are indicative of an economical network organization that maintains high global efficiency at low connection costs (Achard & Bullmore, 2007). The maximum cost efficiency, CEmax, attained over the range of costs may then by computed as a summary measure that is independent of any particular choice of threshold level.
Cortical Network Properties and Sound-to-Word Learning
To investigate possible differences in functional network organization associated with sound-to-word learning success, we compared network properties between the successful and less successful learners. Because of the limited sample size of our cohort and thus the increased potential for outlier effects, we used nonparametric methods (Mann–Whitney U tests) for all statistical comparisons to avoid any potential confounds from outlier effects or normality violations. We compared network measures between learner groups at both the whole-cortex and regional levels. For regional comparisons, we classified each individual node into 1 of 66 anatomical regions (33 per hemisphere) defined in the Desikan-Killiany cortical atlas (Desikan et al., 2006) and then compared average network measures within each anatomical region (see Table 1 for list of regions).
Table 1.
List of Cortical Anatomical Regions and Abbreviations Used in Regional Analysis
| Bank of the superior temporal sulcus – BSTS |
| Caudal anterior cingulate – CAC |
| Caudal middle frontal – CMF |
| Cuneus – CUN |
| Entorhinal – ENT |
| Frontal pole – FP |
| Fusiform gyrus – FUS |
| Inferior parietal – IP |
| Inferior temporal – IT |
| Isthmus of the cingulate – ISTC |
| Lateral occipital – LOCC |
| Lateral orbitofrontal – LOF |
| Lingual gyrus – LING |
| Medial orbitofrontal – MOF |
| Middle temporal –MT |
| Paracentral lobule – PARC |
| Parahippocampal - PHG |
| Pericalcarine – PERI |
| Postcentral gyrus – PSTC |
| Posterior cingulate – PC |
| Pars opercularis – POPE |
| Pars orbitalis – PORB |
| Pars triangularis – PTRI |
| Precentral grysu – PREC |
| Precuneus – PCUN |
| Rostral anterior cingulate – RAC |
| Rostral middle frontal – RMF |
| Superior frontal – SF |
| Superior parietal – SP |
| Superior temporal – ST |
| Supramarginal gyrus – SMAR |
| Temporal pole – TP |
| Transverse temporal – TT |
Cortical anatomical regions were defined based on the Desikan-Killiany atlas (Desikan et al. 2006), with abbreviations provided from Hagmann et al. (2008).
Cortical Network Properties and Sublexical Pitch Discrimination Abilities
Although the main thrust of the current article was to assess whether large-scale network properties could discriminate successful from less successful sound-to-word listening, we also examined whether participants’ whole-cortex network measures were directly associated with their performance on the sublexical pitch discrimination task performed in the MRI scanner. As with the group comparison tests, we used nonparametric Spearman’s correlations to assess significance of these relationships to protect against potential problems arising from our small sample sizes (i.e., normality violations and outlier effects). We examined correlations between the whole-cortex network measures (Eglob, Eloc, CEmax) and participants’ overall fraction of correctly answered trials, as well as their mean RTs on correctly answered trials.4
Results
Learner Group Differences in Whole-cortex Network Properties
Figure 2 displays average Eglob and Eloc values for both learner groups across the range of network costs. For comparison, reference curves are shown for random and lattice networks with identical numbers of nodes and edges. Small-world networks require Eglob greater than a lattice and approximately equal to (but slightly less than) comparable random networks, and Eloc less than a lattice but greater than a random network (Achard & Bullmore, 2007). Therefore, we defined the small-world regime as the range of costs between 0.02 and 0.34, for which Eglob fell under the curve for random networks in both participant groups. We found significant learner group differences in both Eglob and Eloc across nearly the entire small-world regime. Successful participants exhibited increased Eglob (for costs of 0.02–0.32) but decreased Eloc relative to the less successful participants. Corroborating these findings, we also found significantly increased characteristic path lengths (Lnet) and cluster coefficients (Cnet) in the less successful learners (data not shown).
Figure 2.
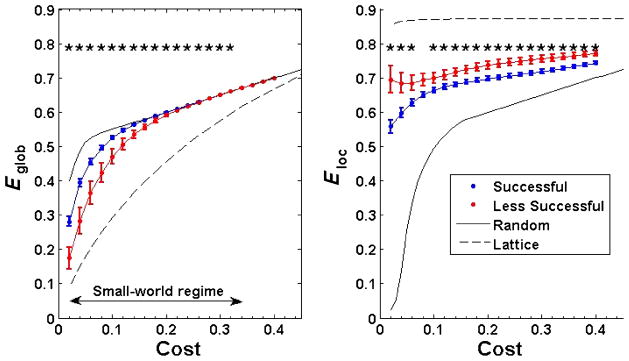
Plots show whole-cortex measures of global (Eglob) and local (Eloc) network efficiency in successful and less successful learners across the range of network costs. Comparisons are shown to values in random and lattice networks. The small-world regime was conservatively defined for networks with costs between 0.02 and 0.34, for which . Successful participants showed significantly increased Eglob but significantly decreased Eloc relative to less successful participants, indicating that sound-to-word learning abilities were associated with differences in small-world network properties. * p < .05 (Mann-Whitney U test).
Furthermore, we computed cost efficiency (CE) curves for each participant by computing the difference between Eglob and network cost. Figure 3 (left) shows curves of Eloc, Eglob, and CE in a single subject. In every subject, CE remained positive across the entire range of costs investigated, indicating an economical organization of the cortical networks. Maximum cost efficiency was reached at an average cost of 0.116 (across all participants) and was significantly increased in the successful learners (Mann-Whitney U = 48, p = .021; Figure 3, right), demonstrating that a more cost-efficient network organization was positively associated with sound-to-word learning ability.5 It is also interesting to note the substantially higher variance in CEmax values observed in the less successful learners (standard deviation = .022) as compared with the successful learners (standard deviation = .010).
Figure 3.

Left: Plot displays curves for whole-cortex measures of Eglob, Eloc, and cost efficiency (CE = Eglob – cost) for an individual participant across the range of network costs. Maximal cost efficiency (CEmax) was found in each individual participant as the maximum value of the CE curve, and occurred at an average cost of 0.116 (across all participants). Right panel: CEmax was significantly increased in the successful learners (two-tailed p = .021, Mann-Whitney U test).
Learner Group Differences in Regional Network Properties
To assess regional differences in network properties between successful and less successful learners, we averaged measures of Eglob and Eloc across individual nodes within each of 66 anatomical regions defined by the Desikan–Killiany atlas (Desikan et al., 2006). We defined significant regions using an individual p value cutoff of .01 based on Mann–Whitney U tests (uncorrected for multiple comparisons). Because we lacked sufficient statistical power for these results to withstand rigorous multiple comparison corrections, these results must be interpreted as exploratory in nature. Table 2 lists regions showing significant group differences in each network property obtained at a cost of 0.12, including mean group differences and significance levels. Figure 4 displays these significant regions on cortical surfaces (red/positive values indicate higher values in the successful participants). We chose to report regional results corresponding to this specific cost threshold as opposed to others because across all participants, network cost efficiency (CEmax) reached its maximal value at an average network cost of 0.116 (see Figure 3). Thus, participants’ networks typically achieved their highest cost efficiency at network costs nearest to 0.12.
Table 2.
Cortical Regions Showing Group Differences in Regional Network Properties
| Eglob | ||
|---|---|---|
| Region | Mean diff. (S – LS) | Sig. |
| Left pars opercularis (POPE) | .0534 | 0.00790 |
| Left pars orbitalis (PORB) | .0866 | 0.00370 |
| Left pars triangularis (PTRI) | .0820 | 0.00247 |
| Left rostral anterior cingulate (RAC) | .0964 | 0.00016 |
| Left rostral middle frontal (RMF) | .0548 | 0.00099 |
| Right inferior temporal (IT) | .0551 | 0.00033 |
| Right middle temporal (MT) | .0438 | 0.00156 |
| Right pars triangularis (PTRI) | .0934 | 0.00247 |
| Eloc | ||
|---|---|---|
| Region | Mean diff. (S – LS) | Sig. |
| Left fusiform (FUS) | −.0620 | 0.00058 |
| Left inferior parietal (IP) | −.0414 | 0.00765 |
| Left lateral occipital (LOCC) | −.0610 | 0.00099 |
| Left postcentral (PSTS) | −.0488 | 0.00790 |
| Right fusiform (FUS) | −.0553 | 0.00156 |
| Right lateral occipital (LOCC) | −.0685 | 0.00156 |
| Right superior parietal (SP) | −.0566 | 0.00247 |
| Right transverse temporal (TT) | −.1138 | 0.00016 |
Group differences correspond to network measures obtained at cost 0.12. Positive mean differences indicate higher values in successful participants. Significance levels represent two-tailed p values obtained from Mann-Whitney U tests. Significance was established based on an individual (uncorrected) p value threshold of .01.
Figure 4.

Cortical surfaces display anatomical regions showing the most significant differences in regional measures of Eglob (top) and Eloc (bottom) for networks obtained at a cost threshold of 0.12. Highlighted regions correspond to the significant regions listed in Table 2. Color bar indicates mean group differences in regional network measures (red: successful > less successful).
For Eglob, eight significant regions were identified, all having higher values in the successful participants. These consisted of an extensive set of areas in bilateral dorsolateral pFC (DLPFC) and also included the entire left inferior frontal gyrus (pars orbitalis, triangularis, and opercularis). A substantial body of research has identified regions of the DLPFC as key areas for working memory and language processing (Wong, Ettlinger, Sheppard, Gunasekera, & Dhar, 2010; Wong et al., 2009; Blumenfeld & Ranganath, 2007; Wong, Parsons, Martinez, & Diehl, 2004; Gabrieli, Poldrack, & Desmond, 1998; Zatorre, Evans, Meyer, & Gjedde, 1992). In a previous analysis, we detected increased activation within the pFC of less successful learners during our pitch discrimination task, similarly indicating a difference between the learner groups in neural activation patterns involving these cognitive regions (Wong et al., 2007). Successful participants also had increased Eglob in the right middle and inferior temporal cortex as well as left (rostral) ACC. These temporal areas are known to function in speech processing as part of a dorsal auditory stream in the classic language network (Hickok & Poeppel, 2004), whereas the ACC has been identified as a highly connected hub region that forms part of the brain’s structural core (Hagmann et al., 2008) and also plays a critical role in executive function (MacDonald, Cohen, Stenger, & Carter, 2000).
On the other hand, successful participants showed regional decreases in Eloc relative to less successful learners. Significant decreases were found in a distributed network of temporal, parietal, and occipital regions, including bilateral fusiform, lateral occipital, and parietal (left inferior parietal and right superior parietal) cortices. These parietal areas overlap regions found to perform important functions in verbal working memory (Jonides et al., 1998). Notably, the successful learners also showed decreased Eloc in the right primary auditory (transverse temporal) cortex. Together, the parietal, temporal, and frontal areas exhibiting altered network properties between learner groups also overlap the classical language network (Hickok & Poeppel, 2004).
Whole-cortex Network Properties and Sublexical Pitch Discrimination Abilities6
As for our regional analysis, we report correlations between whole-cortex network properties and pitch discrimination abilities using values of Eglob and Eloc obtained from networks constructed using a cost threshold of 0.12 (in contrast, CEmax is independent of any particular choice of cost threshold). When looking across both successful and less successful learners, we observed no significant correlations between any of the three whole-cortex network measures considered (Eglob, Eloc, and CEmax) and either participants’ fraction of correctly answered trials or the mean RT on correctly answered trials (data not shown). However, when looking within each learner group separately, we found that successful learners (but not less successful learners) exhibited significant correlations between the whole-cortex network measures and mean RT (see Figure 5). Within successful learners, Eglob and CEmax were correlated negatively with mean RT, whereas Eloc correlated positively with mean RT. Because shorter RTs (i.e., faster responses) on correctly answered trials indicate improved task performance, these trends are intuitively consistent with the observation of increased Eglob (and CEmax) but decreased Eloc in the more successful learners. Although it is unclear why network measures correlated significantly with participants’ RTs but not their accuracy on the task, these results suggest that at least within learners who could successfully learn the spoken words of our artificial language, network measures at the whole-cortex level were predictive of performance on the pitch discrimination task performed in the scanner.
Figure 5.

Top: Relationships between network measures (left: Eglob, middle: Eloc, right: CEmax) and successful participants’ mean reaction time on correctly responded trials. Bottom: Plots show same relationships for less successful participants. Blue and red circles indicate individual successful and less successful participants, respectively. Eglob and Eloc correspond to networks constructed using a cost threshold of 0.12. Correlation values correspond to nonparametric Spearman’s rank correlations; p values indicate two-tailed significance levels.
Discussion
Small-world Organization of Cortical Functional Networks
Broadly, our findings are consistent with an emerging body of evidence that cognitive processes are associated with properties of large-scale network organization in the brain. At the whole-cortex level, our participants’ functional networks exhibited markedly higher local efficiency and similar global efficiency relative to randomized surrogate networks possessing identical connectivity distributions, consistent with previous resting-state (Achard & Bullmore, 2007; Achard et al., 2006; Salvador et al., 2005) and task-related (Wang, Li, Metzak, He, & Woodward, 2010; Micheloyannis et al., 2006) studies. This was true across the range of network costs investigated (see Figure 2). Also consistent with previous reports, functional networks exhibited economical properties by maintaining positive cost efficiency across all network costs (Wang et al., 2009; Achard & Bullmore, 2007). These trends were observed in all participants regardless of individual learning abilities, suggesting that economical small-world organization is a hallmark of the functional human brain both at rest and during active task performance.
Large-scale Network Properties and Sound-to-Word Learning Abilities
Crucially, we found that individual variations in small-world network properties were significantly associated with sound-to-word learning abilities, with increased Eglob and CEmax but decreased Eloc in the successful learners. Adding to a body of literature indicating disruptions in network properties over the course of development and senescence (Sheppard, Wang, & Wong, 2011; Wang et al., 2010; Fair et al., 2008, 2009) and in neurological disorders (Wang et al., 2009; Liu et al., 2008; Supekar, Menon, Rubin, Musen, & Greicius, 2008), the present results provide evidence that individual differences in small-world properties are linked to variation in cognitive abilities among healthy, younger adults. Specifically, our findings of increased Eglob and CEmax in successful learners are generally consistent with reports of decreased average path lengths associated with increased intelligence in EEG (Micheloyannis et al., 2006) and resting-state fMRI (van den Heuvel et al., 2009) studies, as well as findings of improved working memory performance correlated with (whole-network) cost efficiency of MEG networks (Bassett et al., 2009). Similarly, we also observed that within successful learners, increased performance on the pitch discrimination task in the scanner (as gauged by participants’ mean RT on correctly answered trials) was positively correlated with both Eglob and CEmax (and negatively correlated with Eloc). Taken together, these results suggest that efficient integration of information from across the cerebral cortex may facilitate improved cognitive function (in our case, pitch discrimination and sound-to-word learning abilities). Notably, speech perception requires coordinated processing among a distributed network of brain regions spanning auditory regions in the temporal cortex and attention and working memory areas in temporoparietal (i.e., Area Spt) and frontal cortices (Hickok & Poeppel, 2007; Binder et al., 1997); thus, one can naturally envision efficient information integration within this network being essential for successful sound-to-word acquisition.
Indeed, consistent with the whole-cortex results, successful learners showed increased Eglob (and decreased Eloc) in all individual cortical regions showing the most significant differences in network properties, including several language-related areas. Strikingly, these areas closely overlapped a network of regions known to function in auditory language perception. First, we found increased Eglob in successful participants within several prefrontal cortical regions that overlapped parts of the DLPFC and inferior frontal cortex. Interestingly, group differences in prefrontal areas were strongly lateralized to the left hemisphere and included the entire left inferior frontal gyrus (pars triangularis, orbitalis, and opercularis) and rostral middle frontal cortex. Notably, the inferior frontal cortex is believed to participate in a left-lateralized dorsal auditory stream that converts sounds into articulatory representations, supporting both speech perception and production (Hickok & Poeppel, 2004, 2007; Zatorre et al., 1992). In addition, regions of the DLPFC and inferior frontal cortex are both implicated in verbal working memory and semantic processing (Jonides et al., 2000; Gabrieli et al., 1998), with the right inferior frontal cortex hypothesized to store pitch information in working memory (Zatorre et al., 1992).
Successful learners also showed increased Eglob within the right middle and inferior temporal cortices, additional areas in the language network. These regions participate in a ventral auditory stream hypothesized to be crucial for auditory object recognition and for mapping acoustical representations onto word meanings (Hickok & Poeppel, 2004, 2007; Rauschecker, 1998). Interestingly, language processing in the ventral stream has been reported to involve bilateral or perhaps weakly left-lateralized activity (Hickok & Poeppel, 2007), whereas we found group differences in these areas concentrated in the right hemisphere. Indeed, successful participants also showed significantly reduced Eloc in right (but not left) primary auditory cortex. As previous research suggests a right hemispheric lateralization for pitch processing in the auditory cortex (particularly during early listening stages before explicit lexical knowledge of word meanings, as was the case for our participants during scanning), the right lateralization of these temporal regions showing significant group differences suggests that the group contrasts in cortical network organization may reflect differences in brain activation patterns associated with pitch discrimination (Luo et al., 2006; Zatorre, 2001), as opposed to simply reflecting general intrinsic or cognitive differences between learner groups, for instance. Importantly, our pitch discrimination task was sublexical, requiring no comprehension other than the ability to discriminate pitch pattern, and this may explain why we observed the most significant differences in network properties within right as opposed to bilateral or left temporal cortex. Although our scanner task was sublexical, these observed temporal regions are also implicated in lexical speech processing during sound-to-word learning, and thus, efficient functional organization of this set of ventral stream regions would also be expected to support successful sound-to-word learning over the course of training.
In addition to the aforementioned prefrontal and temporal areas, group differences in small-world properties also extended to parietal and ACC. Successful participants exhibited increased Eglob in the left rostral ACC and decreased Eloc in left inferior and right superior parietal cortex. Both these parietal areas and the anterior cingulate form part of the brain’s highly connected structural core (Hagmann et al., 2008) and are implicated in attentional processes (Jung & Haier, 2007; Davis, Hutchison, Lozano, Tasker, & Dostrovsky, 2000). In addition, the ventral aspect of inferior parietal cortex around the TPJ has been functionally characterized (together with the parts of the neighboring planum temporale) into a region known as Area Spt, which is believed to function in the dorsal auditory stream to conduct speech information from temporal to frontal areas and facilitate the conversion of acoustic signals into articulatory representations (Hickok & Poeppel, 2007). In this context, the left-lateralized group differences seen in inferior parietal (and similarly in prefrontal) cortex are consistent with the fact that the dorsal auditory stream is strongly left-lateralized (Hickok & Poeppel, 2004, 2007). The parietal regions showing group differences in network measures also overlap areas believed to store auditory information in verbal working memory (Jonides et al., 1998). Overall, findings of altered small-world properties spanning auditory areas in the temporal, prefrontal (particularly including the DLPFC and inferior frontal cortex), and left inferior parietal cortex suggest that the observed differences between successful and less successful learners may be primarily associated with disruption in functional organization involving the language network described by Hickok and Poeppel.
In addition, it is worth mentioning that many of the frontal areas showing group differences in network measures also coincide with regions associated with executive processing. In particular, executive control has been associated with areas of the lateral pFC and the ACC (Heyder, Suchan, & Daum, 2004; MacDonald et al., 2000; Cohen et al., 1999; Goldman-Rakic, 1995), areas for which group differences were observed in either Eglob or Eloc. Because of its central importance for supporting working memory (and particularly verbal working memory), executive function was a critical factor supporting participants’ successful sound-to-word learning in our study (D’Esposito et al., 1995). More generally, loss of function involving these regions is attributed to diverse impairments affecting planning, problem solving, reasoning, verbal fluency, decision-making, and memory encoding and retrieval (see Heyder et al., 2004, for a review). Unsurprisingly, such cognitive abilities mediated by executive function are generally considered fundamental factors determining intelligence (Sternberg, 1988). Notably, van den Heuevel et al. previously found that characteristic path length (analogous to Eglob) of whole-brain resting-state fMRI networks correlated with general intelligence, with lower path lengths (i.e., higher Eglob) predictive of increased intelligence (van den Heuvel et al., 2009). These whole-brain trends were driven in particular by correlations involving pFC regions, although the strongest correlations were observed in medial pFC regions as opposed to the lateral areas classically linked to executive function. Nevertheless, an intriguing possibility is that high global efficiency of information transfer (either throughout the brain or specifically involving a network supporting executive processing) may be required to sustain executive function, which in our case could have manifested itself as participants’ performance on the pitch discrimination and sound-to-word learning tasks. Such a model would be consistent with the observation that executive function relies on interactions between a distributed network of areas spanning lateral pFC, ACC, and subcortical structures including the thalamus, the BG, and the hippocampus (Heyder et al., 2004). Unfortunately, we did not conduct a full cognitive assessment on our cohort of participants, so whether the observed group differences in network properties are (a) associated with intelligence or executive processing generally or (b) only relate specifically to participants’ pitch discrimination or sound-to-word learning abilities is unknown.
Interpretation of Learner Group Differences in Network Properties
Aside from our findings of direct correlations between whole-cortex network measures and successful learners’ performance on the pitch discrimination task (see Figure 5), our primary approach in this study was to correlate graph theoretical measures from cortical functional networks pertaining to a sublexical pitch discrimination task with participants’ subsequent performance on (lexical) word identification tests administered after they began training to associate the pseudoword stimuli presented in the scanner with target objects. Therefore, differences in functional network organization reported between successful and less successful learners pertain to differences in activation patterns obtained during a sublexical discrimination task, which differed substantially in terms of cognitive and linguistic requirements from the lexical sound-to-word testing they underwent over the course of training. In particular, the word identification tests involved associating pitch patterns with target objects, thus requiring participants to utilize long-term semantic memory. On the other hand, the pitch discrimination task only required lower-level auditory processing and phonological working memory and did not involve lexical or long-term memory components. A potential limitation of this discrepancy is that past research has implicated prelinguistic pitch processing to be right-lateralized, whereas left-lateralized areas are implicated in using pitch information linguistically (Zatorre et al., 1992). Given that our successful learners performed better than less successful learners at processing pitch both lexically (i.e., improved sound-to-word learning) and sublexically (i.e., improved pretraining pitch discrimination), one might expect group differences in both of these dissociated pitch processing streams. However, because the sublexical pitch discrimination task used during fMRI acquisition only required participants to process pitch sublexically, there should be differential hemispheric requirements between the pitch discrimination task and sound-to-word learning paradigms in terms of linguistic versus nonlinguistic components of the tasks.
Although the discrepancy between the sublexical pitch discrimination and sound-to-word leaning assessments arguably makes the interpretation of differences in network properties between learner groups less straightforward, our primary aim in designing these experiments was to address how the neural processing of a specific phonetic feature of language (pitch) contributes to sound-to-word learning abilities (Wong et al., 2007; Wong & Perrachione, 2007). This is chiefly why a pitch discrimination task was used for our imaging experiment (e.g., rather than a sound identification task). Indeed, our present set of experiments indicated that participants’ ability to perceive pitch in nonlexical contexts is a strong predictor of individuals’ abilities to use pitch lexically: successful sound-to-word learners had significantly increased response accuracy on the pitch discrimination task (before behavioral training) relative to less successful learners (p = .015, two-tailed t test; p = 0, Mann–Whitney U test). Ultimately, the group differences reported for our task-related cortical networks should be interpreted as contrasts in functional organization related to sublexical pitch discrimination that discriminate successful and less successful sound-to-word learning (specifically, sound-to-word learning that requires pitch perception in lexical contexts), rather than differences in functional organization directly related to sound-to-word learning per se.
Another question regarding the interpretation of these network properties is the directionality of the observed group differences and in particular why we observed increased global efficiency but decreased local efficiency in successful learners. It is important to note a fundamental tradeoff in network organization between global efficiency (i.e., distributed processing) and local efficiency (i.e., segregated processing). For instance, a network that is completely regular (or lattice-like) will have very high local efficiency but low global efficiency relative to an equivalent random network (i.e., at the whole-network level). High global efficiency in random networks arises because only few connections are needed on average to get from one node to any other node when the nodes are connected randomly, but by the same token there will be no organization of the network into local modules or clusters; hence, the local efficiency (which gauges the extent of organization into functional clusters) will be low relative to more organized networks. These network measures are not completely redundant, but they are closely related and thus highly nonindependent. For instance, at a network cost of 0.12, the correlation between whole-cortex measures of Eglob and Eloc across all participants regardless of learning abilities was r(15) = −0.792 (p = 1.5e−4). As a result, the successful learners’ networks would be expected to have reduced local efficiency if they exhibited increased global efficiency relative to the less successful learners or vice versa.
One rationale for the observed results is therefore that the efficient transfer of information across the brain (at least at the scale considered in our analysis) is a factor associated with improved performance on cognitively demanding tasks (in our case, a sound-to-word learning task). Such an interpretation corroborates previous studies employing both resting-state functional connectivity MRI (van den Heuvel et al., 2008) and MEG (Bassett et al., 2009), which associated characteristic path length or global efficiency with general intelligence and working memory performance (respectively) in the same manner that we associate global efficiency with sound-to-word learning success. Under such a rationale, one might also anticipate a trend toward reduced local efficiency in the successful learners, because the two measures are inversely related. It would perhaps seem less likely that local efficiency is directly detrimental to sound-to-word learning performance, but we stress that our analysis provides no information regarding the causality of these associations.
In summary, our finding of increased global efficiency in successful sound-to-word learners corroborates earlier findings concerning how large-scale graph measures of brain functional networks correlate with higher-level performance among younger, healthy adults. To the authors’ knowledge, as consistent a picture has not yet emerged regarding associations between local efficiency and task performance among younger, healthy adults. Again, however, our studies and the others we cite are purely correlative in nature, and we cannot claim that elevated global efficiency (or decreased local efficiency) in functional network organization leads to improved sound-to-world learning. Indeed, the purely correlative studies to date in no way prove that the brain was optimized for “small-world” structure, global efficiency, cost efficiency, or any other such metric, although these possibilities have been raised by theorists for some time. Rather, we view these results as interesting and reliable associations that are unique in their ability to account for learning abilities among healthy, younger adults using simple summary metrics that reflect large-scale organization across the entire cortex and which are thus of practical interest for their diagnostic utility, although more thorough (and causal) investigations of such associations are also in order. Thus, in this article, we ultimately stress the ability of graph theoretical approaches to detect significant, reliable differences in cortical network organization that discriminate cognitive performance among healthy, younger adults at the whole-cortex level, rather than speculate on the underlying mechanisms driving these associations.
Methodological Considerations
In this study, we employed a block design with a long TR of 14 sec during fMRI acquisition. This sparse sampling technique captures only low-frequency oscillations of the hemodynamic response (<.036 Hz) but ensures that auditory stimuli are not contaminated by auditory noise from the scanner (Belin et al., 1999). We note, however, that our methods are different in certain important respects from standard functional connectivity analyses. First, our long TR substantially limited the frequency range during scanning to signals falling under 0.036 Hz, whereas the greatest power in the BOLD response extends to frequencies as high as 0.1 Hz (Salvador et al., 2005; Cordes et al., 2000; Lowe, Mock, & Sorenson, 1998; Biswal, Yetkin, Haughton, & Hyde, 1995). This was a fundamental limitation of our study that allowed us to avoid auditory scanner noise during stimulus presentation, and it is possible that the low-frequency (<0.036 Hz) signals represented in our data do not reflect the same processes represented by standard measures of functional connectivity obtained over a wider frequency spectrum (e.g., up to 0.1 Hz after low-pass filtering using a rapid TR). A second fundamental difference between our study and many (but not all) functional connectivity analyses is that our study sought to associate correlations in BOLD responses between brain areas during the performance of an active task rather than during rest. In the current analysis, we explored the association between sound-to-word learning and functional network organization assessed during the performance of a task related to the behavior under study. On the other hand, some argue that imaging the resting-state brain offers a more principled way to assess physiological connectivity (Bressler & Menon, 2010; Jones et al., 2010) and even that task effects should be actively regressed out in connectivity analyses if a task was performed during imaging (e.g., Jones et al., 2010). This opinion is not universally held, and we and others believe that insights can be gained from studying BOLD correlations obtained both at rest and during task performance (Muller et al., 2011). Clearly, however, these choices carry important methodological implications that must be considered when interpreting the results of such studies.
Third, another limitation of our study relates to the way in which the spoken word stimuli were generated. In particular, all tokens of a pitch category (level, rising, and falling) began and ended at the same pitch levels to model a single talker, unlike in everyday language in which tokens of a given pitch category have naturally varying fundamental frequencies and pitch contours that differ across talkers. This raises the possibility that participants in our study may have simply learned the exact starting or ending pitch levels corresponding to each pitch category, rather than forming abstract phonetic categories. Nevertheless, our learning task required participants to integrate foreign phonetic categories into word contexts not only in three words, but a vocabulary of 18 words.
Conclusion
In this study, we demonstrate that small-world properties of large-scale cortical functional networks related to an auditory pitch discrimination task are associated with participants’ abilities to learn words of an artificial language. Relative to less successful learners, participants who successfully learned the words of this spoken language possessed increased global efficiency but reduced local efficiency at the whole-cortex level and also possessed a more cost efficient network organization. Regional analysis of these network properties (though exploratory in nature) corroborated with the whole-cortex trends, with successful learners exhibiting increased Eglob and decreased Eloc in regions showing the most significant group differences. The most significant regions closely overlapped an auditory language network of temporal, parietal, and prefrontal cortices, including both primary auditory cortex and higher-level attention and working memory areas. Overall, these findings not only contribute to a growing view that effective cognitive processing hinges upon efficient large-scale brain functional organization (Bressler & Menon, 2010; Sporns et al., 2004) but demonstrate that variation in these network properties is associated with measurable differences in behavior even among healthy, younger adults. Furthermore, they suggest that successful sound-to-word learning is distinguished by efficient global information transfer in a network of speech-related areas spanning the prefrontal and temporal cortex.
Acknowledgments
Funding for this research was provided by the National Science Foundation (grant BCS-0719666), National Institutes of Health (grants R01DC008333, R21DC009652, and K02AG035382), and the Northwestern University Office of the Provost (to J. S.). We thank Olaf Sporns and Mikail Rubinov for providing useful Matlab functions in their freely available Brain Connectivity Toolbox, which we implemented together with in-house code to carry out our analyses. Finally, we thank Liqun Xi, Tyler Perrachione, Choon Hye Kang, and Devdutta Warhadpande for their assistance with this research.
Footnotes
Although the three pitch contours used in our study are analogous to the rising, level, and falling tones of Mandarin Chinese, it is important to note that the stimuli themselves were not Mandarin words. Our aim was rather to study how participants learn to use pitch lexically (Wong & Perrachione, 2007); because unknown words consisting of native phonological patterns are more easily learned than those containing nonnative phonological patterns (Feldman & Healy, 1998), we specifically used natural English sounds produced by a native English speaker as our stimulus set.
Note that as a result of using these criteria to terminate training, individual participants varied in the total number of training sessions they completed, although on average training was terminated after around eight behavioral sessions. We felt that allowing participants to reach their own maximal performance levels was a more meaningful metric of the completion of training than using an arbitrary, fixed number of behavioral sessions to consider training complete (Wong & Perrachione, 2007).
It is important to note that, by definition, local efficiency is undefined in nodes with fewer than two neighbors. Rather than arbitrarily assigning a local efficiency of zero to such nodes, we omit these cases from the calculation of average Eloc values.
Although task accuracy is arguably a more direct metric of task performance, this measure can become problematic in the case of ceiling or floor effects (i.e., when participants perform with either near-perfect accuracy or accuracy at or below levels predicted by random selection of responses). As an alternative, the use of RT as a metric of cognitive performance is well established, particularly for the analysis of alternative forced-choice tasks (Nosofsky, 1992; Sergent & Takane, 1987; Takane & Sergent, 1983). Because our less successful participants performed at floor levels on the pitch discrimination task in the scanner, we also assessed task performance by considering participants’ mean RT for correctly answered trials (with shorter reaction times indicating improved performance), in addition to computing correlations between network measures and the fraction of correctly answered trials (i.e., accuracy).
Note also the presence of a statistical outlier in the successful participants’ distribution of CEmax values (indicated in Figure 3 [right] by the crosshair at CEmax ≈ 0.4). This value was considered an outlier because it fell more than 2.5 SD below the mean CEmax of successful learners. Because of the potential for such outliers and especially because of our small sample sizes, we adopted nonparametric methods for all group comparisons and correlations we report; unlike parametric tests, such nonparametric tests remain robust in the presence of outliers and normality violations.
Note that for our correlational analysis of network properties and fMRI scanner (i.e., pitch discrimination) task performance, sample size for successful learners was reduced from nine to eight because a technical glitch during one participant’s scanning session prevented the acquisition of behavioral data.
References
- Achard S, Bullmore E. Efficiency and cost of economical brain functional networks. PLoS Computational Biology. 2007;3:e17. doi: 10.1371/journal.pcbi.0030017. [DOI] [PMC free article] [PubMed] [Google Scholar]
- Achard S, Salvador R, Whitcher B, Suckling J, Bullmore E. A resilient, low-frequency, small-world human brain functional network with highly connected association cortical hubs. Journal of Neuroscience. 2006;26:63–72. doi: 10.1523/JNEUROSCI.3874-05.2006. [DOI] [PMC free article] [PubMed] [Google Scholar]
- Bassett DS, Bullmore ET. Human brain networks in health and disease. Current Opinion in Neurology. 2009;22:340–347. doi: 10.1097/WCO.0b013e32832d93dd. [DOI] [PMC free article] [PubMed] [Google Scholar]
- Bassett DS, Bullmore ET, Meyer-Lindenberg A, Apud JA, Weinberger DR, Coppola R. Cognitive fitness of cost-efficient brain functional networks. Proceedings of the National Academy of Sciences, USA. 2009;106:11747–11752. doi: 10.1073/pnas.0903641106. [DOI] [PMC free article] [PubMed] [Google Scholar]
- Belin P, Zatorre RJ, Hoge R, Evans AC, Pike B. Event-related fMRI of the auditory cortex. Neuroimage. 1999;10:417–429. doi: 10.1006/nimg.1999.0480. [DOI] [PubMed] [Google Scholar]
- Binder JR, Frost JA, Hammeke TA, Cox RW, Rao SM, Prieto T. Human brain language areas identified by functional magnetic resonance imaging. Journal of Neuroscience. 1997;17:353–362. doi: 10.1523/JNEUROSCI.17-01-00353.1997. [DOI] [PMC free article] [PubMed] [Google Scholar]
- Birdsong D. Introduction: Whys and why nots of the critical period hypothesis for second language acquisition. In: Birdsong D, editor. Second language acquisition and the critical period hypothesis. Mahwah, NJ: Erlbaum; 1999. pp. 1–22. [Google Scholar]
- Biswal B, Yetkin FZ, Haughton VM, Hyde JS. Functional connectivity in the motor cortex of resting human brain using echo-planar MRI. Magnetic Resonance in Medicine. 1995;34:537–541. doi: 10.1002/mrm.1910340409. [DOI] [PubMed] [Google Scholar]
- Blumenfeld RS, Ranganath C. Prefrontal cortex and long-term memory encoding: An integrative review of findings from neuropsychology and neuroimaging. Neuroscientist. 2007;13:280–291. doi: 10.1177/1073858407299290. [DOI] [PubMed] [Google Scholar]
- Boersman P, Weeknik D. [Accessed 15 June 2006];Praat: Doing phonetics by computer (v. 4.3.04) 2005 Retrieved from www.fon.hum.uva.nl/praat/
- Bongaerts T. Ultimate attainment in L2 pronunciation: The case of very advanced late L2 learners. In: Birdsong D, editor. Second language acquisition and the critical period hypothesis. Mahwah, NJ: Erlbaum; 1999. pp. 133–160. [Google Scholar]
- Bressler SL, Kelso JA. Cortical coordination dynamics and cognition. Trends in Cognitive Sciences. 2001;5:26–36. doi: 10.1016/s1364-6613(00)01564-3. [DOI] [PubMed] [Google Scholar]
- Bressler SL, Menon V. Large-scale brain networks in cognition: Emerging methods and principles. Trends in Cognitive Sciences. 2010;14:277–290. doi: 10.1016/j.tics.2010.04.004. [DOI] [PubMed] [Google Scholar]
- Bullmore E, Sporns O. Complex brain networks: Graph theoretical analysis of structural and functional systems. Nature Reviews Neuroscience. 2009;10:186–198. doi: 10.1038/nrn2575. [DOI] [PubMed] [Google Scholar]
- Cohen RA, Kaplan RF, Zuffante P, Moser DJ, Jenkins MA, Salloway S, et al. Alteration of intention and self-initiated action associated with bilateral anterior cingulotomy. Journal of Neuropsychiatry & Clinical Neurosciences. 1999;11:444–453. doi: 10.1176/jnp.11.4.444. [DOI] [PubMed] [Google Scholar]
- Cordes D, Haughton VM, Arfanakis K, Wendt GJ, Turski PA, Moritz CH, et al. Mapping functionally related regions of brain with functional connectivity MR imaging. American Journal of Neuroradiology. 2000;21:1636–1644. [PMC free article] [PubMed] [Google Scholar]
- Cox RW. AFNI: Software for analysis and visualization of functional magnetic resonance neuroimages. Computers and Biomedical Research. 1996;29:162–173. doi: 10.1006/cbmr.1996.0014. [DOI] [PubMed] [Google Scholar]
- Curtin S, Goad H, Pater JV. Phonological transfer and levels of representation: The perceptual acquisition of Thai voice and aspiration by English and French speakers. Second Language Research. 1998;14:389–405. [Google Scholar]
- Dale AM, Fischl B, Sereno MI. Cortical surface-based analysis - I. Segmentation and surface reconstruction. Neuroimage. 1999;9:179–194. doi: 10.1006/nimg.1998.0395. [DOI] [PubMed] [Google Scholar]
- Davis KD, Hutchison WD, Lozano AM, Tasker RR, Dostrovsky JO. Human anterior cingulated cortex neurons modulated by attention-demanding tasks. Journal of Neurophysiology. 2000;83:3575–3577. doi: 10.1152/jn.2000.83.6.3575. [DOI] [PubMed] [Google Scholar]
- Desikan RS, Segonne F, Fischl B, Quinn BT, Dickerson BC, Blacker D, et al. An automated labeling system for subdividing the human cerebral cortex on MRI scans into gyral based regions of interest. Neuroimage. 2006;31:968–980. doi: 10.1016/j.neuroimage.2006.01.021. [DOI] [PubMed] [Google Scholar]
- D’Esposito M, Detre JA, Alsop DC, Shin RK, Atlas S, Grossman M. The neural basis of the central executive system of working memory. Nature. 1995;378:279–281. doi: 10.1038/378279a0. [DOI] [PubMed] [Google Scholar]
- Eguiluz VM, Chialvo DR, Cecchi GA, Baliki M, Apkarian AV. Scale-free brain functional networks. Physical Review Letters. 2005;94:018102. doi: 10.1103/PhysRevLett.94.018102. [DOI] [PubMed] [Google Scholar]
- Eisner F, McGettigan C, Faulkner A, Rosen S, Scott SK. Inferior frontal gyrus activation predicts individual differences in perceptual learning of cochlear-implant simulations. Journal of Neuroscience. 2010;30:7179–7186. doi: 10.1523/JNEUROSCI.4040-09.2010. [DOI] [PMC free article] [PubMed] [Google Scholar]
- Fair DA, Cohen AL, Dosenbach NU, Church JA, Miezin FM, Barch DM, et al. The maturing architecture of the brain’s default network. Proceedings of the National Academy of Sciences, USA. 2008;105:4028–4032. doi: 10.1073/pnas.0800376105. [DOI] [PMC free article] [PubMed] [Google Scholar]
- Fair DA, Cohen AL, Power JD, Dosenbach NU, Church JA, Miezin FM, et al. Functional brain networks develop from a “local to distributed” organization. PLoS Computational Biology. 2009;5:e1000381. doi: 10.1371/journal.pcbi.1000381. [DOI] [PMC free article] [PubMed] [Google Scholar]
- Feldman A, Healy AF. Effect of first language phonological configuration on lexical acquisition in a second language. In: Healy AF, Bourne LE, editors. Foreign language learning: Psychological studies on training and retention. Mahwah, NJ: Erlbaum; 1998. pp. 57–76. [Google Scholar]
- Gabrieli JDE, Poldrack RA, Desmond JE. The role of left prefrontal cortex in language and memory. Proceedings of the National Academy of Sciences, USA. 1998;95:906–913. doi: 10.1073/pnas.95.3.906. [DOI] [PMC free article] [PubMed] [Google Scholar]
- Gigandet X, Hagmann P, Kurant M, Cammoun L, Meuli R, Thiran JP. Estimating the confidence level of white matter connections obtained with MRI tractography. PLoS ONE. 2008;3:e4006. doi: 10.1371/journal.pone.0004006. [DOI] [PMC free article] [PubMed] [Google Scholar]
- Goldman-Rakic PS. Architecture of the prefrontal cortex and the central executive. Annals of the New York Academy of Sciences. 1995;769:71–83. doi: 10.1111/j.1749-6632.1995.tb38132.x. [DOI] [PubMed] [Google Scholar]
- Golestani N, Molko N, Dehaene S, LeBihan D, Pallier C. Brain structure predicts the learning of foreign speech sounds. Cerebral Cortex. 2007;17:575–582. doi: 10.1093/cercor/bhk001. [DOI] [PubMed] [Google Scholar]
- Gong G, Rosa-Neto P, Carbonell F, Chen ZJ, He Y, Evans AC. Age- and gender-related differences in the cortical anatomical network. Journal of Neuroscience. 2009;29:15684–15693. doi: 10.1523/JNEUROSCI.2308-09.2009. [DOI] [PMC free article] [PubMed] [Google Scholar]
- Hagmann P, Cammoun L, Gigandet X, Meuli R, Honey CJ, Wedeen V, et al. Mapping the structural core of human cerebral cortex. PLoS Biology. 2008;6:1479–1493. doi: 10.1371/journal.pbio.0060159. [DOI] [PMC free article] [PubMed] [Google Scholar]
- Hall DA, Haggard MP, Akeroyd MA, Palmer AR, Summerfield AQ, Elliott MR, et al. “Sparse” temporal sampling in auditory fMRI. Human Brain Mapping. 1999;7:213–223. doi: 10.1002/(SICI)1097-0193(1999)7:3<213::AID-HBM5>3.0.CO;2-N. [DOI] [PMC free article] [PubMed] [Google Scholar]
- Heyder K, Suchan B, Daum I. Cortico-subcortical contributions to executive control. Acta Psychologica (Amsterdam) 2004;115:271–289. doi: 10.1016/j.actpsy.2003.12.010. [DOI] [PubMed] [Google Scholar]
- Hickok G, Poeppel D. Dorsal and ventral streams: A framework for understanding aspects of the functional anatomy of language. Cognition. 2004;92:67–99. doi: 10.1016/j.cognition.2003.10.011. [DOI] [PubMed] [Google Scholar]
- Hickok G, Poeppel D. The cortical organization of speech processing. Nature Reviews Neuroscience. 2007;8:393–402. doi: 10.1038/nrn2113. [DOI] [PubMed] [Google Scholar]
- Iturria-Medina Y, Sotero RC, Canales-Rodriguez EJ, Aleman-Gomez Y, Melie-Garcia L. Studying the human brain anatomical network via diffusion-weighted MRI and graph theory. Neuroimage. 2008;40:1064–1076. doi: 10.1016/j.neuroimage.2007.10.060. [DOI] [PubMed] [Google Scholar]
- Johnson JS, Newport EL. Critical period effects in second language learning: The influence of maturational state on the acquisition of English as a second language. Cognitive Psychology. 1989;21:60–99. doi: 10.1016/0010-0285(89)90003-0. [DOI] [PubMed] [Google Scholar]
- Jones TB, Bandettini PA, Kenworthy L, Case LK, Milleville SC, Martin A, et al. Sources of group differences in functional connectivity: An investigation applied to autism spectrum disorder. Neuroimage. 2010;49:401–414. doi: 10.1016/j.neuroimage.2009.07.051. [DOI] [PMC free article] [PubMed] [Google Scholar]
- Jonides J, Marshuetz C, Smith EE, Reuter-Lorenz PA, Koeppe RA, Hartley A. Age differences in behavior and PET activation reveal differences in interference resolution in verbal working memory. Journal of Cognitive Neuroscience. 2000;12:188–196. doi: 10.1162/089892900561823. [DOI] [PubMed] [Google Scholar]
- Jonides J, Schumacher EH, Smith EE, Koeppe RA, Awh E, Reuter-Lorenz PA, et al. The role of parietal cortex in verbal working memory. Journal of Neuroscience. 1998;18:5026–5034. doi: 10.1523/JNEUROSCI.18-13-05026.1998. [DOI] [PMC free article] [PubMed] [Google Scholar]
- Jung RE, Haier RJ. The parieto-frontal integration theory (P-FIT) of intelligence: Converging neuroimaging evidence. Behavioral and Brain Sciences. 2007;30:135–187. doi: 10.1017/S0140525X07001185. [DOI] [PubMed] [Google Scholar]
- Latora V, Marchiori M. Efficient behavior of small-world networks. Physical Review Letters. 2001:e198701, 1–4. doi: 10.1103/PhysRevLett.87.198701. [DOI] [PubMed] [Google Scholar]
- Liu Y, Liang M, Zhou Y, He Y, Hao Y, Song M, et al. Disrupted small-world networks in schizophrenia. Brain. 2008;131:945–961. doi: 10.1093/brain/awn018. [DOI] [PubMed] [Google Scholar]
- Lowe MJ, Mock BJ, Sorenson JA. Functional connectivity in single and multislice echoplanar imaging using resting-state fluctuations. Neuroimage. 1998;7:119–132. doi: 10.1006/nimg.1997.0315. [DOI] [PubMed] [Google Scholar]
- Luo H, Ni JT, Li ZH, Li XO, Zhang DR, Zeng FG, et al. Opposite patterns of hemisphere dominance for early auditory processing of lexical tones and consonants. Proceedings of the National Academy of Sciences, USA. 2006;103:19558–19563. doi: 10.1073/pnas.0607065104. [DOI] [PMC free article] [PubMed] [Google Scholar]
- MacDonald AW, III, Cohen JD, Stenger VA, Carter CS. Dissociating the role of the dorsolateral prefrontal and anterior cingulate cortex in cognitive control. Science. 2000;288:1835–1838. doi: 10.1126/science.288.5472.1835. [DOI] [PubMed] [Google Scholar]
- Micheloyannis S, Pachou E, Stam CJ, Vourkas M, Erimaki S, Tsirka V. Using graph theoretical analysis of multi channel EEG to evaluate the neural efficiency hypothesis. Neuroscience Letters. 2006;402:273–277. doi: 10.1016/j.neulet.2006.04.006. [DOI] [PubMed] [Google Scholar]
- Miyake A, Friedman N. Individual differences in second language proficiency: Working memory as language aptitude. In: Healy AF, Bourne LEJ, editors. Foreign language learning: Psycholinguistic studies on training and retention. Mahwah, NJ: Lawrence Erlbaum Associates; 1998. pp. 338–364. [Google Scholar]
- Muller RA, Shih P, Keehn B, Deyoe JR, Leyden KM, Shukla DK. Underconnected, but how? A survey of functional connectivity MRI studies in autism spectrum disorders. Cerebral Cortex. 2011;21:2233–2243. doi: 10.1093/cercor/bhq296. [DOI] [PMC free article] [PubMed] [Google Scholar]
- Nosofsky R. Similarity scaling and cognitive process models. Annual Reviews Psychology. 1992;43:25–53. [Google Scholar]
- Peach RK, Wong PCM. Integrating the message level into treatment for agrammatism using story retelling. Aphasiology. 2004;18:429–441. [Google Scholar]
- Rauschecker JP. Cortical processing of complex sounds. Current Opinion in Neurobiology. 1998;8:516–521. doi: 10.1016/s0959-4388(98)80040-8. [DOI] [PubMed] [Google Scholar]
- Raymer AM, Maher LM, Greenwald ML, Morris MK, Rothi LJG, Heilman KM. Unpublished manuscript. 1990. The Florida Semantics Battery. [Google Scholar]
- Saad ZS, Reynolds RC, Argall B, Japee S, Cox RW. Suma: An interface for surface-based intra- and inter-participant analysis with AFNI. IEEE International Symposium on Biomedical Imaging: Macro to Nano. 2004;2:1510–1513. [Google Scholar]
- Salvador R, Suckling J, Coleman MR, Pickard JD, Menon D, Bullmore E. Neurophysiological architecture of functional magnetic resonance images of human brain. Cerebral Cortex. 2005;15:1332–1342. doi: 10.1093/cercor/bhi016. [DOI] [PubMed] [Google Scholar]
- Sergent J, Takane Y. Structures in two-choice reaction-time data. Journal of Experimental Psychology: Human Perception and Performance. 1987;13:300–315. [Google Scholar]
- Sheppard JP, Wang JP, Wong PCM. Large-scale cortical functional organization and speech perception across the lifespan. PLoS ONE. 2011;6:e16510. doi: 10.1371/journal.pone.0016510. [DOI] [PMC free article] [PubMed] [Google Scholar]
- Snow CE, Hoefnagel-Hohle M. Individual differences in second-language ability: A factor-analytic study. Language and Speech. 1979;22:151–162. doi: 10.1177/002383097902200205. [DOI] [PubMed] [Google Scholar]
- Sporns O, Chialvo DR, Kaiser M, Hilgetag CC. Organization, development and function of complex brain networks. Trends in Cognitive Sciences. 2004;8:418–425. doi: 10.1016/j.tics.2004.07.008. [DOI] [PubMed] [Google Scholar]
- Sporns O, Tononi G, Edelman GM. Connectivity and complexity: The relationship between neuroanatomy and brain dynamics. Neural Networks. 2000;13:909–922. doi: 10.1016/s0893-6080(00)00053-8. [DOI] [PubMed] [Google Scholar]
- Stam CJ. Functional connectivity patterns of human magnetoencephalographic recordings: A “small-world” network? Neuroscience Letters. 2004;355:25–28. doi: 10.1016/j.neulet.2003.10.063. [DOI] [PubMed] [Google Scholar]
- Stam CJ, Reijneveld JC. Graph theoretical analysis of complex networks in the brain. Nonlinear Biomedical Physics. 2007;1:3. doi: 10.1186/1753-4631-1-3. [DOI] [PMC free article] [PubMed] [Google Scholar]
- Sternberg R. The triarchic mind: A new theory of human intelligence. New York: Viking Penguin; 1988. [Google Scholar]
- Supekar K, Menon V, Rubin D, Musen M, Greicius MD. Network analysis of intrinsic functional brain connectivity in Alzheimer’s disease. PLoS Computational Biology. 2008;4:e1000100. doi: 10.1371/journal.pcbi.1000100. [DOI] [PMC free article] [PubMed] [Google Scholar]
- Takane Y, Sergent J. Multi-dimensional models for reaction times and same–different judgments. Psychometrika. 1983;48:393–423. [Google Scholar]
- Tononi G, Edelman GM, Sporns O. Complexity and coherency: Integrating information in the brain. Trends in Cognitive Sciences. 1998;2:474–484. doi: 10.1016/s1364-6613(98)01259-5. [DOI] [PubMed] [Google Scholar]
- van den Heuvel MP, Stam CJ, Boersma M, Hulshoff Pol HE. Small-world and scale-free organization of voxel-based resting-state functional connectivity in the human brain. Neuroimage. 2008;43:528–539. doi: 10.1016/j.neuroimage.2008.08.010. [DOI] [PubMed] [Google Scholar]
- van den Heuvel MP, Stam CJ, Kahn RS, Hulshoff Pol HE. Efficiency of functional brain networks and intellectual performance. Journal of Neuroscience. 2009;29:7619–7624. doi: 10.1523/JNEUROSCI.1443-09.2009. [DOI] [PMC free article] [PubMed] [Google Scholar]
- Wang L, Li Y, Metzak P, He Y, Woodward TS. Age-related changes in topological patterns of large-scale brain functional networks during memory encoding and recognition. Neuroimage. 2010;50:862–872. doi: 10.1016/j.neuroimage.2010.01.044. [DOI] [PubMed] [Google Scholar]
- Wang L, Zhu C, He Y, Zang Y, Cao Q, Zhang H, et al. Altered small-world brain functional networks in children with attention-deficit/hyperactivity disorder. Human Brain Mapping. 2009;30:638–649. doi: 10.1002/hbm.20530. [DOI] [PMC free article] [PubMed] [Google Scholar]
- Warrier CM, Wong PCM, Penhure VB, Zatorre RJ, Parrish TB, Abrams DA, et al. Relating structure to function: Heschl’s gyrus and acoustic processing. Journal of Neuroscience. 2009;29:61–69. doi: 10.1523/JNEUROSCI.3489-08.2009. [DOI] [PMC free article] [PubMed] [Google Scholar]
- Watts DJ, Strogatz SH. Collective dynamics of “small-world” networks. Nature. 1998;393:440–442. doi: 10.1038/30918. [DOI] [PubMed] [Google Scholar]
- Wong PC, Ettlinger M, Sheppard JP, Gunasekaran G, Dhar S. Neuroanatomical characteristics and speech perception in noise in older adults. Ear and Hearing. 2010;31:471–479. doi: 10.1097/AUD.0b013e3181d709c2. [DOI] [PMC free article] [PubMed] [Google Scholar]
- Wong PC, Jin JX, Gunasekera GM, Abel R, Lee ER, Dhar S. Aging and cortical mechanisms of speech perception in noise. Neuropsychologia. 2009;47:693–703. doi: 10.1016/j.neuropsychologia.2008.11.032. [DOI] [PMC free article] [PubMed] [Google Scholar]
- Wong PC, Parsons LM, Martinez M, Diehl RL. The role of the insular cortex in pitch pattern perception: The effect of linguistic contexts. Journal of Neuroscience. 2004;24:9153–9160. doi: 10.1523/JNEUROSCI.2225-04.2004. [DOI] [PMC free article] [PubMed] [Google Scholar]
- Wong PC, Perrachione TK, Parrish TB. Neural characteristics of successful and less successful speech and word learning in adults. Human Brain Mapping. 2007;28:995–1006. doi: 10.1002/hbm.20330. [DOI] [PMC free article] [PubMed] [Google Scholar]
- Wong PCM, Perrachione TK. Learning pitch patterns in lexical identification by native English-speaking adults. Applied Psycholinguistics. 2007;28:565–585. [Google Scholar]
- Wong PCM, Warrier CM, Penhune VB, Roy AK, Sadehh A, Parrish TB, et al. Volume of left heschl’s gyrus and linguistic pitch learning. Cerebral Cortex. 2008;18:828–836. doi: 10.1093/cercor/bhm115. [DOI] [PMC free article] [PubMed] [Google Scholar]
- Zatorre RJ. Neural specializations for tonal processing. Annals of the New York Academy of Sciences. 2001;930:193–210. doi: 10.1111/j.1749-6632.2001.tb05734.x. [DOI] [PubMed] [Google Scholar]
- Zatorre RJ, Evans AC, Meyer E, Gjedde A. Lateralization of phonetic and pitch discrimination in speech processing. Science. 1992;256:846–849. doi: 10.1126/science.1589767. [DOI] [PubMed] [Google Scholar]