

Abstract
As time- and ensemble-averaged measures, NMR observables contain information about both protein structure and dynamics. This work represents a computational study to extract such information for membrane proteins from orientation-dependent NMR observables: solid-state NMR chemical shift anisotropy and dipolar coupling, and solution NMR residual dipolar coupling. We have performed NMR-restrained molecular dynamics simulations to refine the structure of the membrane-bound form of Pf1 coat protein in explicit lipid bilayers using the recently measured chemical shift anisotropy, dipolar coupling, and residual dipolar coupling data. From the simulations, we have characterized detailed protein-lipid interactions and explored the dynamics. All simulations are stable and the NMR restraints are well satisfied. The C-terminal transmembrane (TM) domain of Pf1 finds its optimal position in the membrane quickly (within 6 ns), illustrating efficient solvation of TM domains in explicit bilayer environments. Such rapid convergence also leads to well-converged interaction patterns between the TM helix and the membrane, which clearly show the interactions of interfacial membrane-anchoring residues with the lipids. For the N-terminal periplasmic helix of Pf1, we identify a stable, albeit dynamic, helix orientation parallel to the membrane surface that satisfies the amphiphatic nature of the helix in an explicit lipid bilayer. Such detailed information cannot be obtained solely from NMR observables. Therefore, the present simulations illustrate the usefulness of NMR-restrained MD refinement of membrane protein structure in explicit membranes.
Introduction
NMR spectroscopy can provide high-resolution three-dimensional (3D) structures of membrane proteins embedded in phospholipid bilayers or bicelles, or dissolved in detergent micelles (1–3). A significant advantage of this technique is that NMR observables represent time- and ensemble-averaged structural restraints, and therefore provide information about protein dynamics that can be used to study collective motions relevant to protein function (4–7). NMR studies performed in lipid bilayers or bicelles have the most biological relevance because they capture the structures and dynamics of membrane proteins in their native-like membrane environment. Membrane proteins can be reconstituted in phospholipid proteoliposomes, planar bilayers, or bicelles, for solid-state NMR structure determination, as described recently for the influenza virus M2 proton channel (8), the human chemokine receptor CXCR1 (9), and the membrane-anchored electron-carrier protein Cytochrome b5 (10). Furthermore, significant progress has been made in incorporating membrane proteins in phospholipid nanodiscs for solution NMR structural studies, as described recently for the bacterial β-barrel outer membrane protein OmpX (11).
Computational methods for NMR protein structure determination are designed to effectively translate NMR observables into 3D structures with minimal deviations between the calculated and the experimental observables (12). However, with few exceptions (e.g., influenza M2 (8)), most NMR structure calculations do not consider explicit protein-solvent or protein-lipid interactions, although the latter has profound effects on membrane protein structure and function (13,14). Including the proper environment in NMR structure determination significantly influences calculations of protein structure and dynamics. For example, it has been shown that a solution NMR-restrained molecular dynamics (MD) simulation protocol, using either a generalized Born implicit solvent model or an explicit solvent water model, yields soluble protein structures with more favorable backbone dihedral angles (14). Furthermore, for the solution NMR structure of an integral membrane signaling complex (DAP12-NKG2C) determined in micelles (15), NMR-restrained MD refinement in explicit micelles and bilayers yields a more favorable and realistic arrangement of a key Asp residue, compared to refinement in vacuum (16). Notably, the results of refinement in these more realistic environments are consistent with mutagenesis studies while still satisfying the NMR observables. These improvements suggest that there could be multiple structures that are degenerate to the NMR observables and the proper environment must be taken into account to extract the conformations likely adopted in the native-like environment.
In the DAP12-NKG2C example, the NMR observables consisted solely of nuclear Overhauser effect (NOE) distance restraints. However, recent methods for NMR structure determination of membrane proteins rely significantly on orientation restraints derived from measurements of chemical shift anisotropy (CSA), dipolar coupling (DC), and residual DC (RDC) signals, as well as on dihedral angle restraints derived from measurements of isotropic chemical shift (CS) frequencies. Such restraints are used increasingly for membrane protein structure determination, where NOE distance measurements are more challenging to obtain. Orientation restraints are particularly valuable in solid-state NMR studies performed in lipid bilayers or bicelles where they provide information about a protein’s 3D structure as well as its orientation with respect to the membrane. Orientation restraints could be equally valuable if measured for samples of proteins in nanodiscs by solution NMR.
In this study, we describe a restrained MD simulation protocol for membrane protein structure calculation and refinement in explicit phospholipid bilayer membranes, which can incorporate a wide range of NMR observables, including CSA, DC, and RDC orientation restraints measured by solid-state NMR and solution NMR. This approach overcomes the limitations associated with NMR structure calculations in the absence of solvent. NMR-restrained MD simulations performed in explicit membranes consider protein-lipid interactions explicitly and thus maximize the information content of experimental NMR restraints measured for membrane-embedded proteins. Furthermore, they can facilitate structure determination and remove ambiguities in cases where only sparse restraints can be measured for side-chain sites. As a first application, we use the membrane-bound form of the major coat protein of bacteriophage Pf1, whose structure was determined recently by combining solid-state NMR and solution NMR orientation and dihedral angle restraints (17). The structure is composed of a N-terminal, amphipathic periplasmic (PP) helix (residues 5–15) that aligns parallel to the lipid bilayer surface, a short linker, and a C-terminal transmembrane (TM) helix (residues 23–45) that adopts a tilt of ∼30° relative to the lipid bilayer normal.
Here, we refine the Pf1 coat protein structure, characterize detailed protein-lipid interactions, and explore its dynamics by performing restrained MD simulations in explicit lipid bilayer membranes using the NMR observables: 15N CSA and 1H-15N DC obtained by solid-state NMR, and 1H-15N RDC obtained by solution NMR. In addition, performing the simulations in explicit membranes allows us to determine the protein’s depth of insertion into the lipid bilayer, which cannot be directly characterized from NMR observables without consideration of explicit protein-lipid interactions. Finally, we consider the validity of pooling structural restraints extracted from different sample types (e.g., bilayers and micelles) for NMR structure determination. The restraints for Pf1 coat protein were measured in two types of samples: lipid bilayers for solid-state NMR and detergent micelles for solution NMR. Highly converged, consistent results obtained by using only the solid-state NMR restraints and excluding the solution NMR RDC restraints from the MD simulations suggest that a hybrid approach, combining restraints from different sample types, is not valid, at least for Pf1 coat protein.
Materials and Methods
Restraint potentials for CSA, DC, and RDC
In this work, we used the solid-state NMR (18) and RDC restraint potentials (19) implemented in CHARMM (20), in which a simple harmonic potential was applied to restrain each NMR property calculated from protein structure at each time step (χcalc) to the experimental value (χexp)
| (1) |
where χ is either 15N CSA, 1H-15N DC, or 1H-15N RDC, Nχ is the number of target experimental observables, and kχ is the force constant; see (18,19) for detailed calculation methods for each NMR property. Note that in the case of 1H-15N RDC, the alignment tensor is a variable and the forces from the alignment tensor are explicitly considered in the RDC restraint potential (19,21).
The total number and types of restraints used in the calculations are listed in Table 1. The solution NMR 1H-15N RDC restraints were derived from two types of samples: Pf1 coat protein in micelles weakly aligned with fd bacteriophage; and Pf1 coat protein in micelles weakly aligned with stressed polyacrylamide gels (17). The optimal force constants in Eq. 1 were empirically determined by testing different sets of values and examining their effects on restraint violations and embedded dynamics. To avoid an overfitting of the protein structure to the experimental data, cross-validation of restraint potentials with different force constants is commonly used (22–24). We used a similar approach and determined an optimal set of force constants for kCSA = 0.01 kcal/(mol·ppm2), kDC = 0.5 kcal/(mol·kHz2), and kRDC = 5.0 kcal/(mol·Hz2).
Table 1.
Restrained MD refinement statistics
| S1/M1 | S1/M2 | S2/M1 | S2/M2 | |
|---|---|---|---|---|
| Number of experimental NMR restraintsa | ||||
| 15N CSA (23 for TM helix; 3 for PP helix) | 26 | 26 | 26 | 26 |
| 1H-15N DC (for TM helix) | 23 | 23 | 23 | 23 |
| 1H-15N RDC phage (25 for TM helix; 18 for PP helix) | 43 | 43 | ||
| 1H-15N RDC gel (23 for TM helix; 17 for PP helix) | 41 | 41 | ||
| Deviation from NMR restraintsb | ||||
| 15N CSA (ppm) | 7.3 ± 1.5 | 6.6 ± 1.3 | 8.2 ± 1.1 | 8.8 ± 1.1 |
| 1H-15N DC (kHz) | 1.0 ± 0.2 | 1.0 ± 0.2 | 1.3 ± 0.2 | 1.3 ± 0.2 |
| 1H-15N RDC phage (Hz) | 1.2 ± 0.1 | 1.2 ± 0.1 | ||
| 1H-15N RDC gel (Hz) | 1.3 ± 0.1 | 1.3 ± 0.1 | ||
| Deviation from NMR structure (Å)c | ||||
| Residues 5–43 | 4.6 ± 1.2 | 4.4 ± 1.0 | 3.7 ± 0.5 | 3.8 ± 0.5 |
| Residues 5–13 (PP helix) | 0.9 ± 0.3 | 0.8 ± 0.1 | 1.1 ± 0.1 | 0.9 ± 0.2 |
| Residues 21–43 (TM helix) | 0.9 ± 0.3 | 1.0 ± 0.1 | 0.9 ± 0.1 | 0.7 ± 0.1 |
CSA and DC restraints were derived from solid-state NMR experiments with Pf1 in lipid bilayers oriented with n||Bo. RDC restraints were derived from solution NMR experiments with Pf1 in micelles weakly aligned with phage or stressed gels.
Evaluated as RMSD.
Evaluated as RMSD for backbone atoms.
Restrained MD simulations in explicit bilayers
To investigate the influence of mixed restraints derived from solid-state NMR and solution NMR experiments, we setup two simulations: simulation S1 using only solid-state NMR (DC, CSA) restraints, and simulation S2 using both solid-state NMR (DC, CSA) and solution NMR (RDC) restraints. In addition, we performed a third simulation S2−RDC, in which we extended the simulation S2 after removing the RDC restraints at 25 ns of S2.
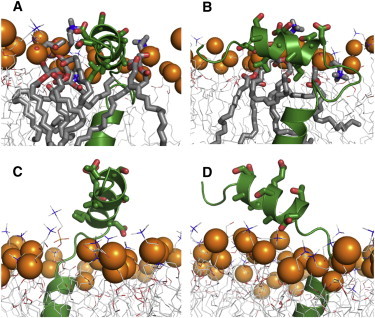
The Membrane Builder module (25,26) in CHARMM-GUI (www.charmm-gui.org) (27) was used to insert the Pf1 coat protein structure (average NMR structure in PDB:2KSJ) (17) into a bilayer composed of a 9:1 mixture of 108 DOPC (di-oleoyl-phosphocholine) molecules and 12 DOPG (di-oleoyl-phosphoglycerol) molecules, consistent with the experimental conditions (17). Furthermore, 0.15 M KCl was used for all simulations. Because NMR observables themselves do not provide direct information about insertion depth in a membrane bilayer, we setup two initial models (M1 and M2) of the protein embedded in lipid bilayers (Fig. 1). In initial model M1, the TM helix was embedded in the bilayer and the PP helix fully solvated by water. In initial model M2, the C-terminus of the TM helix protrudes out of the lipid bilayer (lower leaflet) and the PP helix is embedded in the lipid headgroup region. Initial models M1 and M2 were each used to setup simulations with systems S1 and S2.
Figure 1.
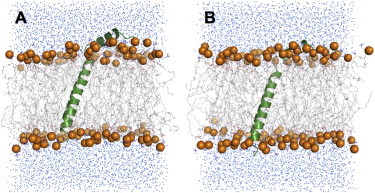
Initial structural models, M1 and M2, used for MD simulations of Pf1 coat protein in explicit lipid bilayers. (A) Model M1 has the TM helix well embedded in the lipid bilayer and the PP helix fully solvated by water. (B) Model M2 has the C-terminus of the TM helix protruding out of the lipid bilayer and the PP helix well embedded in the lipid headgroup region. Water molecules are shown as blue dots, the protein is shown in green, lipid hydrocarbon chains are shown as gray sticks, and lipid headgroup phosphorus atoms as orange spheres. Ions are omitted for clarity.
For each of these four simulations (S1/M1, S1/M2, S2/M1, S2/M2), the system was replicated and assigned with different initial velocities to generate three independent simulation systems, resulting in a total of 12 simulations. All calculations were performed in NPT (constant particle number, pressure, and temperature) ensembles (28) at 303.15 K using CHARMM (20) with the CHARMM all-atom protein force field (29) including the dihedral cross-term correction (30), the CHARMM36 lipid force field (31), and a modified TIP3P water model (32). To consider potential difference in the number of lipid molecules at the top leaflet depending on the location of the PP helix (i.e., M1 or M2), we have used the P21 periodic boundary condition (33) to allow the lipid molecules to move between the top and bottom leaflets of the bilayer during the simulations. A time step of 1 fs was used with the SHAKE algorithm (34). Each initial system was equilibrated for 300 ps with the nonbonded and dynamics options in the Membrane Builder input; the van der Waals interactions were smoothly switched off at 10–12 Å by a force-switching function (35), and the electrostatic interactions were calculated using the particle mesh Ewald method (36) with a mesh size of ∼1 Å for fast Fourier transformation, κ = 0.34 Å−1, and a sixth-order B-spline interpolation. After equilibration, a 40-ns production run was performed for each system. All the results are presented as an average of three independent simulations and the variations are the standard deviations from the average.
Results and Discussion
Validation of restrained simulations
The average root mean-squared deviation (RMSD) between calculated and experimental NMR observables provides a direct measure of restraint violations in the MD-refined structures. The data in Table 1 and Fig. S1 in the Supporting Material show that the MD-refined structures in all four simulations satisfy the NMR observables and have a precision that is comparable to those reported for the structure of membrane-bound Pf1 coat protein determined by NMR and refined with XPLOR-NIH (17). The typical experimental errors for these NMR data are <0.5 Hz for RDCs, 0.3 kHz for DCs, and 5–10 ppm for CSAs.
For the individual TM and PP helices, the average backbone RMSDs from the average NMR structure are around 1 Å in all simulations (Table 1), indicating that these segments of the protein are stable. However, when the entire structure is considered, the RMSDs are >3.5 Å in all simulations, suggesting that the relative orientations of the TM and PP helices are less well defined, potentially due to a flexible linker and/or difficulties in determining a helix-helix orientation using only orientation-dependent NMR observables. Nonetheless, the MD-refined structures in lipid bilayers can provide more information about protein-lipid interactions and protein dynamics (see below).
Depth of membrane insertion
To quantify the protein’s depth of insertion in the lipid bilayer, the membrane insertion depth is defined as the z coordinate of TM center of mass (zTM-COM), with the phospholipid bilayer normal aligned parallel to the z axis and centered at z = 0. Fig. 2 shows the change in zTM-COM with time during the MD simulations. At the start of the simulations, the values of zTM-COM reflect the depth of membrane insertion of the initial models M1 and M2 (Fig. 1); the TM helix of M1 is well embedded in the bilayer hydrophobic core region and has a larger zTM-COM value, whereas the TM helix of M2 is not well embedded and has a smaller zTM-COM value (Fig. 2, A and E). However, within 6 ns of MD, the TM helix of M2 moves toward that of M1 (Fig. 2, B–D, F–H), showing a rapid convergence of TM helix solvation in the membrane environment.
Figure 2.
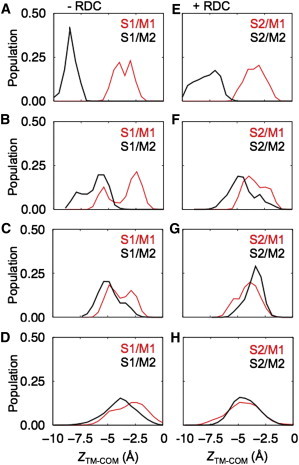
Depth of TM helix membrane insertion. Distribution of the position of the TM helix’s heavy atom center of mass along the membrane normal (i.e., the z axis) obtained at different times of MD simulation for system S1 (A–D) and S2 (E–H) starting from models M1 (red) and M2 (black). Distributions were calculated for MD trajectories of (A, E) 0–0.2 ns, (B, F) 2–3 ns, (C, G) 5–6 ns, and (D, H) 6–40 ns.
Interestingly, a relatively large range (∼8 Å) of TM helix thermal motion along the membrane normal is observed in the last 34-ns MD, reflected as a greater distribution of zTM-COM ranging from ∼0 to −8 Å (Fig. 2, D and H). Even at the limits of this large distribution (−8 Å and 0 Å), only a few TM hydrophobic residues near the membrane interface interact with water molecules occasionally (Fig. 3) because both the protein and the contact lipid molecules can dynamically adjust to each other. This observation emphasizes the fluidity of the membrane and the dynamics of the protein-environment interactions. Instead of statically staying in the membrane, the protein constantly moves together with several proximal lipids within thermally allowed extents, at least for a single-pass TM helix such as Pf1 coat protein.
Figure 3.
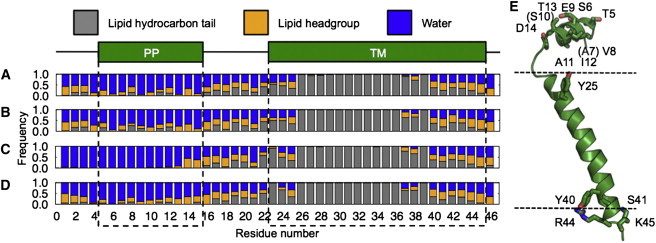
Interactions between residues and solvent. The graph shows the frequency with which each one or more atoms of a specific residue is found within 4 Å of a lipid hydrocarbon site (gray), lipid headgroup site (orange), or water molecule (blue), after MD simulations with system (A) S1/M1, (B) S1/M2, (C) S2/M1, and (D) S2/M2. Data are from the last 10 ns of MD trajectory. The PP and TM helices are designated by green boxes and dashed lines. (E) Residues important for stabilizing TM and PP helix orientations relative to the membrane. Some residues, i.e., A7 and S10, cannot be seen in this side view.
TM helix orientation, dynamics, and lipid interactions
In all MD-refined systems, the TM helix orientations are similar with small fluctuations in terms of the tilt angles with respect to the membrane normal and the rotation angles along its principal axis (Table 2). These orientations are also very similar to those measured from the NMR (PDB:2KSJ) structure.
Table 2.
TM helix orientation calculated from last 10 ns of restrained MD
| S1/M1 | S1/M2 | S2/M1 | S2/M2 | PDB: 2KSJ | |
|---|---|---|---|---|---|
| TM helix tilt (deg)a | 28.2 ± 1.7 | 29.2 ± 1.4 | 29.0 ± 1.3 | 29.4 ± 1.4 | 27.0 ± 1.2 |
| TM helix rotation (deg)b | 188.7 ± 11.9 | 185.5 ± 10.0 | 190.8 ± 8.4 | 190.8 ± 8.6 | 192.1 ± 13.2 |
Defined as the angle between the helix principal axis and the lipid bilayer normal.
Defined as the angle between the perpendicular vector (rs) from the helical axis to G28 Cα atom and the projection vector (zp) of the z axis onto the plane made by the second and third principal axes. The sign of the rotational angle becomes positive if zp × rs is in the opposite direction to the helical axis, or negative otherwise (41).
Solid-state NMR CSA and DC observables provide information about the protein’s orientation in the lipid bilayer. In a recent study with solid-state NMR ensemble dynamics simulations of VpuTM, the TM helix of the HIV viral protein Vpu, the fluctuations in helix orientation are larger in the ensemble dynamics simulations than those determined from single conformer simulations restrained by solid-state NMR data (22,38). With less strict restraints in the former, the variations in helix tilt and rotation increase to 9° and 50° in terms of standard deviations, respectively, similar to the values observed for restraint-free MD simulations. Therefore, the smaller variations observed for Pf1 coat protein in this study (Table 2) are possibly due to the strong influence of the applied solid-state NMR restraints.
All four MD-refined systems display a similar pattern of interactions between the TM helix and the lipid molecules (Fig. 3). In general, the hydrophobic match between the hydrophobic lipid bilayer thickness and the length of the TM domain contributes to the TM helix orientation (39–43). Specifically, there are five polar or charged residues (Y25, Y40, S41, R44, and K45) located at the water-membrane interface of the TM helix, (Fig. 3 E), which interact extensively with the lipids (Table 3) and help stabilize the TM helix orientation and depth of membrane insertion. Indeed, after 10 ns of MD simulation, the TM helix orientation, depth of membrane insertion, and pattern of protein-environment interactions are converged to similar values.
Table 3.
Frequency of interaction between TM helix polar or charged side chains and phospholipid headgroups observed in the last 10 ns of restrained MDa
| S1/M1 | S1/M2 | S2/M1 | S2/M2 | |
|---|---|---|---|---|
| Tyr-25 | 0.91 | 0.92 | 0.89 | 0.93 |
| Tyr-40 | 0.81 | 0.73 | 0.61 | 0.95 |
| Ser-41 | 0.95 | 0.90 | 0.62 | 0.82 |
| Arg-44 | 1.00 | 1.00 | 1.00 | 0.96 |
| Lys-45 | 0.77 | 0.96 | 0.77 | 0.93 |
The interaction occurs when any heavy atom of a particular residue’s side chain is within 4 Å of a lipid headgroup atom.
Periplasmic helix orientation, dynamics, and interactions
Although the TM helix orientations are similar in all systems, the PP helix behaves differently with strong dependence on the types of NMR restraints as well as the starting model used in the MD simulations. Compared to the 10 structures in the NMR ensemble of PDB:2KSJ, which show small variations of the PP helix tilt angle (68° ± 3°), the restrained MD simulations produced structures with larger flexibility (Fig. 4).
Figure 4.
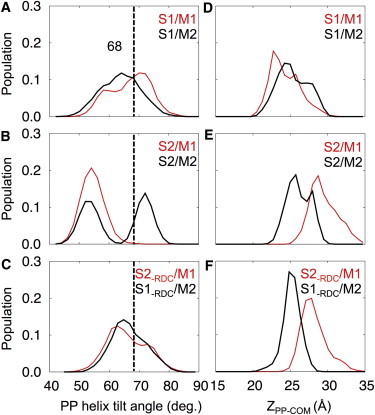
Orientation and depth of membrane insertion of the PP helix. (A–C) Distribution of PP helix tilt angle relative to the membrane normal (i.e., the z axis). (D–F) Distribution of PP heavy atom center of mass position along the z axis. Distributions were calculated from the last 10 ns of MD trajectory for systems S1, S2, and S2-RDC starting with models M1 (red) and M2 (black). The dashed lines mark the average helix tilt angle obtained for the NMR structure (PDB:2KSJ).
In system S1, where simulations were performed using only solid-state NMR restraints, the PP helix tilt angle ranges from 40° to 90° regardless of which initial model, M1 or M2, was used (Fig. 4 A). The average PP helix tilts obtained in these cases are consistent with the 68° tilt obtained for the NMR structures calculated previously. Furthermore, for both M1 and M2 initial models, the PP helix displays a similar pattern of interactions with the membrane lipids (Fig. 3), even though in model M1, the PP helix started out fully solvated by water with little lipid interactions (Fig. 1). This indicates good convergence of the solid-state NMR restrained MD simulations.
In system S2, where simulations were performed using both solid-state NMR restraints and solution NMR RDC restraints, the simulations with starting models M1 and M2 do not converge to a single tilt angle distribution. Instead, each simulation yields a separate helix tilt distribution, as evidenced by the presence of two distinct peaks each associated with either model M1 or M2 (Fig. 4 B). Simulations that were initiated with model M1 converge to a PP helix tilt of 55° with a range of 45° to 65°. By contrast, simulations initiated with model M2 converge to a PP helix tilt of 75° with a range of 65° to 80°. To examine the contribution of the RDC restraints to this bimodal distribution of tilt angles, we removed the RDC restraints from the system S2 at 25 ns, and continued the MD simulations for an additional 10 ns with models M1 and M2 (Fig. 4 C). Within 5 ns of MD simulation with this new system (S2−RDC), the PP helix reoriented toward the membrane and its orientation converged toward the 68° tilt angle observed for simulation S1, regardless of the initial model. After removing the RDC restraints, the population of structures with small PP helix tilt angles (>60°) diminished rapidly.
Therefore, this result in system S2 (Fig. 4 B) may be due to the presence of degenerate orientation solutions possible for RDC restraints, and also indicates the conflicting influences of solution NMR RDC and solid-state NMR CSA restraints on the PP helix orientation. It is important to note that solution NMR and solid-state NMR restraints are measured on samples with dramatically different physical properties. Micelles used in solution NMR experiments are highly dynamic and very different from biological membranes (44). Notably, micelles do not provide a proper membrane-water interface as that found in bilayers. By contrast, lipid bilayers used in solid-state NMR experiments provide an environment that closely matches the physical and chemical properties of biological membranes. Indeed, structures determined in detergent micelles can exhibit notable differences from those determined in lipid bilayers (45).
Overall, the results in Fig. 4 suggest that the simultaneous use of solution NMR and solid-state NMR restraints for membrane structure determination may not be universally valid. Such hybrid approaches are based on the assumption that membrane proteins adopt the same structure in micelles as in bilayers (23). However, for many proteins this is not the case, especially for membrane proteins with membrane-water interfacial domains (45). In the case of Pf1 coat protein, the greater degree of fluctuations associated with the RDC restraints measured in detergent micelles appears to be incompatible with the solid-state NMR restraints measured in phospholipid bilayers, and with the structure of the amphipathic PP helix located at the membrane-water interface.
As shown in Fig. 3, A and B, the structures with large PP helix tilt angles resulting from simulations performed exclusively with solid-state NMR restraints display significantly more extensive interactions of the PP helix with the lipid bilayer. These structures satisfy the amphiphatic character of the PP helix, enabling hydrophobic interactions to occur between lipid molecules and apolar residues (A7, V8, A11, I12), and hydrophilic interactions to occur between water and polar residues (T5, S6, E9, S10, T13, D14) on the opposite side (Fig. 3 E, Fig. 5, A and B). By contrast the structures resulting from MD simulations that include RDC restraints measured from micelle samples show little or no interaction of the PP helix with the membrane surface (Fig. 3, C and D, Fig. 5, C and D); in these cases the result is highly dependent on the starting model and the PP helix remains highly solvated by water.
Figure 5.
Snapshots showing the interactions between Pf1 coat protein PP helix and lipid molecules in (A, B) system S1 and (C, D) system S2. The protein is shown in green. Residues in PP helix are shown as sticks. Lipids are shown as gray lines; those contacting with PP helix are drawn as sticks. Lipid headgroup phosphorus atoms are presented as orange spheres. Water molecules and lipids blocking the views are omitted for clarity.
Conclusions
The results of NMR-restrained MD simulations of Pf1 coat protein in explicit phospholipid bilayer membranes show that it is possible to generate stable MD trajectories using NMR orientation restraints. These restrained simulations provide a powerful refinement tool for membrane protein structure determination by NMR spectroscopy. The NMR restraints are well satisfied and the simulations provide rich structural and dynamics information about the protein embedded in a realistic membrane environment, including: detailed side chain-side chain and side-chain lipid interactions, depth of membrane insertion, and protein dynamics in the context of the experimental restraints. Such detailed information cannot be obtained solely from NMR observables. Thus, the present simulations illustrate the usefulness of the NMR membrane protein structure refinement in explicit membranes.
The results also highlight the importance of performing both the calculations and the experiments in the proper environment. MD simulations performed in explicit lipid bilayers are fully compatible with experimental restraints also measured in lipid bilayers. By contrast, the incorporation of structural restraints measured in a dramatically different setting (such as RDCs measured in detergent micelles) lead to conflicting and ambiguous structural results, which do not converge to a stable structure. This effect is particularly evident for the PP amphipathic helix of Pf1 coat protein. Indeed, the influence of environment is likely to be very important for those structural elements of proteins located at membrane-water interfacial regions, as noted recently for the influenza M2 ion channel (45). Additionally, as reported for paradaxin, even in the bilayers, other membrane components, such as cholesterol, can alter the protein structure (46).
Finally, we have recently shown that solid-state NMR-restrained ensemble dynamics, performed in implicit membrane models, are very effective for rendering the structural and dynamics information that is embedded in solid-state NMR restrains (22,38). In solid-state NMR ensemble dynamics, an ensemble of structures is simulated in parallel MD calculations, and ensemble-averaged solid-state NMR observables across the ensemble, rather than a single individual structure, are restrained to the experimental values. This approach is valid because the observables measured in solid-state NMR experiments are time- and ensemble-averaged properties. Therefore, it will be of particular interest to perform solid-state NMR ensemble dynamics of Pf1 coat protein in explicit bilayers and compare the result with this study.
Acknowledgments
This research was supported by grants from the National Science Foundation (MCB-0918374; MCB-1157677), XSEDE Resources (TG-MCB070009), and the National Institutes of Health (R21 GM094727 and P01AI074805). It utilized the Biotechnology Research Center for NMR Molecular Imaging of Proteins at UCSD (P41 EB002031).
Supporting Material
References
- 1.Kim H.J., Howell S.C., Sanders C.R. Recent advances in the application of solution NMR spectroscopy to multi-span integral membrane proteins. Prog. Nucl. Magn. Reson. Spectrosc. 2009;55:335–360. doi: 10.1016/j.pnmrs.2009.07.002. [DOI] [PMC free article] [PubMed] [Google Scholar]
- 2.Opella S.J., Marassi F.M. Structure determination of membrane proteins by NMR spectroscopy. Chem. Rev. 2004;104:3587–3606. doi: 10.1021/cr0304121. [DOI] [PMC free article] [PubMed] [Google Scholar]
- 3.Tamm L.K., Liang B.Y. NMR of membrane proteins in solution. Prog. Nucl. Mag. Res. Spectrosc. 2006;48:201–210. [Google Scholar]
- 4.Bonvin A.M.J.J., Brünger A.T. Conformational variability of solution nuclear magnetic resonance structures. J. Mol. Biol. 1995;250:80–93. doi: 10.1006/jmbi.1995.0360. [DOI] [PubMed] [Google Scholar]
- 5.Lange O.F., Lakomek N.A., de Groot B.L. Recognition dynamics up to microseconds revealed from an RDC-derived ubiquitin ensemble in solution. Science. 2008;320:1471–1475. doi: 10.1126/science.1157092. [DOI] [PubMed] [Google Scholar]
- 6.Richter B., Gsponer J., Vendruscolo M. The MUMO (minimal under-restraining minimal over-restraining) method for the determination of native state ensembles of proteins. J. Biomol. NMR. 2007;37:117–135. doi: 10.1007/s10858-006-9117-7. [DOI] [PubMed] [Google Scholar]
- 7.Lindorff-Larsen K., Best R.B., Vendruscolo M. Simultaneous determination of protein structure and dynamics. Nature. 2005;433:128–132. doi: 10.1038/nature03199. [DOI] [PubMed] [Google Scholar]
- 8.Sharma M., Yi M.G., Cross T.A. Insight into the mechanism of the influenza A proton channel from a structure in a lipid bilayer. Science. 2010;330:509–512. doi: 10.1126/science.1191750. [DOI] [PMC free article] [PubMed] [Google Scholar]
- 9.Park S.H., Das B.B., Opella S.J. Structure of the chemokine receptor CXCR1 in phospholipid bilayers. Nature. 2012;491:779–783. doi: 10.1038/nature11580. [DOI] [PMC free article] [PubMed] [Google Scholar]
- 10.Dürr U.H.N., Yamamoto K., Ramamoorthy A. Solid-state NMR reveals structural and dynamical properties of a membrane-anchored electron-carrier protein, cytochrome b5. J. Am. Chem. Soc. 2007;129:6670–6671. doi: 10.1021/ja069028m. [DOI] [PMC free article] [PubMed] [Google Scholar]
- 11.Hagn F., Etzkorn M., Wagner G. Optimized phospholipid bilayer nanodiscs facilitate high-resolution structure determination of membrane proteins. J. Am. Chem. Soc. 2013;135:1919–1925. doi: 10.1021/ja310901f. [DOI] [PMC free article] [PubMed] [Google Scholar]
- 12.Schwieters C.D., Kuszewski J.J., Clore G.M. The Xplor-NIH NMR molecular structure determination package. J. Magn. Reson. 2003;160:65–73. doi: 10.1016/s1090-7807(02)00014-9. [DOI] [PubMed] [Google Scholar]
- 13.Dowhan W., Bogdanov M. Lipid-protein interactions as determinants of membrane protein structure and function. Biochem. Soc. Trans. 2011;39:767–774. doi: 10.1042/BST0390767. [DOI] [PMC free article] [PubMed] [Google Scholar]
- 14.Xia B., Tsui V., Wright P.E. Comparison of protein solution structures refined by molecular dynamics simulation in vacuum, with a generalized Born model, and with explicit water. J. Biomol. NMR. 2002;22:317–331. doi: 10.1023/a:1014929925008. [DOI] [PubMed] [Google Scholar]
- 15.Call M.E., Wucherpfennig K.W., Chou J.J. The structural basis for intramembrane assembly of an activating immunoreceptor complex. Nat. Immunol. 2010;11:1023–1029. doi: 10.1038/ni.1943. [DOI] [PMC free article] [PubMed] [Google Scholar]
- 16.Cheng X., Im W. NMR observable-based structure refinement of DAP12-NKG2C activating immunoreceptor complex in explicit membranes. Biophys. J. 2012;102:L27–L29. doi: 10.1016/j.bpj.2012.03.002. [DOI] [PMC free article] [PubMed] [Google Scholar]
- 17.Park S.H., Marassi F.M., Opella S.J. Structure and dynamics of the membrane-bound form of Pf1 coat protein: implications of structural rearrangement for virus assembly. Biophys. J. 2010;99:1465–1474. doi: 10.1016/j.bpj.2010.06.009. [DOI] [PMC free article] [PubMed] [Google Scholar]
- 18.Lee J., Chen J., Im W. Application of solid-state NMR restraint potentials in membrane protein modeling. J. Magn. Reson. 2008;193:68–76. doi: 10.1016/j.jmr.2008.04.023. [DOI] [PMC free article] [PubMed] [Google Scholar]
- 19.Rathinavelan T., Im W. Explicit treatment of force contribution from alignment tensor using overdetermined linear equations and its application in NMR structure determination. J. Comput. Chem. 2007;28:1858–1864. doi: 10.1002/jcc.20712. [DOI] [PubMed] [Google Scholar]
- 20.Brooks B.R., Brooks C.L., III, Karplus M. CHARMM: the biomolecular simulation program. J. Comput. Chem. 2009;30:1545–1614. doi: 10.1002/jcc.21287. [DOI] [PMC free article] [PubMed] [Google Scholar]
- 21.Rathinavelan T., Im W. A novel strategy to determine protein structures using exclusively residual dipolar coupling. J. Comput. Chem. 2008;29:1640–1649. doi: 10.1002/jcc.20923. [DOI] [PubMed] [Google Scholar]
- 22.Jo S., Im W. Transmembrane helix orientation and dynamics: insights from ensemble dynamics with solid-state NMR observables. Biophys. J. 2011;100:2913–2921. doi: 10.1016/j.bpj.2011.05.009. [DOI] [PMC free article] [PubMed] [Google Scholar]
- 23.Shi L., Traaseth N.J., Veglia G. A refinement protocol to determine structure, topology, and depth of insertion of membrane proteins using hybrid solution and solid-state NMR restraints. J. Biomol. NMR. 2009;44:195–205. doi: 10.1007/s10858-009-9328-9. [DOI] [PMC free article] [PubMed] [Google Scholar]
- 24.Tian Y., Schwieters C.D., Marassi F.M. AssignFit: a program for simultaneous assignment and structure refinement from solid-state NMR spectra. J. Magn. Reson. 2012;214:42–50. doi: 10.1016/j.jmr.2011.10.002. [DOI] [PMC free article] [PubMed] [Google Scholar]
- 25.Jo S., Kim T., Im W. Automated builder and database of protein/membrane complexes for molecular dynamics simulations. PLoS ONE. 2007;2:e880. doi: 10.1371/journal.pone.0000880. [DOI] [PMC free article] [PubMed] [Google Scholar]
- 26.Jo S., Lim J.B., Im W. CHARMM-GUI Membrane Builder for mixed bilayers and its application to yeast membranes. Biophys. J. 2009;97:50–58. doi: 10.1016/j.bpj.2009.04.013. [DOI] [PMC free article] [PubMed] [Google Scholar]
- 27.Jo S., Kim T., Im W. CHARMM-GUI: a web-based graphical user interface for CHARMM. J. Comput. Chem. 2008;29:1859–1865. doi: 10.1002/jcc.20945. [DOI] [PubMed] [Google Scholar]
- 28.Feller S.E., Zhang Y.H., Pastor R.W. Computer-simulation of liquid/liquid interfaces. 2. Surface-tension area dependence of a bilayer and monolayer. J. Chem. Phys. 1995;103:10267–10276. [Google Scholar]
- 29.MacKerell A.D., Bashford D., Karplus M. All-atom empirical potential for molecular modeling and dynamics studies of proteins. J. Phys. Chem. B. 1998;102:3586–3616. doi: 10.1021/jp973084f. [DOI] [PubMed] [Google Scholar]
- 30.Mackerell A.D., Jr., Feig M., Brooks C.L., III Extending the treatment of backbone energetics in protein force fields: limitations of gas-phase quantum mechanics in reproducing protein conformational distributions in molecular dynamics simulations. J. Comput. Chem. 2004;25:1400–1415. doi: 10.1002/jcc.20065. [DOI] [PubMed] [Google Scholar]
- 31.Klauda J.B., Venable R.M., Pastor R.W. Update of the CHARMM all-atom additive force field for lipids: validation on six lipid types. J. Phys. Chem. B. 2010;114:7830–7843. doi: 10.1021/jp101759q. [DOI] [PMC free article] [PubMed] [Google Scholar]
- 32.Jorgensen W.L., Chandrasekhar J., Klein M.L. Comparison of simple potential functions for simulating liquid water. J. Chem. Phys. 1983;79:926–935. [Google Scholar]
- 33.Dolan E.A., Venable R.M., Brooks B.R. Simulations of membranes and other interfacial systems using P2(1) and Pc periodic boundary conditions. Biophys. J. 2002;82:2317–2325. doi: 10.1016/S0006-3495(02)75577-X. [DOI] [PMC free article] [PubMed] [Google Scholar]
- 34.Ryckaert J.P., Ciccotti G., Berendsen H.J.C. Numerical-integration of Cartesian equations of motion of a system with constraints - molecular-dynamics of N-alkanes. J. Comput. Phys. 1977;23:327–341. [Google Scholar]
- 35.Steinbach P.J., Brooks B.R. New spherical-cutoff methods for long-range forces in macromolecular simulation. J. Comput. Chem. 1994;15:667–683. [Google Scholar]
- 36.Essmann U., Perera L., Pedersen L.G. A smooth particle mesh Ewald method. J. Chem. Phys. 1995;103:8577–8593. [Google Scholar]
- 37.Reference deleted in proof.
- 38.Im W., Jo S., Kim T. An ensemble dynamics approach to decipher solid-state NMR observables of membrane proteins. Biochim. Biophys. Acta. 2012;1818:252–262. doi: 10.1016/j.bbamem.2011.07.048. [DOI] [PubMed] [Google Scholar]
- 39.Kandasamy S.K., Lee D.K., Ramamoorthy A. Solid-state NMR and molecular dynamics simulations reveal the oligomeric ion-channels of TM2-GABA(A) stabilized by intermolecular hydrogen bonding. Biochim. Biophys. Acta. 2009;1788:686–695. doi: 10.1016/j.bbamem.2008.11.009. [DOI] [PubMed] [Google Scholar]
- 40.Ramamoorthy A., Kandasamy S.K., Larson R.G. Structure, topology, and tilt of cell-signaling peptides containing nuclear localization sequences in membrane bilayers determined by solid-state NMR and molecular dynamics simulation studies. Biochemistry. 2007;46:965–975. doi: 10.1021/bi061895g. [DOI] [PMC free article] [PubMed] [Google Scholar]
- 41.Kim T., Im W. Revisiting hydrophobic mismatch with free energy simulation studies of transmembrane helix tilt and rotation. Biophys. J. 2010;99:175–183. doi: 10.1016/j.bpj.2010.04.015. [DOI] [PMC free article] [PubMed] [Google Scholar]
- 42.Kim T., Lee K.I., Im W. Influence of hydrophobic mismatch on structures and dynamics of gramicidin a and lipid bilayers. Biophys. J. 2012;102:1551–1560. doi: 10.1016/j.bpj.2012.03.014. [DOI] [PMC free article] [PubMed] [Google Scholar]
- 43.Rui H., Lee J., Im W. Comparative molecular dynamics simulation studies of protegrin-1 monomer and dimer in two different lipid bilayers. Biophys. J. 2009;97:787–795. doi: 10.1016/j.bpj.2009.05.029. [DOI] [PMC free article] [PubMed] [Google Scholar]
- 44.Bond P.J., Sansom M.S.P. Membrane protein dynamics versus environment: simulations of OmpA in a micelle and in a bilayer. J. Mol. Biol. 2003;329:1035–1053. doi: 10.1016/s0022-2836(03)00408-x. [DOI] [PubMed] [Google Scholar]
- 45.Cross T.A., Sharma M., Zhou H.X. Influence of solubilizing environments on membrane protein structures. Trends Biochem. Sci. 2011;36:117–125. doi: 10.1016/j.tibs.2010.07.005. [DOI] [PMC free article] [PubMed] [Google Scholar]
- 46.Ramamoorthy A., Lee D.K., Nanga R.P. Cholesterol reduces pardaxin’s dynamics-a barrel-stave mechanism of membrane disruption investigated by solid-state NMR. Biochim. Biophys. Acta. 2010;1798:223–227. doi: 10.1016/j.bbamem.2009.08.012. [DOI] [PMC free article] [PubMed] [Google Scholar]
Associated Data
This section collects any data citations, data availability statements, or supplementary materials included in this article.