

Abstract
Although there is increasing evidence that genetic factors influence gestational age, it is unclear to what extent this is due to fetal and/or maternal genes. In this study, we apply a novel analytical model to estimate genetic and environmental contributions to pregnancy history records obtained from 165,952 Swedish families consisting of offspring of twins, full siblings, and half-siblings (1987–2008). Results indicated that fetal genetic factors explained 13.1% (95% confidence interval (CI): 6.8, 19.4) of the variation in gestational age at delivery, while maternal genetic factors accounted for 20.6% (95% CI: 18.1, 23.2). The largest contribution to differences in the timing of birth were environmental factors, of which 10.1% (95% CI: 7.0, 13.2) was due to factors shared by births of the same mother, and 56.2% (95% CI: 53.0, 59.4) was pregnancy specific. Similar models fit to the same data dichotomized at clinically meaningful thresholds (e.g., preterm birth) resulted in less stable parameter estimates, but the collective results supported a model of homogeneous genetic and environmental effects across the range of gestational age. Since environmental factors explained most differences in the timing of birth, genetic studies may benefit from understanding the specific effect of fetal and maternal genes in the context of these yet-unidentified factors.
Keywords: environment, fetal genes, gestational age, maternal genes, preterm birth, twins
High rates of preterm birth remain a significant health problem in developed countries and are a major cause of perinatal mortality and morbidity. Prematurity has been associated with a wide range of negative outcomes early in life (e.g., respiratory sequelae (1), neurological disability (2), and impaired development (3, 4)) through adulthood (e.g., hypertension (5), alcohol abuse (6), and cardiovascular health (7)), which positions preterm birth as a pivotal event in life-course models of disease. While salient risks for preterm birth have been identified, its etiology is not well understood; it is expected to involve multiple genes, environmental exposures, age-dependent risks, and complex interactions among these factors (8–10).
Studies have shown that the risk of preterm birth is higher in women born prematurely (11, 12), and mothers who have had a previous preterm birth are more likely to do so on subsequent deliveries (13). The tendency for gestational age to correlate among family members may be due to shared genetic factors, shared environmental factors, or both. Studies to date have estimated that nongenetic factors account for 7%–18% of trait covariance (14–16). Yet, ambiguity remains about the relative importance of fetal and maternal genetic contributions. This uncertainty has significant consequences with respect to the design of research studies and the development of predictive tests and therapeutic interventions against preterm delivery. Results from large epidemiologic studies examining Scandinavian and European-American births suggest a maternal genetic contribution to the timing of birth (11, 16, 17), while other studies have provided evidence for fetal genetic factors in addition to the effects of maternal genes (14, 15, 18).
Variation in estimates of the fetal genetic contribution could be due, at least partly, to differences in the underlying genetic model used across studies. Traits focused on clinical outcomes, such as preterm birth, are conceived as the presence or absence of disease, and genetic characters are typically mapped on such complex outcomes assuming a threshold model based on an underlying normal distribution of liability (19, 20). If this assumption is correct, then it is advantageous to use continuous, normally distributed variables whenever there is a choice due to the substantial increase in statistical power (21), such as preferring the use of gestational age to a measure of prematurity (which is a dichotomization of gestational age into <37 weeks). In contrast, if the assumption based on an underlying normal distribution of liability is incorrect, then the genetic model underlying the use of preterm birth as the outcome variable should be stated and justified. For instance, a genetic model of preterm birth might suppose that genetic effects were not uniform across the range of gestational age but were heterogeneous at short gestational ages (due to multiple possible causes of preterm birth). Clarifying the mode of genetic risk will refine our understanding of normal and pathological processes underlying parturition and could lead to innovative approaches to reduce the incidence of preterm birth.
In this study, we apply a novel quantitative genetic approach for pregnancy outcomes to estimate genetic and environmental parameters from 165,952 Swedish families, consisting of the offspring of twins, full siblings and half-siblings. The covariance patterns from these sets of relatives (which differ in their degree of relationship) allow for the separation of variance components that describe the overall sample variation in gestational age—fetal genetic, maternal genetic, shared familial environment, and pregnancy-specific environmental factors. To investigate why parameter estimates might differ between previously reported studies and to gain insight on possible alternative models of gene action, we explore the relationship of genetic and environmental parameter estimates derived from models using both continuous and a range of dichotomized outcomes.
MATERIALS AND METHODS
Ethics statement
This study was approved by the local institutional review board (Virginia Commonwealth University Institutional Review Board No. 11443).
Study sample
Pregnancy histories for births in Sweden have been collected prospectively since 1973 as part of the Medical Birth Register and include information on demographics, reproductive history, and complications during pregnancy, delivery, and the neonatal period (16). A sample was obtained for this study by linking the Swedish Multigenerational Register with the Medical Birth Register using the unique national registration number. Genetically informative families were created by identifying sets of sibships related through twin pairs, full siblings, or half-siblings (Figure 1) (Web Figure 1 available at http://aje.oxfordjournals.org/). Birth records from 1987 to 2008 were selected to maintain continuity of covariate measurements across medical record coding indices, which resulted in an initial data linkage of 283,650 births.
Figure 1.

Genetically informative family structures were created by linking full sibships into cousinships by the relationships specified in Table 1. The dashed box indicates the location of the relationship that links sibships in the pedigree. It is this relationship that determines the expected cousin correlation  as specified in Table 1. The sibling correlation,
  , remains the same for all family structures. As an example, this pedigree shows how 2 full sibships are joined into a cousinship by a pair of female monozygotic twins (dashed box). For this family structure, the expected correlation between cousins is
 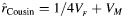 , and the expected correlation between siblings is
 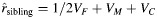 , as indicated in Table 1.
Measures
Gestational age assessed by ultrasound in the second trimester or from the date of the last menstrual period was used as the main outcome measure and was recorded in days. In Sweden, 95% of pregnant women elect to have a routine ultrasound screening (22), and it has been shown that gestational age is accurately recorded in the Medical Birth Register (23). Exclusion criteria included multifetal pregnancies, any congenital anomalies, Rh sensitization, placental abruption, placenta previa, hydramnios/oligohydramnios, complications of preeclampsia, eclampsia, and gestational hypertension. Preterm births earlier than 210 days (the 0.00012 quantile) were excluded to mitigate the effect of extreme values that may be associated with etiological factors associated with other pathological conditions. Covariates were selected on the basis of previous evidence of association with preterm birth and included the following: maternal/paternal age and education measured at the time of birth, birth order, fetal sex, and smoking status at the time of prenatal registration. The offspring of twins, full siblings, and half-siblings were limited to the first 4 reported births to balance gains in information with computational time.
Children of twins and siblings design
The underlying factors contributing to the variation in preterm birth can be described as a weighted linear combination of variance components corresponding to fetal genetic (VF), maternal genetic (VM), shared familial environment (VC), and pregnancy-specific environment (VE) sources. Thus, total trait variance (VT) can be expressed as VT = VF + VM + VC + VE. The VE term contributes to differences in both the timing of birth and measurement error. The relative importance of each variance component can be expressed as a proportion of total trait variance, for example, in the case of fetal genetic factors, as VF/VT. In the present study, the information necessary to estimate the contribution of the 4 variance components is contained in the covariances of sibships and of “cousinships” of differing biological relatedness. Comparison of the observed covariance patterns with those based on expectations from biometrical theory allows for formal tests of hypotheses regarding whether terms significantly contribute to covariance patterns. As an example, an estimate of maternal genetic factors can be calculated as twice the difference between dizygotic female twins and cousins related through brothers, since dizygotic female offspring share one-eighth of their genes and would share one-half maternal genetic factors (VM = 2((⅛ VF + ½ VM) − ⅛ VF)).
Statistical analysis
We used structural equation modeling techniques to simultaneously decompose the gestational age covariance matrix with widely available software implementing maximum likelihood estimation techniques (24). Further details of quantitative genetic analysis applied to pregnancy outcomes can be found in York et al. (15, 18), and more general introductions can be found elsewhere (20, 25, 26). Expected covariances from pregnancies of twins, full siblings, and half-siblings were derived from the contributions of genetic and environmental variance components and are listed in Table 1. The familial environment in maternal and paternal half-siblings was permitted to differ from that of full siblings to allow for a test of heterogeneity between sibling types. Major assumptions of the model included random mating, additive and constant genetic effects over pregnancies, fetal and maternal genetic effects independent and equal for male and female fetuses, no interactions between variance components, and no cultural transmission.
Table 1.
Expected Covariance of Gestational Age for Births in Cousinships Expressed as Variance Components in a Population Sample of Swedish Families, 1987–2008
| Relationship Joining Full Sibshipsa | No. of Families | No. of Births | Expected Covariance | Observed Correlation | 95% CI |
|---|---|---|---|---|---|
| Female-female | 26,468 | 43,907 | ⅛VF + ½VM | 0.1154 | 0.1015, 0.1292 |
| Male-male | 26,922 | 43,685 | ⅛VF | 0.0195 | 0.0056, 0.0372 |
| Female-male | 27,084 | 43,595 | ⅛VF | 0.0171 | 0.0037, 0.0336 |
| Maternal half-sibshipb | 36,600 | 44,489 | ¼VF + VM + h VC | 0.2579 | 0.2439, 0.2717 |
| Paternal half-sibship | 33,536 | 42,830 | ¼VF + dVC | 0.0391 | 0.0258, 0.0528 |
| Monozygotic male twins | 2,208 | 3,744 | ¼VF | −0.0054 | −0.0537, 0.0435 |
| Monozygotic female twins | 2,962 | 5,009 | ¼VF + VM | 0.2516 | 0.2128, 0.2908 |
| Dizygotic male twins | 2,158 | 3,622 | ⅛VF | 0.0481 | 0.0004, 0.0949 |
| Dizygotic female twins | 2,506 | 4,211 | ⅛VF + ½VM | 0.1162 | 0.0678, 0.1668 |
| Dizygotic male-female twins | 5,508 | 8,964 | ⅛VF | 0.0242 | −0.0063, 0.0554 |
| Total full sibshipsc | 165,952 | 244,056 | ½VF + VM + VC | 0.3724 | 0.3655, 0.3796 |
Abbreviations: CI, confidence interval; VC, shared familial environment; VF, fetal genetic; VM, maternal genetic.
a Indicates the number of full sibships and births that are connected by the specified relationship.
b Additional parameters allow for differences in maternal (h) or paternal (d) half-sibling environment.
c Total number of full sibships and births across all relationships. Expected covariance is between full siblings. The numbers of families and births reported are after data screening.
The contribution of individual genetic and environmental parameters to the covariance of gestational age was assessed by dropping each in turn from the model and registering the decline in the fit of submodels by the likelihood ratio χ2 test and change in the Akaike Information Criterion (AIC). Confidence intervals were obtained from 1,000 iteration bootstrap estimates by random sampling of families with replacement. Final model selection was based on a balance between goodness-of-fit and parsimony.
RESULTS
The prevalence of preterm birth in singleton pregnancies was 4.5% as obtained from the initial data linking of the Swedish Multigenerational Register with the Medical Birth Register. This rate is similar to those rates of other studies of preterm birth using Scandinavian samples (11, 16, 17). After screening criteria were considered, the sample used for statistical modeling consisted of 244,056 births from 165,952 families (Table 1). The maximum likelihood estimates of the mean gestational age and variance were  days (39.93 weeks) and
  days, respectively. Table 2 reports characteristics of the data stratified by birth order. Although individual tests of covariates were all significantly associated with gestational age (P < 0.005), they accounted for a minimal reduction in sample variance
  . Covariates are incorporated into the current modeling framework in the portion of the model characterizing the expected mean, and the raw data log-likelihood function is computed for every vector of observations (24). Thus, missing covariate values would result in row-wise deletion and, in this case, remove the entire cousinship from the analysis. Because of missing values, inclusion of covariates resulted in the omission of 25,615 births or approximately 10% of the sample. This could result in biased parameter estimates if the probability of being missing is correlated with the values of the variable itself. Although it was reasonable to assume that missing covariate measures were indeed missing at random, we did not include covariates in initial estimations of genetic and environmental parameters to avoid any potential sources of bias and to maintain the full sample size.
Table 2.
Data Characteristics Stratified by Birth Order in a Population Sample of Swedish Families, 1987–2008
| First Birth (n = 150,133) |
Second Birth (n = 76,179) |
Third Birth (n = 15,592) |
Fourth Birth (n = 2,152) |
|||||
|---|---|---|---|---|---|---|---|---|
| Mean (SD) | % | Mean (SD) | % | Mean (SD) | % | Mean (SD) | % | |
| Gestational age, days | 279.6 (10.8) | 279.5 (9.6) | 279.6 (9.7) | 278.7 (10.2) | ||||
| Maternal age at birth, years | 27.9 (5.3) | 29.7 (4.6) | 31.7 (4.3) | 33.5 (4.4) | ||||
| Paternal age at birth, years | 31.0 (6.1) | 32.7 (5.4) | 34.8 (5.1) | 36.9 (5.3) | ||||
| Female fetal sex | 51.1 | 51.0 | 50.8 | 49.4 | ||||
| Maternal smoking | ||||||||
| Yes | 5.8 | 4.8 | 5.9 | 9.1 | ||||
| No | 31.6 | 40.1 | 46.6 | 52.0 | ||||
| Missing | 62.6 | 55.1 | 47.5 | 38.9 | ||||
| Maternal education | ||||||||
| ≤9 years compulsory | 15.9 | 11.1 | 11.6 | 16.7 | ||||
| Upper secondary | 53.3 | 53.5 | 51.0 | 50.7 | ||||
| Postsecondary or greater | 29.6 | 34.9 | 36.9 | 32.1 | ||||
| Missing | 1.1 | 0.4 | 0.5 | 0.5 | ||||
| Paternal education | ||||||||
| ≤9 years compulsory | 17.1 | 13.7 | 14.4 | 17.0 | ||||
| Upper secondary | 55.3 | 54.4 | 52.3 | 56.2 | ||||
| Postsecondary or greater | 26.5 | 31.2 | 32.7 | 26.2 | ||||
| Missing | 1.1 | 0.7 | 0.6 | 0.7 | ||||
Abbreviation: SD, standard deviation.
Maximum likelihood estimates of correlations between cousins for each relationship type were consistent with both genetic (fetal and maternal) and familial environmental factors being responsible for similarities in gestational age among relatives (Table 1). A series of models were tested to estimate the genetic and environmental effects on gestational age. The first model allowed for the contribution of fetal genetic (VF), maternal genetic (VM), familial environment (VC), and pregnancy-specific environmental (VE) effects (AICModel 1 = 209343.2). This model also permitted the effect of the familial environment to differ for both maternal and paternal half-siblings. The results of model 2 indicated a significant decrease in model fit compared with Model 1 with the removal of the half-sibling environmental parameters (AICModel 2 = 209448.8; χ2 = 109.69, 2 df; P < 0.001). Models 3–5, submodels of the first model, removed the fetal genetic, maternal genetic, and familial environmental parameters, respectively, that contribute to covariance patterns among the specified relationships in Table 1 (AICModel 3 = 209355.9; χ2 = 14.8, 1 df; AICModel 4 = 209599.8; χ2 = 258.7, 1 df; AICModel 5 = 209453.5; χ2 = 116.3, 1 df). Results indicated that the omission of any of these parameters resulted in a significant decrease of model fit (P < 0.001 for each model). Considering these results and that the AIC was substantially lower for the full genetic model (Model 1), the data supported a significant contribution of both fetal and maternal genes and the family environment to covariance in gestational age.
Results from Model 1 estimated that fetal genetic sources accounted for 13.1% (95% CI: 6.8, 19.4) of variance in gestational age, 20.6% (95% CI: 18.1, 23.2) was due to maternal genetic effects, 10.1% (95% CI: 7.0, 13.2) to familial environment, and 56.2% (95% CI: 53.0, 59.4) was due to the pregnancy-specific environment (Table 3). All tests of genetic and environmental parameters were similar with the inclusion of covariates, with the omission of pregnancies delivered by cesarean section before the onset of labor and induced vaginal onset (Table 3) and after including births <210 days. These estimates also resembled those derived from the dichotomization of gestational age near the middle of the distribution at 39, 40, or 41 weeks (Table 4). Outside of this range, parameter estimates started to drift. Confidence intervals increased and began to encompass negative values primarily for the fetal genetic and the family environmental variance components. Of particular interest was the considerable degree to which the distributions of the fetal genetic variance component overlapped for thresholds at the ends of the gestational age continuum. For example, at 36 and 42 weeks (where the prevalence for each was at least 1%), we found no support for a difference in the mean fetal genetic parameter estimates obtained from bootstrap samples (µDIFF = −0.619, 95% CI: −1.420, 0.031). There was also very little correspondence between parameter estimates over the range of thresholds used, although each condition was based on the identical data set (Web Figure 2, A and B). Changes in parameter estimates and the widening of confidence intervals for different thresholds were likely a consequence of the increase in the standard error of variance components estimated from thresholds in the tails of the distribution versus those from the middle (Figure 2). We performed a small-scale simulation study to confirm that these patterns were consistent with an increase in the error variance of parameter estimates associated with moving the threshold further into the tails of the distribution (Web Figure 2C).
Table 3.
Contribution of Variance Components to Gestational Age With Empirically Derived 95% Bootstrap Confidence Intervals in a Population Sample of Swedish Families, 1987–2008
| Variance Component | Unadjusted for Covariates |
Adjusted for Covariatesa |
Spontaneous Onset Birthsb |
|||
|---|---|---|---|---|---|---|
| Total Explained Variation, % | 95% CI | Total Explained Variation, % | 95% CI | Total Explained Variation, % | 95% CI | |
| Fetal genetic | 13.1 | 6.8, 19.4 | 13.8 | 6.9, 19.9 | 12.7 | 6.8, 18.1 |
| Maternal genetic | 20.6 | 18.1, 23.2 | 19.9 | 17.0, 13.6 | 22.8 | 20.5, 25.3 |
| Familial environment | 10.1 | 7.0, 13.2 | 10.7 | 7.7, 13.6 | 9.9 | 7.4, 12.7 |
| Unique environment | 56.2 | 53.0, 59.4 | 56.2 | 52.9, 59.8 | 55.9 | 53.1, 59.1 |
Abbreviation: CI, confidence interval.
a Covariates included maternal/paternal age and education measured at the time of birth, birth order, fetal sex, and smoking status at the time of prenatal registration.
b Births were removed if classified as induced vaginal onset and cesarean delivery before the onset of labor.
Table 4.
Estimates of Genetic and Environmental Variance Components by Creating a Dichotomous Variable at the Specified Thresholds Across the Range of Gestational Age in a Population Sample of Swedish Families, 1987–2008
| Threshold, weeks | Prevalence, % | Fetal Genetic |
Maternal Genetic |
Family Environment |
Pregnancy-specific Environment |
||||
|---|---|---|---|---|---|---|---|---|---|
| Mean | 95% CI | Mean | 95% CI | Mean | 95% CI | Mean | 95% CI | ||
| <35 | 0.7 | −0.602 | −2.335, 0.371 | 0.538 | 0.076, 1.031 | 0.163 | −0.191, 0.775 | 0.900 | 0.379, 1.723 |
| <36 | 1.6 | −0.468 | −1.252, 0.127 | 0.459 | 0.220, 0.701 | 0.184 | −0.042, 0.432 | 0.825 | 0.519, 1.207 |
| <37 | 3.4 | −0.349 | −0.744, 0.059 | 0.383 | 0.231, 0.513 | 0.219 | 0.086, 0.358 | 0.747 | 0.541, 0.941 |
| <38 | 4.8 | −0.148 | −0.467, 0.122 | 0.298 | 0.192, 0.405 | 0.214 | 0.105, 0.323 | 0.636 | 0.495, 0.800 |
| <39 | 21.2 | 0.193 | 0.068, 0.322 | 0.195 | 0.147, 0.245 | 0.118 | 0.066, 0.166 | 0.494 | 0.425, 0.561 |
| <40 | 45.1 | 0.146 | 0.049, 0.243 | 0.206 | 0.168, 0.245 | 0.112 | 0.073, 0.153 | 0.536 | 0.486, 0.585 |
| >41 | 25.4 | 0.196 | 0.088, 0.314 | 0.184 | 0.138, 0.230 | 0.092 | 0.044, 0.137 | 0.528 | 0.469, 0.586 |
| >42 | 6.7 | 0.151 | −0.071, 0.353 | 0.238 | 0.163, 0.313 | 0.036 | −0.043, 0.124 | 0.575 | 0.467, 0.684 |
| >43 | 0.6 | 0.535 | −0.337, 1.485 | 0.202 | −0.212, 0.443 | −0.272 | −0.527, 0.129 | 0.536 | 0.030, 0.952 |
Abbreviation: CI, confidence interval.
Figure 2.

Standard error of variance components estimated by dichotomizing gestational age at the specified threshold in a population sample of 165,952 families in Sweden, 1987–2008. For example, at 37 weeks, the standard error of VF is 3.9 times higher than at the near-optimal cutpoint at 40 weeks. Variance component parameters are VF, fetal genetic; VM, maternal genetic; VC, family environment; and VE, pregnancy-specific environment.
DISCUSSION
Gestational age versus preterm birth
We estimated the degree to which genetic and environmental parameters contributed to differences in gestational age in a large Swedish twin and sibling study. Fetal genes were responsible for 13.1% of explained variance, and the maternal genetic component accounted for an additional 20.6%. Environmental factors that create similarities among siblings accounted for 10.1% of variation, while the largest proportion (56.2%) were those that contributed to differences among successive births of the same mother. We found that estimates varied widely if gestational age was transformed into a dichotomous outcome, as was also observed in our simulation study. Furthermore, the precision of the variance component estimates declined as a function of prevalence, and this likely set an upper limit to the correlations between the repeated variance component estimates across different thresholds. Support for a single underlying risk liability was suggested from the fact that variance component estimates obtained from the continuous variable were most similar at the optimal cutpoint near the median split (i.e., 39–41 weeks), and that the bootstrap estimates consistently correlated with those derived from the dichotomous outcomes (Web Appendix). Furthermore, overlapping confidence intervals between estimates derived from dichotomization conditions at either end of the gestational age continuum argue against a model of different contributions of the variance components at different thresholds.
Comparison with existing studies
Not surprisingly, our findings of significant fetal genetic influences are most consistent with those previous studies that also utilized gestational age as the outcome variable. Lunde et al. (14) estimated a fetal genetic effect of 11.3% from over 90,000 families in the Medical Birth Registry of Norway. Similarly, a study of gestational age in a European-American sample of approximately 300,000 families from Virginia estimated that fetal genes generate 35.0% of variation in gestational age (15).
In the current study, maternal genetic factors accounted for 20.6% of variation in gestational age, which is only slightly larger than the estimates of Lunde et al. (14) and York et al. (15), of 14.2% and 13.4%, respectively. Other studies of large population samples of Scandinavian origin, which dichotomized gestational age at 37 weeks (e.g., preterm birth), also provided support for the contribution of maternal genetic factors (11, 16, 17). Svensson et al. (16) decomposed the covariance of preterm birth from the offspring of Swedish sibling pairs and found that 25.0% of variance in preterm birth could be explained by maternal genetic factors, similar to the present study, while only a marginal influence was seen for fetal genes. Although data for the current study were obtained from the same medical birth registry as those of Svensson et al., the potential concern of overlapping data was minimized because we included 7 additional types of genetically informative families, sibships that were up to twice as large and included an extended range of birth years. Two other studies (11, 17) provided estimates of genetic influence by calculating risk ratios for selected familial relationships that suggest mostly maternal genetic influences but do not provide robust evidence against the influence of fetal genes.
Molecular findings’ support of a fetal genetic contribution
Currently, the role of fetal genes in the molecular pathophysiology of preterm birth is unclear. To date, while not all studies have confirmed their influence, there is increasing support from epidemiologic and molecular research. Ehlers-Danlos syndrome provides 1 model for the influence of fetal genes on the timing of birth. Studies show that there is increased risk for early birth when the fetus, but not the mother, is affected with this rare disorder (27–29). Preterm premature rupture of membranes has been shown to precede labor in affected fetuses and is thus understood as a fetal connective tissue problem with mutations identified in the collagen, type V, α 1 gene (COL5A1) and the α 2 gene (COL5A2) (30). Thus, it is possible that there exists genetic variation in the structural integrity of fetal tissues, placental development, and the production of and response to corticotropin-releasing hormone (CRH), all of which have been shown to be associated with the timing of human birth (31). The control of parturition via a “placental clock” is a hypothesis based on the proposed role of placental CRH production. A rise in placental CRH precedes parturition both preterm and at term (32). However, there is no evidence that genetic variation in the CRH gene is associated with the timing of birth. Of course, variation in other genes affecting CRH expression might contribute, but this is speculative at this juncture. A recent study supports a fetal genetic contribution that combined results from a genome-wide linkage analysis of Finnish families along with confirmation in an independent case-control sample to demonstrate an association between spontaneous preterm birth and the fetal insulin-like growth factor 1 receptor genotype (IGF1R) (33).
Findings from other candidate gene association studies are consistent with contributions of both fetal and maternal genetic factors to preterm birth risk. A review by Crider et al. (34) of 8 genetic association studies where both fetal and maternal samples were genotyped suggested that neither genetic source predominates. Being so, the correlation between fetal and maternal genotypes makes interpretation of association findings difficult to ascribe to either source unless both the mother and the infant are genotyped (35). A number of statistical approaches have been developed to account for the fetal genotype and the correlated maternal genotype to address such confounding (36–38). In our components of variance model for correlations between relatives, additive genetic covariance between maternal and fetal genotypes would be confounded with estimates of the maternal genetic effect (39).
Implications for research design and limitations
In the present study, pregnancy-specific environmental sources accounted for more than half of the variation in gestational age and were approximately 5.5 times greater than familial environmental sources. This ratio is consistent with other studies (14, 15), and estimates of both environmental effects were practically unchanged after covariates were included. While common risk factors were considered, a systematic evaluation of a larger set of possible covariates was beyond the scope of this study, primarily because current socioeconomic models provide little guidance on variable selection. For instance, models of social, psychosocial, and economic disparities do not appreciably account for the large difference between African-American and European-American preterm birth rates (40–42), although substantial heterogeneity in the effect of pregnancy-specific environmental exposures has been reported (15). These findings suggest that efforts for discovery of novel environmental determinants of pregnancy health would benefit from the identification of changes in exposures and social situations across births of the same mother.
The use of heritability estimates to summarize the influence of genetic sources within and between populations should be interpreted with caution, as the relative contributions of genes and the environment are not always constant (43). Foremost, the heritability of a trait can differ on the basis of changes in environmental variance across populations. For example, although height is a highly heritable human trait, observed differences in mean height between populations are largely attributable to environmental differences, such as diet and quality of health care (44). In fact, the higher variance of gestational age in African Americans compared with European Americans was shown to be attributed largely to pregnancy-specific environmental factors (15). Understanding how heritability changes under different environmental contexts would provide a more complete picture for the role of genetic contributions to preterm birth.
In conclusion, both fetal genetic and maternal genetic factors contributed significantly to differences in gestational age. These results suggest that both fetal and maternal samples should be included in genetic association studies to account for the problem of correlated genotypes and to avoid confounding. Consistent with previous findings, the influence of factors not shared over successive pregnancies was large compared with those shared by siblings. Commonly used covariates did little to account for the total variance in gestational age and did not change the relative influence of environmental or genetic parameters. We showed that the recoding of gestational age by imposing a threshold likely does not constitute testing a new hypothesis but, rather, can result in increased standard errors of parameter estimates, especially for the fetal genetic component in the model tested. Thus, it is to the investigator's advantage to use continuous versus dichotomized outcome variables whenever possible. Although generally there has been a disconnect between environmental indices and biological processes in research on the timing of birth (45), genetic studies might best proceed by understanding the heterogeneity in social and environmental determinants of health and their possible interaction with fetal and maternal genetic differences.
Supplementary Material
ACKNOWLEDGMENTS
Author affiliations: Department of Human and Molecular Genetics, School of Medicine, Virginia Commonwealth University, Richmond, Virginia (Timothy P. York, Lindon J. Eaves, Michael C. Neale, Jerome F. Strauss III); Virginia Institute for Psychiatric and Behavioral Genetics, Virginia Commonwealth University, Richmond, Virginia (Timothy P. York, Lindon J. Eaves, Michael C. Neale); Department of Obstetrics and Gynecology, School of Medicine, Virginia Commonwealth University, Richmond, Virginia (Timothy P. York and Jerome F. Strauss III); Department of Psychiatry, School of Medicine, Virginia Commonwealth University, Richmond, Virginia (Lindon J. Eaves and Michael C. Neale); Department of Medical Epidemiology and Biostatistics, Karolinska Instituet, Stockholm, Sweden (Paul Lichtenstein and Niklas Långström); Department of Public Health Sciences, Division of Public Health Epidemiology, Karolinska Institutet, Stockholm, Sweden (Anna Svensson); and Centre for Epidemiology and Community Medicine, Stockholm County Council, Stockholm, Sweden (Anna Svensson).
This work was supported by National Institutes of Health grants R01HD034612, P60MD002256, HD073555, and UL1RR031990.
The funding agencies had no involvement in any phase of this study, including design; collection, analysis, and interpretation of data; and writing and publication of the manuscript.
Conflict of interest: none declared.
REFERENCES
- 1.Narang I. Review series: what goes around, comes around: childhood influences on later lung health? Long-term follow-up of infants with lung disease of prematurity. Chron Respir Dis. 2010;7(4):259–269. doi: 10.1177/1479972310375454. [DOI] [PubMed] [Google Scholar]
- 2.Crump C, Sundquist K, Winkleby MA, et al. Preterm birth and risk of epilepsy in Swedish adults. Neurology. 2011;77(14):1376–1382. doi: 10.1212/WNL.0b013e318231528f. [DOI] [PMC free article] [PubMed] [Google Scholar]
- 3.Wehkalampi K, Hovi P, Dunkel L, et al. Advanced pubertal growth spurt in subjects born preterm: the Helsinki study of very low birth weight adults. J Clin Endocrinol Metab. 2011;96(2):525–533. doi: 10.1210/jc.2010-1523. [DOI] [PubMed] [Google Scholar]
- 4.Santos IS, Matijasevich A, Domingues MR, et al. Late preterm birth is a risk factor for growth faltering in early childhood: a cohort study. BMC Pediatr. 2009;9:71. doi: 10.1186/1471-2431-9-71. [DOI] [PMC free article] [PubMed] [Google Scholar]
- 5.Crump C, Winkleby MA, Sundquist K, et al. Risk of hypertension among young adults who were born preterm: a Swedish national study of 636,000 births. Am J Epidemiol. 2011;173(7):797–803. doi: 10.1093/aje/kwq440. [DOI] [PMC free article] [PubMed] [Google Scholar]
- 6.Manzardo AM, Madarasz WV, Penick EC, et al. Effects of premature birth on the risk for alcoholism appear to be greater in males than females. J Stud Alcohol Drugs. 2011;72(3):390–398. doi: 10.15288/jsad.2011.72.390. [DOI] [PMC free article] [PubMed] [Google Scholar]
- 7.Skilton MR, Viikari JS, Juonala M, et al. Fetal growth and preterm birth influence cardiovascular risk factors and arterial health in young adults: the Cardiovascular Risk in Young Finns Study. Arterioscler Thromb Vasc Biol. 2011;31(12):2975–2981. doi: 10.1161/ATVBAHA.111.234757. [DOI] [PubMed] [Google Scholar]
- 8.Romero R, Chaiworapongsa T, Kuivaniemi H, et al. Bacterial vaginosis, the inflammatory response and the risk of preterm birth: a role for genetic epidemiology in the prevention of preterm birth. Am J Obstet Gynecol. 2004;190(6):1509–1519. doi: 10.1016/j.ajog.2004.01.002. [DOI] [PubMed] [Google Scholar]
- 9.Muglia LJ, Katz M. The enigma of spontaneous preterm birth. N Engl J Med. 2010;362(6):529–535. doi: 10.1056/NEJMra0904308. [DOI] [PubMed] [Google Scholar]
- 10.Anum EA, Springel EH, Shriver MD, et al. Genetic contributions to disparities in preterm birth. Pediatr Res. 2009;65(1):1–9. doi: 10.1203/PDR.0b013e31818912e7. [DOI] [PMC free article] [PubMed] [Google Scholar]
- 11.Boyd HA, Poulsen G, Wohlfahrt J, et al. Maternal contributions to preterm delivery. Am J Epidemiol. 2009;170(11):1358–1364. doi: 10.1093/aje/kwp324. [DOI] [PMC free article] [PubMed] [Google Scholar]
- 12.Porter TF, Fraser AM, Hunter CY, et al. The risk of preterm birth across generations. Obstet Gynecol. 1997;90(1):63–67. doi: 10.1016/S0029-7844(97)00215-9. [DOI] [PubMed] [Google Scholar]
- 13.Lang JM, Lieberman E, Cohen A. A comparison of risk factors for preterm labor and term small-for-gestational-age birth. Epidemiology. 1996;7(4):369–376. doi: 10.1097/00001648-199607000-00006. [DOI] [PubMed] [Google Scholar]
- 14.Lunde A, Melve KK, Gjessing HK, et al. Genetic and environmental influences on birth weight, birth length, head circumference, and gestational age by use of population-based parent-offspring data. Am J Epidemiol. 2007;165(7):734–741. doi: 10.1093/aje/kwk107. [DOI] [PubMed] [Google Scholar]
- 15.York TP, Strauss JF, 3rd, Neale MC, et al. Racial differences in genetic and environmental risk to preterm birth. PLoS ONE. 2010;5(8):e12391. doi: 10.1371/journal.pone.0012391. [DOI] [PMC free article] [PubMed] [Google Scholar]
- 16.Svensson AC, Sandin S, Cnattingius S, et al. Maternal effects for preterm birth: a genetic epidemiologic study of 630,000 families. Am J Epidemiol. 2009;170(11):1365–1372. doi: 10.1093/aje/kwp328. [DOI] [PubMed] [Google Scholar]
- 17.Wilcox AJ, Skjaerven R, Lie RT. Familial patterns of preterm delivery: maternal and fetal contributions. Am J Epidemiol. 2008;167(4):474–479. doi: 10.1093/aje/kwm319. [DOI] [PubMed] [Google Scholar]
- 18.York TP, Strauss JF, 3rd, Neale MC, et al. Estimating fetal and maternal genetic contributions to premature birth from multiparous pregnancy histories of twins using MCMC and maximum-likelihood approaches. Twin Res Hum Genet. 2009;12(4):333–342. doi: 10.1375/twin.12.4.333. [DOI] [PMC free article] [PubMed] [Google Scholar]
- 19.Neale MC, Cardon LR. Methodology for Genetic Studies of Twins and Families. Dordrecht, Netherlands: Kluwer Academic Publishers; 1992. [Google Scholar]
- 20.Falconer DS, Mackay TFC. Introduction to Quantitative Genetics. New York, NY: Pearson Education, Limited; 1996. [Google Scholar]
- 21.Neale MC, Eaves LJ, Kendler KS. The power of the classical twin study to resolve variation in threshold traits. Behav Genet. 1994;24(3):239–258. doi: 10.1007/BF01067191. [DOI] [PubMed] [Google Scholar]
- 22.Hogberg U, Larsson N. Early dating by ultrasound and perinatal outcome. A cohort study. Acta Obstet Gynecol Scand. 1997;76(10):907–912. doi: 10.3109/00016349709034900. [DOI] [PubMed] [Google Scholar]
- 23.Cnattingius S, Ericson A, Gunnarskog J, et al. A quality study of a medical birth registry. Scand J Soc Med. 1990;18(2):143–148. doi: 10.1177/140349489001800209. [DOI] [PubMed] [Google Scholar]
- 24.Neale MC, Boker SM, Xie G, et al. Mx: Statistical Modeling. Richmond, VA: Department of Psychiatry, Virginia Commonwealth University; 1999. [Google Scholar]
- 25.Sham P. Statistics in Human Genetics. New York, NY: John Wiley & Sons; 1998. [Google Scholar]
- 26.Mather J, Jinks JL. Biometrical Genetics. London, England: Chapman and Hall, Ltd; 1971. [Google Scholar]
- 27.Anum EA, Hill LD, Pandya A, et al. Connective tissue and related disorders and preterm birth: clues to genes contributing to prematurity. Placenta. 2009;30(3):207–215. doi: 10.1016/j.placenta.2008.12.007. [DOI] [PMC free article] [PubMed] [Google Scholar]
- 28.Barabas AP. Ehlers-Danlos syndrome: associated with prematurity and premature rupture of foetal membranes; possible increase in incidence. Br Med J. 1966;2(5515):682–684. doi: 10.1136/bmj.2.5515.682. [DOI] [PMC free article] [PubMed] [Google Scholar]
- 29.Lind J, Wallenburg HC. Pregnancy and the Ehlers-Danlos syndrome: a retrospective study in a Dutch population. Acta Obstet Gynecol Scand. 2002;81(4):293–300. doi: 10.1034/j.1600-0412.2002.810403.x. [DOI] [PubMed] [Google Scholar]
- 30.Volkov N, Nisenblat V, Ohel G, et al. Ehlers-Danlos syndrome: insights on obstetric aspects. Obstet Gynecol Surv. 2007;62(1):51–57. doi: 10.1097/01.ogx.0000251027.32142.63. [DOI] [PubMed] [Google Scholar]
- 31.Smith R. Parturition. N Engl J Med. 2007;356(3):271–283. doi: 10.1056/NEJMra061360. [DOI] [PubMed] [Google Scholar]
- 32.Smith R, Paul J, Maiti K, et al. Recent advances in understanding the endocrinology of human birth. Trends Endocrinol Metab. 2012;23(10):516–523. doi: 10.1016/j.tem.2012.05.002. [DOI] [PubMed] [Google Scholar]
- 33.Haataja R, Karjalainen MK, Luukkonen A, et al. Mapping a new spontaneous preterm birth susceptibility gene, IGF1R, using linkage, haplotype sharing, and association analysis. PLoS Genet. 2011;7(2):e1001293. doi: 10.1371/journal.pgen.1001293. [DOI] [PMC free article] [PubMed] [Google Scholar]
- 34.Crider KS, Whitehead N, Buus RM. Genetic variation associated with preterm birth: a HuGE review. Genet Med. 2005;7(9):593–604. doi: 10.1097/01.gim.0000187223.69947.db. [DOI] [PubMed] [Google Scholar]
- 35.Hill LD, York TP, Kusanovic JP, et al. Epistasis between COMT and MTHFR in maternal-fetal dyads increases risk for preeclampsia. PLoS ONE. 2011;6(1):e16681. doi: 10.1371/journal.pone.0016681. [DOI] [PMC free article] [PubMed] [Google Scholar]
- 36.Mitchell LE, Weinberg CR. Evaluation of offspring and maternal genetic effects on disease risk using a family-based approach: the “pent” design. Am J Epidemiol. 2005;162(7):676–685. doi: 10.1093/aje/kwi249. [DOI] [PubMed] [Google Scholar]
- 37.Starr JR, Hsu L, Schwartz SM. Assessing maternal genetic associations: a comparison of the log-linear approach to case-parent triad data and a case-control approach. Epidemiology. 2005;16(3):294–303. doi: 10.1097/01.ede.0000158223.98649.eb. [DOI] [PubMed] [Google Scholar]
- 38.Shi M, Umbach DM, Vermeulen SH, et al. Making the most of case-mother/control-mother studies. Am J Epidemiol. 2008;168(5):541–547. doi: 10.1093/aje/kwn149. [DOI] [PMC free article] [PubMed] [Google Scholar]
- 39.Haley CS, Last K. The advantages of analysing human variation using twins and twin half-sibs and cousins. Heredity. 1981;47(2):221–236. doi: 10.1038/hdy.1981.78. [DOI] [PubMed] [Google Scholar]
- 40.Kaufman JS, Cooper RS, McGee DL. Socioeconomic status and health in blacks and whites: the problem of residual confounding and the resiliency of race. Epidemiology. 1997;8(6):621–628. [PubMed] [Google Scholar]
- 41.Lu MC, Chen B. Racial and ethnic disparities in preterm birth: the role of stressful life events. Am J Obstet Gynecol. 2004;191(3):691–699. doi: 10.1016/j.ajog.2004.04.018. [DOI] [PubMed] [Google Scholar]
- 42.Goldenberg RL, Cliver SP, Mulvihill FX, et al. Medical, psychosocial, and behavioral risk factors do not explain the increased risk for low birth weight among black women. Am J Obstet Gynecol. 1996;175(5):1317–1324. doi: 10.1016/s0002-9378(96)70048-0. [DOI] [PubMed] [Google Scholar]
- 43.Visscher PM, Hill WG, Wray NR. Heritability in the genomics era—concepts and misconceptions. Nat Rev Genet. 2008;9(4):255–266. doi: 10.1038/nrg2322. [DOI] [PubMed] [Google Scholar]
- 44.Komlos J, Lauderdale BE. The mysterious trend in American heights in the 20th century. Ann Hum Biol. 2007;34(2):206–215. doi: 10.1080/03014460601116803. [DOI] [PubMed] [Google Scholar]
- 45.Kramer MR, Hogue CR. What causes racial disparities in very preterm birth? A biosocial perspective. Epidemiol Rev. 2009;31(1):84–98. doi: 10.1093/ajerev/mxp003. [DOI] [PMC free article] [PubMed] [Google Scholar]
Associated Data
This section collects any data citations, data availability statements, or supplementary materials included in this article.