

Abstract
Prior work found the APOL1, 2 and 4 genes, located on chromosome 22q12.3-q13.1, to be upregulated in brains of schizophrenic patients. We performed a family-based association study using 130 SNPs tagging the APOL gene family (APOL1-6). The subjects were 112 African-American (AA), 114 European-American (EA), 109 Chinese (Ch) and 42 Japanese (Jp) families with schizophrenia (377 families, 1171 genotyped members and 647 genotyped affecteds in total). Seven SNPs had p-values < 0.05 in the APOL1, 2 and 4 regions for the AA, EA and combined (AA and EA) samples. In the AA sample, two SNPs, rs9610449 and rs6000200 showed low p-values; and a haplotype which comprised these two SNPs yielded a p-value of 0.00029 using the global test (GT) and the allele specific test (AST). The two SNPs and the haplotype were associated with risk for schizophrenia in African-Americans. In the combined (AA and EA) sample, two SNPs, rs2003813 and rs2157249 showed low p-values; and a three SNP haplotype including these two SNPs ¥was significant using the GT (p = 0.0013) and the AST (p = 0.000090). The association of this haplotype with schizophrenia was significant for the entire (AA, EA, Ch and Jp) sample using the GT (p = 0.00054) and the AST (p = 0.00011). Although our study is not definitive, it suggests that the APOL genes should be more extensively studied in schizophrenia.
Keywords: schizophrenia, chromosome 22, APOL gene family cluster, APOL1, AOPL2, APOL4
1. Introduction
Family, twin, and adoption studies suggest that the etiology of schizophrenia is influenced by genetic factors (Tsuang and Faraone 1995; Tsuang 2000). Moreover, recent molecular genetic studies have pointed to a variety of chromosomal regions that could genetically influence schizophrenia (chromosomes 1q, 5p, 6p, 8p, 10p, 13q and 22q) (Kirov et al. 2005). Several researchers suggested that loci at chromosome 22q12.3-q13.1 might be linked to susceptibility to schizophrenia (Lasseter et al. 1995; Vallada et al. 1995a; Vallada et al. 1995b; Gill et al. 1996; Blouin et al. 1998; Shaw et al. 1998; Schizophrenia Collaborative Linkage Group for Chromosome22 1998; DeLisi et al. 2002). We also found significant associations between this region and schizophrenia in not only the European-American sample from the National Institute of Mental Health (NIMH) genetics initiative for schizophrenia but also in a combined sample of European-American and Chinese samples (Takahashi et al. 2003). These findings suggest that a gene associated with the etiology of schizophrenia may exist on chromosome 22q12.3-q13.1, which harbors the apolipoprotein L (APOL) gene family cluster. Mimmack et. al. (2002) found that APOL1, 2 and 4 of this gene family were significantly upregulated in the prefrontal cortex of schizophrenic patients. McGhee et al. (2005) performed a case-control association study of the APOL gene family using a three-stage DNA pooling strategy. They did not find evidence for an association between APOL genes and schizophrenia.
To test the hypothesis that APOL genes are associated with schizophrenia, we performed two experiments. First, we performed haplotype mapping across the 697kb region of this gene family cluster using a dense map of single nucleotide polymorphisms (SNPs). Family-based association analyses were performed for individual SNPs and then for haplotypes. Samples of African-American and European-American origin were obtained from the NIMH Genetics Initiative on Schizophrenia and the Department of Veteran Affairs (DVA) Cooperative Studies Program (CSP). Second, we performed family-based association analyses in the Chinese and Japanese samples using SNPs and haplotypes that were significant in the African-American and European-American samples.
2. Materials and methods
2.1. Subjects
We constructed the haplotype block map of the APOL gene family region using DNA samples form the Centre d'Etude du Polymorphisme Humain (CEPH) pedigrees stored at the Coriell Institute for Medical Research (12 pedigrees containing 93 family members). These samples were also used for assessing the quality of the assays designed for each SNP. We performed two experiments. The first experiment used the African-American (AA) and European-American (EA) schizophrenia family samples from the NIMH Genetics Initiative on Schizophrenia and the DVA CSP schizophrenia family samples. Detailed descriptions of the ascertainment and extension rules, diagnostic assessment, and informed consent have been presented in previous publications (Cloninger et al. 1998; Faraone et al. 1998; Kaufmann et al. 1998; Tsuang et al. 2000; Faraone et al. 2005). A description of the AA and EA samples is shown in Table 1. For the second experiment, Chinese (Ch) and Japanese (Jp) schizophrenic families were recruited through 1. Peking University, Beijing, China, and 2. Nihon University Hospital, Tokyo, Japan and five affiliated hospitals in Tokyo and its environs. After the purpose and procedures of the project were fully explained, written informed consent was obtained from the probands and participating relatives. This project was approved by the Ethics Committees of Peking University and Nihon University. A description of the samples from Ch and Jp is given in Table 1. For all of the samples, each affected family member met DSM-III-R criteria for schizophrenia or schizoaffective disorder, depressive type.
Table 1.
Description of the African-American, European-American Chinese, Japanese and entire samples
| Ped | Nuclear families |
Genotyped members |
Genotyped affecteds |
Ped | Nuclear families |
Genotyped members |
Genotyped affecteds |
Ped | Nuclear families |
Genotyped members |
Genotyped affecteds |
|
|---|---|---|---|---|---|---|---|---|---|---|---|---|
| AA |
EA |
AA and EA |
||||||||||
| NIMH | 46 | 61 | 172 | 121 | 56 | 63 | 204 | 124 | 102 | 124 | 376 | 245 |
| DVA | 51 | 51 | 163 | 110 | 50 | 51 | 167 | 112 | 101 | 102 | 330 | 222 |
| Total | 97 | 112 | 335 | 231 | 106 | 114 | 371 | 236 | 203 | 226 | 706 | 467 |
| Ch |
Jp |
Ch and Jp |
||||||||||
| 109 | 109 | 322 | 118 | 42 | 42 | 133 | 62 | 151 | 151 | 455 | 180 | |
| Entire sample |
||||||||||||
| 354 | 377 | 1161 | 647 | |||||||||
Ped: pedigrees; AA: African-American; EA: European-American; NIMH: National Institute of Mental Health; DVA: Department of Veteran Affairs; Total: NIMH and DVA; Ch: Chinese; Jp: Japanese; Entire sample: African-American, European-American, Chinese and Japanese
2.2. SNP selection, genotyping and statistical analysis
All SNPs were selected from the National Center for Biotechnology Information (NCBI)/dbSNP database (http://www.ncbi.nlm.nih.gov/SNP/; dbSNP, build 118) and the Celera (http://www.appliedbiosystems.com/) database (in this paper, we changed Celera SNP numbers to rs numbers). These SNPs were validated in the CEPH samples to assess assay quality and to build our initial haplotype block map of the region. For the AA, EA and CEPH samples, genotyping was performed using the Sequenom system which uses Matrix Assisted Laser Desorption/Ionization Time-of-Flight Mass Spectrometry (MALDI-TOF MS). For the Ch and Jp samples, genotyping used Sequence-Specific Primer Cycle Elongation (SSPCE) and Fluorescence Correction Spectrometry (FCS): SSPCE-FCS (Hori et al. 2003). To test associations between our SNPs of interest and schizophrenia, we used the Family Based Association Test (FBAT) program version 1.7.3 (http://www.biostat.harvard.edu/~fbat/fbat.htm). For haplotype mapping and visualization, we used HaploView (http://www.broad.mit.edu/personal/jcbarret/haploview/) and LocusView (http://www.broad.mit.edu/mpg/locusview/).
3. Results
3.1. SNP selection
The APOL gene family cluster is located on chromosome 22q at position 34,316kb-34,936kb on the physical map (NCBI, build 34). The order of the genes is as follows: centromeric-APOL6-APOL5-APOL3-APOL4-APOL2-APOL1-telomeric. SNPs were selected across the entire 697 kb region (Figure 1).
Figure 1. Genes in the APOL family cluster region.
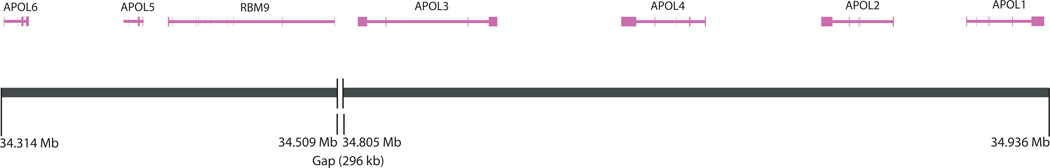
The genes were based the NCBI/RefSeq.
Two hundred thirty nine SNPs were selected at an average spacing of 3kb. We removed 49 SNPs that failed quality control tests after genotyping was performed on the CEPH families. We removed an additional 59 SNPs that failed quality control tests after genotyping the NIMH and DVA samples. A total of 130 SNPs met our quality control criteria. The average distance between these SNPs was 5,397 bp. The SNPs in the APOL1, 2, 3 and 4 regions are shown in Figure 2.
Figure 2. Positions of SNPs with P < 0.05 in the entire sample.

The genes were based the NCBI/RefSeq. The direction of arrows is a direction of transcription. The end of Figure a and the first of Figure b are same position. The “hCV” means SNPs from the Celera database and the “rs” means SNPs from the dbSNP database. SNPs highlighted by a red font had P < 0.05
3.2. Family-based association study and definition of haplotype blocks
Since there are only two alleles for each SNP, the results for the minor and major alleles are identical apart from the signs of the Z statistics in single-marker analyses of the FBAT program. A minor allele with a positive Z statistic is referred to as a high risk variant; and a minor allele with negative value is referred as a protective variant (Table 2, 5 and 7) (FBAT Manual, Feng et al. 2004; Bosse et al. 2005).
Table 2.
SNPs with P < 0.05 in the African-American and European-American samples
| SNPs | Gene (see Figure 2 and 3) |
Allele | Allele frequency | Informative family | p-value (Z) | ||||||
|---|---|---|---|---|---|---|---|---|---|---|---|
| AA | EA | AA and EA |
AA | EA | AA and EA |
AA | EA | AA and EA | |||
| rs2092786 | RBM9 | A | 0.51 | 0.85 | 0.70 | 31 | 18 | 49 | 0.076 (−1.77) | 0.14 (−1.48) | 0.021 (−2.31) |
| T | 0.49 | 0.15 | 0.30 | 0.076 (1.77) | 0.14 (1.48) | 0.021 (2.31) | |||||
| rs16996261 | out of gene region | G | 0.51 | 0.14 | 0.30 | 30 | 17 | 47 | 0.23 (1.21) | 0.058 (1.90) | 0.037 (2.09) |
| T | 0.49 | 0.86 | 0.70 | 0.23 (−1.21) | 0.058 (−1.90) | 0.037 (−2.09) | |||||
| rs5995197 | out of gene region | A | 0.63 | 0.27 | 0.43 | 27 | 31 | 58 | 0.19 (1.31) | 0.088 (1.71) | 0.031 (2.15) |
| T | 0.34 | 0.73 | 0.57 | 0.19 (−1.31) | 0.088 (−1.71) | 0.031 (−2.15) | |||||
| rs132736 | APOL4 | C | 0.60 | 0.41 | 0.49 | 27 | 36 | 63 | 0.012 (−2.51) | 0.63 (0.49) | 0.049 (−1.97) |
| T | 0.40 | 0.59 | 0.51 | 0.012 (2.51) | 0.63 (0.49) | 0.049 (1.97) | |||||
| rs9610449 | APOL4/APOL2 | C | 0.22 | 0.34 | 0.29 | 22 | 31 | 53 | 0.0029 (2.98) | 0.33 (0.98) | 0.011 (2.56) |
| T | 0.78 | 0.66 | 0.71 | 0.0029 (−2.98) | 0.33 (−0.98) | 0.011 (−2.56) | |||||
| rs6000200 | APOL4/APOL2 | C | 0.71 | 0.66 | 0.71 | 21 | 31 | 52 | 0.00060 (−3.43) | 0.33 (−0.98) | 0.0052 (−2.79) |
| G | 0.29 | 0.34 | 0.29 | 0.00060 (3.43) | 0.33 (0.98) | 0.0052 (2.79) | |||||
| rs2016988 | APOL4/APOL2 | C | 0.38 | 0.07 | 0.21 | 31 | 12 | 43 | 0.016 (−2.40) | 0.83 (−0.22) | 0.033 (−2.14) |
| G | 0.62 | 0.93 | 0.79 | 0.016 (2.40) | 0.83 (0.22) | 0.033 (2.14) | |||||
| rs2003813 | APOL2/APOL1 | C | 0.81 | 0.67 | 0.74 | 18 | 31 | 49 | 0.068 (1.83) | 0.029 (2.18) | 0.0046 (2.83) |
| T | 0.19 | 0.33 | 0.26 | 0.068 (−1.83) | 0.029 (−2.18) | 0.0046 (−2.83) | |||||
| rs2157249 | APOL2/APOL1 | C | 0.19 | 0.27 | 0.27 | 17 | 32 | 49 | 0.041 (−2.04) | 0.024 (−2.26) | 0.0027 (−3.01) |
| T | 0.81 | 0.73 | 0.73 | 0.041 (2.04) | 0.024 (2.26) | 0.0027 (3.01) | |||||
| rs2413394 | APOL2/APOL1 | A | 0.01 | 0.19 | 0.11 | 2 | 23 | 25 | * | 0.076 (1.77) | 0.043 (−2.03) |
| G | 0.99 | 0.81 | 0.89 | * | 0.076 (1.77) | 0.043 (2.03) | |||||
AA: African-American sample; EA: European-American sample. The “rs” means SNPs from the dbSNP database.
A default value of useful minimum number of family in FBAT is 10.The marker rs2413394 in the African-American sample was not calculated because the number of family was under 10.
Table 5.
Replicated SNPs in the Chinese and Japanese samples, and the entire sample
| SNPs | Gene (see Figure 2 and 3) |
Allele | Allele frequency | Informative family | p-value (Z) | |||||||
|---|---|---|---|---|---|---|---|---|---|---|---|---|
| Ch | Jp | Ch and JP |
Entire | Ch | Jp | Ch and |
Entire | Ch and Jp | Entire | |||
| rs9610449 | APOL4/APOL2 | C | 0.07 | 0.08 | 0.07 | 0.19 | 25 | 3 | JP 28 | 81 | 0.21 (−1.26) | 0.11 (1.60) |
| T | 0.93 | 0.92 | 0.93 | 0.81 | 0.21 (1.26) | 0.11 (−1.60) | ||||||
| rs6000200 | APOL4/APOL2 | C | 0.93 | 0.92 | 0.93 | 0.81 | 26 | 3 | 29 | 81 | 0.16 (1.41) | 0.090 (−1.70) |
| G | 0.07 | 0.08 | 0.07 | 0.19 | 0.16 (−1.41) | 0.090 (1.70) | ||||||
| rs2016988 | APOL4/APOL2 | C | 0.96 | 0.97 | 0.96 | 0.54 | 16 | 4 | 20 | 63 | 0.51 (−0.66) | 0.029 (−2.91) |
| G | 0.04 | 0.03 | 0.04 | 0.46 | 0.51 (0.66) | 0.029 (2.91) | ||||||
| rs2003813 | APOL2/APOL1 | C | 0.995 | 1.0 | 0.996 | 0.85 | 2 | 0 | 2 | 51 | * | 0.0020 (3.09) |
| T | 0.005 | 0 | 0.004 | 0.15 | * | 0.0020 (−3.09) | ||||||
| rs2157249 | APOL2/APOL1 | C | 0.005 | 0 | 0.004 | 0.15 | 2 | 0 | 2 | 51 | * | 0.0011 (−3.26) |
| T | 0.996 | 1.0 | 0.996 | 0.85 | * | 0.0011 (3.26) | ||||||
Ch: Chinese; Jp: Japanese; Entire: African-American, European-American, Chinese and Japanese.
A default value of useful minimum number of family in FBAT is 10.The marker rs2413394 in the African-American sample was not calculated because the number of family was under 10.
Table 7.
Summary of the single SNP association results in the African-American, European-American, Chinese and Japanese samples
| SNPs (Gene, see Figure 2 and 3) |
Allele | Allele frequency | Informative family |
p-value (Z) |
||||||||||||
|---|---|---|---|---|---|---|---|---|---|---|---|---|---|---|---|---|
| AA | EA | AA and EA |
Ch and JP |
Entire | AA | EA | AA and EA |
Ch and JP |
Entire | AA | EA | AA and EA |
Ch and Jp |
Entire | ||
| rs9610449 (APOL4/APOL2) |
C | 0.22 | 0.34 | 0.29 | 0.07 | 0.19 | 22 | 31 | 53 | 28 | 81 | 0.0029 (2.98) |
0.33 (0.98) |
0.011 (2.56) |
0.21 (−1.26) |
0.11 (1.60) |
| T | 0.78 | 0.66 | 0.71 | 0.93 | 0.81 | 0.0029 (−2.98) |
0.33 (−0.98) |
0.011 (−2.56) |
0.21 (1.26) |
0.11 (−1.60) |
||||||
| rs6000200 (APOL4/APOL2) |
C | 0.71 | 0.66 | 0.71 | 0.93 | 0.81 | 21 | 31 | 52 | 29 | 81 | 0.00060 (−3.43) |
0.33 (−0.98) |
0.0052 (−2.79) |
0.16 (1.41) |
0.090 (−1.70) |
| G | 0.29 | 0.34 | 0.29 | 0.07 | 0.19 | 0.00060 (3.43) | 0.33 (0.98) | 0.0052 (2.79) | 0.16 (−1.41) | 0.090 (1.70) | ||||||
| rs2016988 (APOL4/APOL2) |
C | 0.38 | 0.07 | 0.21 | 0.96 | 0.54 | 31 | 12 | 43 | 20 | 63 | 0.016 (−2.40) |
0.83 (−0.22) |
0.033 (−2.14) |
0.51 (−0.66) |
0.029 (−2.91) |
| G | 0.62 | 0.93 | 0.79 | 0.04 | 0.46 | 0.016 (2.40) |
0.83 (0.22) |
0.033 (2.14) |
0.51 (0.66) |
0.029 (2.91) | ||||||
| rs2003813 (APOL2/APOL1) |
C | 0.81 | 0.67 | 0.74 | 0.996 | 0.85 | 18 | 31 | 49 | 2 | 51 | 0.068 (1.83) |
0.029 (2.18) |
0.0046 (2.83) |
* | 0.0020 (3.09) |
| T | 0.19 | 0.33 | 0.26 | 0.004 | 0.15 | 0.068 (−1.83) | 0.029 (−2.18) | 0.0046 (−2.83) | * | 0.0020 (−3.09) | ||||||
| rs2157249 (APOL2/APOL1) |
C | 0.19 | 0.27 | 0.27 | 0.004 | 0.15 | 17 | 32 | 49 | 2 | 51 | 0.041 (−2.04) |
0.024 (−2.26) |
0.0027 (−3.01) |
* | 0.0011 (−3.26) |
| T | 0.81 | 0.73 | 0.73 | 0.996 | 0.85 | 0.041 (2.04) | 0.024 (2.26) | 0.0027 (3.01) | * | 0.0011 (3.26) | ||||||
AA: African-American; EA: European-American; Ch: Chinese; Jp: Japanese; Entire: African-American, European-American, Chinese and Japanese.
SNPs with p < 0.05 for the combined (AA and EA) sample are summarized in Table 2. Ten SNPs yielded p-values < 0.05, and seven of those were in the APOL4–1 region. The SNPs which showed the smallest p-value, rs2157249 (Z = −3.01, p = 0.0027; the variant C allele is the protective allele), and the second smallest p-value, rs2003813 (Z = −2.83, p = 0.0046; the variant C allele is the protective allele) were in the APOL2 gene. Only rs2157249 yielded a p-value < 0.05 in both the AA and EA samples. Since APOL1, 2 and 4 were all located nearby, this region in the APOL2 gene was +20kb from APOL4 and −20kb from APOL1 (Figure 2, b). In the AA sample, five of the above seven SNPs in the APOL4–1 region had p < 0.05 (see Table 2). In the EA sample, only the above two SNPs with the smallest and second smallest p-values had p < 0.05 (see Table 2). In the AA and EA samples, rs9610449 and rs6000200 variants were associated with a risk for schizophrenia whereas rs2016988, rs2003813 and rs2157249 variants were protective effect against schizophrenia.
Figure 3 shows the haplotype block structure using the AA or EA full family trios in the APOL4-1 region (rs132664 - rs2071733; distance: 117,176bp). We found two blocks for the EA sample: blocks A and B, and four blocks for the AA sample: blocks C, D, E and F. We performed haplotype analyses utilizing the above block structures. The global test (GT) and the allele specific test (AST) for the EA and AA samples are summarized in Tables 3 and 4. For the EA sample, only one haplotype for block B showed p < 0.05 (Table 3 - block B SNPs - haplotype: A-C-T-C-T - AST). However, the GT for this block did not yield p < 0.05 (Table 3 - block B -GT P-value). As shown in Table 4, the haplotype that showed the smallest p-value for the AA sample was in block E (Z = 3.36, p = 0.00029; the C-G variant is the high risk haplotype). The GT p-value was 0.00029.
Figure 3. Four Gamete Rule (FGR) blocks detected by the European-American or African-American full family trio in the APOL1, 2 and 4 regions.

The genes were based the NCBI/RefSeq. The direction of arrows is a direction of transcription. SNPs highlighted by a red font had P < 0.05
Table 3.
Haplotype analyses of blocks including SNPs with P < 0.05 in European-American
| Block A SNPs |
Size (bp) |
Haplotype frequency |
Informative family |
Global test (GT) p-value (df, chi-square) |
Allele specific test (AST) p-value (Z) |
||||||
|---|---|---|---|---|---|---|---|---|---|---|---|
| rs1075803 | rs2016988 * | rs2269597 | hCV11521267 | rs2003813 * | rs2157249 * | rs916264 | |||||
| 14,809 | 0.16 (5, 7.9) | ||||||||||
| C | G | A | C | T | C | C | 0.34 | 28 | 0.097 (−1.66) | ||
| T | G | G | T | C | T | C | 0.22 | 30 | 0.28 (1.08) | ||
| C | G | A | C | C | T | A | 0.21 | 26 | 0.79 (−0.26) | ||
| C | G | A | C | C | T | C | 0.15 | 14 | 0.059 (1.89) | ||
| C | C | A | C | C | T | C | 0.07 | 13 | 0.67 (−0.42) | ||
| Haplotype rs201 6988 * - rs2003813
* - rs2157249 * within the Block A of the combined sample (AA and EA) |
|||||||||||
| 0.0013 (3, 15.6) | |||||||||||
| G | C | T | 0.53 | 65 | 0.000090 (3.91) | ||||||
| G | T | C | 0.25 | 45 | 0.013 (−2.48) | ||||||
| C | C | T | 0.21 | 44 | 0.046 (−1.99) | ||||||
| Block B SNPs |
|||||||||||
| rs9610448 | rs11704345 | rs9610449 * | rs6000200 * | rs132753 | |||||||
| 6,918 | 0.37 | ||||||||||
| (5, 5.4) | |||||||||||
| A | C | T | C | T | 0.36 | 29 | 0.046 (−2.0) | ||||
| A | C | T | C | C | 0.23 | 33 | 0.39 (0.86) | ||||
| G | T | C | G | T | 0.21 | 28 | 0.52 (0.64) | ||||
| G | C | C | G | T | 0.11 | 16 | 0.28 (1.07) | ||||
| G | C | T | C | T | 0.08 | 12 | 0.88 (−0.15) | ||||
The “hCV” means SNPs from the Celera database and the “rs” means SNPs from the dbSNP database. Haplotypes with the IF > 10 are not shown for each block because a default value of useful minimum number of family in FBAT is 10.
SNPs with p < 0.05 in the single SNP association test in the African-American and European-American samples. AA: African-American sample; EA: European-American sample.
Table 4.
Haplotype analyses of blocks including SNPs with P < 0.05 in African-American
| Block C SNPs |
Size (bp) |
haplotype frequency |
Informative family |
Global test (GT) p-value (df, chi-square) |
Allele specific test (AST) p-value (Z) |
||||
|---|---|---|---|---|---|---|---|---|---|
| rs2003813 * | rs2157249 * | rs916264 | |||||||
| 4,789 | 0.10 (2, 4.5) | ||||||||
| C | T | C | 0.79 | 21 | 0.054 (1.93) | ||||
| T | C | C | 0.16 | 25 | 0.037 (−2.09) | ||||
| Block D SNPs |
|||||||||
| rs132753 | rs1075803 | rs2016988 * | rs2269597 | hCV11521267 | |||||
| 11,094 | 0.066 (2, 5.5) | ||||||||
| T | C | G | A | C | 0.48 | 35 | 0.021 (2.30) | ||
| T | C | C | A | C | 0.38 | 30 | 0.045 (−2.00) | ||
| Block E SNPs |
|||||||||
| rs9610449 * | rs6000200 * | ||||||||
| 0.00029 (1, 13.1) | |||||||||
| T | C | 0.8 | 19 | 0.00029 (−3.63) | |||||
| C | G | 0.2 | 19 | 0.00029 (3.63) | |||||
IF: informative family; haplotypes with the IF > 10 are not shown for each block because a default value of useful minimum number of family in FBAT is 10.
SNPs with p < 0.05 in the single SNP association test in the African-American and European-American samples
We performed the haplotype analyses using SNPs within the blocks defined by AA or EA in each ethnic sample. Although the analyses based on race are suitable for block-based analyses, these also have a problem of reducing sample sizes. Moreover, if we use a large block with many SNPs, the sample sizes also decrease. The FBAT analysis for haplotype is able to adjust for population admixture. Furthermore, the blocks for the AA and EA samples almost overlapped (Figure 3). Hence, in order to maximize the statistical power of our analysis, we performed the haplotype test with a small number of SNPs in the combined (AA and EA) sample as well. The above two SNPs with the smallest and second smallest p-values in the single SNP analyses using the combined samples (rs2157249 and rs2003813) were in the block A defined by EA (Figure 3). These two SNPs also showed the smallest and second smallest p-values in the EA sample (Table 2). Therefore we paid attention to these two SNPs and block A, and performed the haplotype analysis using three SNP haplotype composed of only SNPs with p < 0.05 (rs2016988 -rs2003813 - rs2157249) within the block A. We found our second lowest GT p-value, 0.0013 (chi-square = 15.6) and the lowest AST p-value, 0.000090 (Z = 3.92) in the combined samples (see Haplotype rs2016988 - rs2003813 - rs2157249 within the Block A of the combined sample (AA and EA) in Table 4). The haplotype with the lowest p-value consisted of major alleles (G, C and T). The other haplotypes bearing the variant alleles (C, T or C) showed negative Z statistics. Hence, the haplotypes with variant alleles, C, T or C may be protective against schizophrenia. However, because the significance levels of the haplotypes with variant alleles were marginal, these findings should be interpreted cautiously.
We also performed family-based association tests using five SNPs with p < 0.05 (rs9610449, rs6000200, rs2016988, rs2003813 and rs2157249; see Table 2) within the interesting blocks (block A and E; see Table 3 and 4, and figure 3) in the Ch and Jp samples. Replicated SNPs for the Ch and Jp samples are summarized in Table 5. The number of informative Ch and Jp families was small and allele frequencies for each SNP were similar in the two groups. Thus, we performed the association analyses combining Ch and Jp. There were no significant associations in the Asian sample (Ch and Jp in Table 5). Moreover, the markers rs2003813 and rs2157249 in the Asian sample were not examined because the numbers of informative families were less than 10. In the entire sample (AA, EA, Ch and Jp), rs9610449 and rs6000200 did not show p < 0.05; rs2016988, rs2003813 and rs2157249 yielded p < 0.05 (Table 5). However, as mentioned above, the numbers of informative families for rs2003813 and rs2157249 in the Asian sample were very small. Therefore, the results for the Asian sample did not influence the results for the entire sample. For the haplotype analyses, haplotype rs9610449 - rs6000200 of block E did not show p < 0.05 for either the GT or the AST; haplotype rs2016988 - rs2003813 - rs2157249 within block A yielded p = 0.00054 (chi-square = 17.6, GT) and p = 0.00011 (Z = 3.87, AST of G-C-T haplotype) in the entire sample (Table 6 and figure 3). In the entire sample, the G-C-T haplotype with the lowest p-value was not the major haplotype (haplotype frequency = 0.32, see Table 6), and bore the variant G allele of rs2016988 (Table 5). The Z statistic for this haplotype was positive. Thus, this haplotype may be a risk variant for schizophrenia. However, these results were not consistent with the findings of the combined AA and EA sample. In the AA and EA sample, the G allele of rs2016988 was the major allele; and the G-C-T haplotype was also the major haplotype. Therefore, we should interpret this result cautiously.
Table 6.
Haplotype consisted of the replicated SNPs in the entire sample
| 3 SNPs Haplotype within the Block A defined by EA |
Haplotype frequency |
Informative family |
Global test (GT) p-value (df, chi-square) |
Allele specific test (AST) p-value (Z) |
||||
|---|---|---|---|---|---|---|---|---|
| rs9610449 | rs6000200 | rs2016988 | rs2003813 | rs2157249 | ||||
| 0.00054 (3, 17.6) | ||||||||
| C | C | T | 0.52 | 66 | 0.082 (−1.74) | |||
| G * | C * | T * | 0.32 | 85 | 0.00011 (3.87) | |||
| G | T | C | 0.15 | 45 | 0.013 (−2.48) | |||
| Block E (2 SNPs haplotype) defined by AA |
||||||||
| 0.13 (2, 4.05) | ||||||||
| T ** | C ** | 0.81 | 77 | 0.098 (−1.65) | ||||
| C ** | G ** | 0.19 | 76 | 0.081 (1.75) | ||||
AA: African-American; EA: European-American; entire sample: African-American, European-American, Chinese and Japanese. Haplotypes with the IF > 10 are not shown for each block because a default value of useful minimum number of family in FBAT is 10.
The most significant haplotype in the combined sample (African-American and European-American).
The most significant haplotype in the African-American sample.
Because we performed 432 tests in this study, the Bonferroni corrected alpha level was 0.00012. The GT and AST results for block E in the AA sample were close to the Bonferroni corrected threshold (p = 0.00029, Table 4). The AST results for the G-C-T haplotype within block A in the combined (AA and EA) sample (p = 0.00009, Table 3) and the entire (AA, EA, Ch and Jp) sample (p = 0.00011, Table 6) were still significant after the Bonferroni correction.
4. Discussion
The results of this study are summarized in Table 7 and 8. We performed a family-based association study with 130 SNPs covering all members of the APOL gene family for the AA, EA and combined (AA and EA) samples. Moreover, we examined these genes in the Asian (Ch and Jp) and combined (AA, EA, Ch and Jp) samples. In Table 7, rs9610449 and rs6000200 of the APOL4 and APOL2 regions showed low p-values in the AA sample. These SNPs did not reach nominal significance in the entire sample. The SNPs, rs2003813 and rs2157249 of the APOL2 and APOL1 regions yielded low p-values for the combined (AA and EA) and entire samples. However, the allele frequencies of the two SNPs in the Asian sample were quite different from those of the AA and EA samples. As a result, although 151 Asian families were genotyped, there were only two informative families. Therefore, the Asian sample is not useful for association studies of these two SNPs.
Table 8.
Summary of the haplotype association results in the African-American, European-American, Chinese and Japanese samples
| 3 SNPs Haplotype within the Block A defined by EA | Haplotype frequency | Informative family |
Global test (GT) p-value (df, chi-square) |
Allele specific test (AST) p-value (Z) |
|||||||||||
|---|---|---|---|---|---|---|---|---|---|---|---|---|---|---|---|
| rs9610449 | rs6000200 | rs2016988 | rs2003813 | rs2157249 | AA | EA | AA and EA |
Ch and Jp |
Entire | AA and EA |
Entire | AA and EA | Entire | AA and EA | Entire |
| 0.0013 | 0.00054 | ||||||||||||||
| (3, 15.6) | (3, 17.6) | ||||||||||||||
| G * | C * | T * | 0.46 | 0.59 | 0.53 | 0.035 | 0.32 | 65 | 85 | 0.000090 (3.91) | 0.00011 (3.87) | ||||
| G | T | C | 0.16 | 0.34 | 0.25 | 0 | 0.15 | 45 | 45 | 0.013 (−2.48) |
0.013 (−2.48) |
||||
| C | C | T | 0.38 | 0.066 | 0.21 | 0.96 | 0.52 | 44 | 66 | 0.046 (−1.99) |
0.082 (−1.74) |
||||
| Block E (2 SNPs haplotype) defined by AA | |||||||||||||||
| AA | EA | AA and EA |
Ch and Jp |
Entire | AA | Entire | AA | Entire | AA | Entire | |||||
| 0.00029 | 0.13 | ||||||||||||||
| (1, 13.1) | (2, 4.05) | ||||||||||||||
| T ** | C ** | 0.80 | 0.67 | 0.73 | 0.93 | 0.81 | 19 | 77 | 0.00029 (−3.63) |
0.098 (−1.65) |
|||||
| C ** | G ** | 0.20 | 0.33 | 0.27 | 0.067 | 0.19 | 19 | 76 | 0.00029 (3.63) |
0.081 (1.75) |
|||||
AA: African-American; EA: European-American; Entire: African-American, European-American, Chinese and Japanese.
The most significant haplotype in the combined sample (African-American and European-American).
The most significant haplotype in the African-American sample.
In the APOL4, 2 and 1 regions, we found two blocks for the EA sample: blocks A and B, and four for the AA sample: blocks C, D, E and F (Figure 3). As seen in Table 8, haplotype rs2016988 - rs2003813 - rs2157249 within block A yielded a significant p-value using the GT and AST in the combined (AA and EA) sample. Moreover, these results were replicated in the entire sample when we added the Asian sample. In the AST for the combined sample, the haplotype with the lowest p-value comprised major alleles ( G, C and T); and the frequency of this haplotype was the highest. Z statistics for other haplotypes bearing the variant alleles were negative but their significance levels were marginal. On the other hand, the frequency of the G-C-T haplotype with the lowest p-value was second, and it bore the G variant for the entire sample. Moreover, the Z statistic for this haplotype was positive. Hence, the results from the combined sample were not consistent with those for the entire sample. These results may be influenced by the low frequency of G-C-T haplotype of Asian sample. Thus, it is premature to conclude that this haplotype is associated with schizophrenia.
McGhee et al. (2005) reported a case-control study of the APOL gene family using a novel DNA pooling strategy. They found no association between APOL genes and schizophrenia. However, they performed single SNP analyses only. They stated that the APOL gene family would warrant more investigation assessing the haplotype structure across this gene family region with the use of a larger sample to increase statistical power. In this study, we did the block-based analysis and our sample was relatively large.
In summary, our results were as follows: 1) rs9610449, rs6000200 and block E comprised of these two SNPs yielded a low p-value in the AA sample. These SNPs and block E were associated with a risk for schizophrenia. 2) rs2003813, rs2157249 and a three SNP haplotype including these two SNPs within the block A showed a low p-value in the combined (AA and EA) sample. Similar results for this haplotype were seen in the entire (AA, EA, Ch and Jp) sample. The results of the haplotype for the combined sample (p = 0.00009, Table 3) and the entire sample (p = 0.00011, Table 6) remained significant after the Bonferroni correction. Variant alleles of these two SNPs had a protective effect against schizophrenia in the combined sample. As for the haplotype, we could not determine if was a risk or protective haplotype for schizophrenia. 4) The above SNPs and blocks were in the APOL4-1 region (Figure 2 and 3). Mimmack reported APOL1, 2 and 4 were upregulated in the schizophrenia brain. Additionally, several researchers have found evidence for linkage and association in the region that includes APOL1, 2 and 4. Therefore, we conclude that APOL1, 2 and/or 4 may play a risk or protective role in the etiology of schizophrenia. However, we were not able to decide whether the APOL gene had risk or protective effect. Nevertheless, our results suggest that the APOL genes should be more extensively studied in schizophrenia. We also found that the Asian sample was not suitable for association studies using SNPs from the APOL4–1 region. Hence, in order to confirm the present results, more studies for APOL genes using a larger single race, AA or EA samples will be needed.
Supplementary Material
Acknowledgement
The authors thank staffs of Department of Psychiatry, Harvard Medical School, and Psychiatric and Neurodevelopmental Genetics Unit, Massachusetts General Hospital, Charlestown, MA and MIT/Whitehead Institute Center Biomedical Research, Cambridge, MA.
Role of Funding Source
Preparation of this work was supported in part by grants RO1MH43518, R01MH59624 and R01MH60485 from the National Institute of Mental Health to Dr. Ming T. Tsuang. A part of this work was performed when Dr. Takahashi was trainees in the National Institute of Mental Health funded Psychiatric Genetics Training Program at the Harvard Institute of Psychiatric Epidemiology and Genetics (R25MH60485, M. Tsuang, PI). The original data collection was supported by NIMH grants 1 R01MH41874-01, 5 UO1MH46318 and 1 R37MH43518 to Dr. Ming T. Tsuang, UO1MH46289 to Dr. Charles Kaufmann, UO1MH46276 to Dr. C. Robert Cloninger and R01MH44292 to Drs. Jurg Ott and Charles Kaufmann and contracts with Millennium Pharmaceuticals (sponsored by Wyeth-Ayerst Pharmaceuticals).
The National Institute of Mental Health Genetics Initiative for schizophrenia is a multi-site study performed by three independent research teams in collaboration with staff from the National Institute of Mental Health (NIMH). The NIMH Collaborators include David Shore, M.D., Debra Wynne, M.S.W., Steven O. Moldin, Ph.D., Darrell G. Kirch, M.D. (1989–1994), Kate A. Berg, Ph.D. (1990–1994), Nancy E. Maestri, Ph.D. (1992–1994); the NIMH Senior Scientific Consultant is Darrel A. Regier, M.D., M.P.H. The Principal Investigators and Co-Investigators from the three sites are: Harvard University, Boston, Massachusetts, U01 MH46318, Ming T. Tsuang, M.D., Ph.D., D.Sc., Stephen Faraone, Ph.D., and John Pepple, Ph.D.; Washington University, St. Louis, Missouri, U01 MH46276, C. Robert Cloninger, M.D., Theodore Reich, M.D., and Dragan Svrakic, M.D.; Columbia University, New York, New York U01MH46289, Charles Kaufmann, M.D., Dolores Malaspina, M.D., and Jill Harkavy Friedman, Ph.D. Blood samples are sent to the NIMH Cell Repository at the Coriell Institute for Medical Research. Clinical data is stored in the NIMH Data Management Center at SRA Technologies, Inc. Moreover, this research was supported in part by grants from the Research on Brain Science of the Japanese Ministry of Health, labor and Welfare (T. K.), 09470210 (T. K.) Scientific Research on Priority Areas (C) of the Japanese Ministry of Education, Science, Sports and Culture of Japan, 17390321 (T. K.) Scientific Research on Priority Areas (B) of the Japanese Ministry of Education, Science, Sports and Culture of Japan, the Nihon University Joint Research Grant for 2006 of the Nihon University (S.T.) and the Research Group for Schizophrenia (S.T.).
Footnotes
Publisher's Disclaimer: This is a PDF file of an unedited manuscript that has been accepted for publication. As a service to our customers we are providing this early version of the manuscript. The manuscript will undergo copyediting, typesetting, and review of the resulting proof before it is published in its final citable form. Please note that during the production process errors may be discovered which could affect the content, and all legal disclaimers that apply to the journal pertain.
Contributors
Authors Sakae Takahashi, Jesen A. Fagerness, Takuya Kojima, Stephen V. Faraone, Ming T. Tsuang, and staffs of Department of Psychiatry, Harvard Medical School, and Psychiatric and Neurodevelopmental Genetics Unit and MIT/Whitehead Institute Center Biomedical Research designed the study and wrote the protocol. Authors Sakae Takahashi, Jesen A. Fagerness, Stephen V. Faraone, and staffs of Department of Psychiatry, Harvard Medical School, and Psychiatric and Neurodevelopmental Genetics Unit and MIT/Whitehead Institute Center Biomedical Research managed the literature searches and analyses, and undertook the statistical analysis. Authors Sakae Takahashi wrote the first draft of the manuscript. All authors contributed to and have approved the final manuscript.
Conflict of Interest
All authors declare that they have no conflicts of interest.
References
- Blouin JL, Dombroski BA, Nath SK, Lasseter VK, Wolyniec PS, Nestadt G, Thornquist M, Ullrich G, McGrath J, Kasch L, Lamacz M, Thomas MG, Gehrig C, Radhakrishna U, Snyder SE, Balk KG, Neufeld K, Swartz KL, DeMarchi N, Papadimitriou GN, Dikeos DG, Stefanis CN, Chakravarti A, Childs B, Housman DE, Kazazian HH, Antonarakis S, Pulver AE. Schizophrenia susceptibility loci on chromosomes 13q32 and 8p21. Nat. Genet. 1998;20:70–73. doi: 10.1038/1734. [DOI] [PubMed] [Google Scholar]
- Bossé Y, Bouchard L, Després JP, Bouchard C, Pérusse L, Vohl MC. Haplotypes in the phospholipid transfer protein gene are associated with obesity-related phenotypes: the Québec Family Study. Int. J. Obes. (Lond) 2005;29(11):1338–1345. doi: 10.1038/sj.ijo.0803010. [DOI] [PubMed] [Google Scholar]
- Cloninger CR, Kaufmann CA, Faraone SV, Malaspina D, Svrakic DM, Harkavy-Friedman J, Suarez BK, Matise TC, Shore D, Lee H, Hampe CL, Wynne D, Drain C, Markel PD, Zambuto CT, Schmitt K, Tsuang MT. Genome-wide search for schizophrenia susceptibility loci: the NIMH Genetics Initiative and Millennium Consortium. Am. J. Med. Genet. 1998;81:275–281. [PubMed] [Google Scholar]
- DeLisi LE, Shaw SH, Crow TJ, Shields G, Smith AB, Larach VW, Wellman N, Loftus J, Nanthakumar B, Razi K, Stewart J, Comazzi M, Vita A, Heffner T, Sherrington R. A genome-wide scan for linkage to chromosomal regions in 382 sibling pairs with schizophrenia or schizoaffective disorder. Am. J. Psychiatry. 2002;159:803–812. doi: 10.1176/appi.ajp.159.5.803. [DOI] [PubMed] [Google Scholar]
- Faraone SV, Matise T, Svrakic D, Pepple J, Malaspina D, Suarez B, Hampe C, Zambuto CT, Schmitt K, Meyer J, Markel P, Lee H, Harkavy-Friedman J, Kaufmann C, Cloninger CR, Tsuang MT. Genome scan of EA schizophrenia pedigrees: results of the NIMH Genetics Initiative and Millennium Consortium. Am. J. Med. Genet. 1998;81:90–295. [PubMed] [Google Scholar]
- Faraone SV, Skol AD, Tsuang DW, Young KA, Haverstock SL, Prabhudesai S, Mena F, Menon AS, Leong L, Sautter F, Baldwin C, Bingham S, Weiss D, Collins J, Keith T, Vanden Eng JL, Boehnke M, Tsuang MT, Schellenberg GD. Genome scan of schizophrenia families in a large Veterans Affairs Cooperative Study sample: Evidence for linkage to 18p11.32 and for racial heterogeneity on chromosomes 6 and 14. Am. J. Med. Genet. Part B: Neuropsychiatric Genetics. 2005;139:91–100. doi: 10.1002/ajmg.b.30213. [DOI] [PubMed] [Google Scholar]
- Feng Y, Niu T, Xing H, Xu X, Chen C, Peng S, Wang L, Laird N, Xu X. A common haplotype of the nicotine acetylcholine receptor alpha 4 subunit gene is associated with vulnerability to nicotine addiction in men. Am. J. Hum. Genet. 2004;75(1):112–121. doi: 10.1086/422194. [DOI] [PMC free article] [PubMed] [Google Scholar]
- Gill M, Vallada H, Collier D, Sham P, Holmans P, Murray R, McGuffin P, Nanko S, Owen M, Antonarakis S, Housman D, Kazazian H, Nestadt G, Pulver AE, Straub RE, MacLean CJ, Walsh D, Kendler KS, DeLisi LE, Polymeropoulos M, Coon H, Byerley W, Lofthouse R, Gershon E, Read CM, et al. A combined analysis of D22S278 marker alleles in affected sib-pairs: support for a susceptibility locus for schizophrenia at chromosome 22q12. Schizophrenia Collaborative Linkage Group (Chromosome 22) Am. J. Med. Genet. 1996;67:40–45. doi: 10.1002/(SICI)1096-8628(19960216)67:1<40::AID-AJMG6>3.0.CO;2-W. [DOI] [PubMed] [Google Scholar]
- Hori K, Shin WS, Hemmi C, Toyooka T, Makino T. High fidelity SNP genotyping using sequence-specific primer elongation and fluorescence correlation spectroscopy. Curr. Pharm. Biotechnol. 2003;4(6):477–484. doi: 10.2174/1389201033377391. [DOI] [PubMed] [Google Scholar]
- Hudson RR, Kaplan NL. Statistical properties of the number of recombination events in the history of a sample of DNA sequences. Genetics. 1985;111:147–164. doi: 10.1093/genetics/111.1.147. [DOI] [PMC free article] [PubMed] [Google Scholar]
- Kaufmann CA, Suarez B, Malaspina D, Pepple J, Svrakic D, Markel PD, Meyer J, Zambuto CT, Schmitt K, Matise TC, Harkavy-Friedman JM, Hampe C, Lee H, Shore D, Wynne D, Faraone SV, Tsuang MT, Cloninger CR. NIMH Genetics Initiative Millenium Schizophrenia Consortium: linkage analysis of AA pedigrees. Am. J. Med. Genet. 1998;81:282–289. [PubMed] [Google Scholar]
- Kirov G, O'Donovan MC, Owen MJ. Finding schizophrenia genes. J. Clin. Invest. 2005;115(6):1440–1448. doi: 10.1172/JCI24759. [DOI] [PMC free article] [PubMed] [Google Scholar]
- Lasseter VK, Pulver AE, Wolyniec PS, Nestadt G, Meyers D, Karayiorgou M, Housman D, Antonarakis S, Kazazian H, Kasch L, et al. Follow-up report of potential linkage for schizophrenia on chromosome 22q: Part 3. Am. J. Med. Genet. 1995;60:172–173. doi: 10.1002/ajmg.1320600217. [DOI] [PubMed] [Google Scholar]
- McGhee KA, Morris DW, Schwaiger S, Nangle JM, Donohoe G, Clarke S, Meagher D, Quinn J, Scully P, Waddington JL, Gill M, Corvin A. Investigation of the apolipoprotein-L (APOL) gene family and schizophrenia using a novel DNA pooling strategy for public database SNPs. Schizophr Res. 2005;76(2–3):231–238. doi: 10.1016/j.schres.2005.01.006. [DOI] [PubMed] [Google Scholar]
- Mimmack ML, Ryan M, Baba H, Navarro-Ruiz J, Iritani S, Faull RL, McKenna PJ, Jones PB, Arai H, Starkey M, Emson PC, Bahn S. Gene expression analysis in schizophrenia: reproducible up-regulation of several members of the apolipoprotein L family located in a high-susceptibility locus for schizophrenia on chromosome 22. Proc. Natl. Acad. Sci. U.S.A. 2002;99:4680–4685. doi: 10.1073/pnas.032069099. [DOI] [PMC free article] [PubMed] [Google Scholar]
- Muller N, Riedel M, Ackenheil M, Schwarz MJ. The role of immune function in schizophrenia: an overview. Eur. Arch. Psychiatry Clin. Neurosci. 1999;249(Suppl. 4):62–68. doi: 10.1007/pl00014187. [DOI] [PubMed] [Google Scholar]
- Niu T, Qin ZS, Xu X, Liu JS. Bayesian haplotype inference for multiple linked single-nucleotide polymorphisms. Am J Hum Genet. 2002;70(1):157–169. doi: 10.1086/338446. [DOI] [PMC free article] [PubMed] [Google Scholar]
- Shaw SH, Kelly M, Smith AB, Shields G, Hopkins PJ, Loftus J, Laval SH, Vita A, De Hert M, Cardon LR, Crow TJ, Sherrington R, DeLisi LE. A genome-wide search for schizophrenia susceptibility genes. Am. J. Med. Genet. 1998;81:364–376. doi: 10.1002/(sici)1096-8628(19980907)81:5<364::aid-ajmg4>3.0.co;2-t. [DOI] [PubMed] [Google Scholar]
- Schizophrenia Collaborative Linkage Group for Chromosome22. A transmission disequilibrium and linkage analysis of D22S278 marker alleles in 574 families: further support for a susceptibility locus for schizophrenia at 22q12. Schizophrenia Collaborative Linkage Group for Chromosome 22. Schizophr. Res. 1998;32:115–121. doi: 10.1016/s0920-9964(98)00048-6. [DOI] [PubMed] [Google Scholar]
- Takahashi S, Cui YH, Kojima T, Han YH, Zhou RL, Kamioka M, Yu SY, Matsuura M, Matsushima E, Wilcox M, Arinami T, Shen YC, Faraone SV, Tsuang MT. Family-based association study of markers on chromosome 22 in schizophrenia using AA, EA, and Ch families. Am. J. Med. Genet. 2003;120B:11–17. doi: 10.1002/ajmg.b.20031. [DOI] [PubMed] [Google Scholar]
- Tsuang MT, Faraone SV. The case for heterogeneity in the etiology of schizophrenia. Schizophr. Res. 1995;17:161–175. doi: 10.1016/0920-9964(95)00057-s. [DOI] [PubMed] [Google Scholar]
- Tsuang MT. Schizophrenia: genes and environment. Biol. Psychiatry. 2000a;47:210–220. doi: 10.1016/s0006-3223(99)00289-9. [DOI] [PubMed] [Google Scholar]
- Tsuang MT, Faraone SV, Bingham S, Young K, Prabhudesai S, Haverstock SL, Mena F, Menon AS, Pepple J, Johnson J, Baldwin C, Weiss D, Collins J. Department of Veterans Affairs Cooperative Studies Program genetic linkage study of schizophrenia: ascertainment methods and sample description. Am. J. Med. Genet. 2000b;96:342–347. doi: 10.1002/1096-8628(20000612)96:3<342::aid-ajmg21>3.0.co;2-j. [DOI] [PubMed] [Google Scholar]
- Vallada H, Curtis D, Sham PC, Murray RM, McGuffin P, Nanko S, Gill M, Owen M, Collier DA. Chromosome 22 markers demonstrate transmission disequilibrium with schizophrenia. Psychiatr. Genet. 1995a;5:127–130. doi: 10.1097/00041444-199505030-00005. [DOI] [PubMed] [Google Scholar]
- Vallada HP, Gill M, Sham P, Lim LC, Nanko S, Asherson P, Murray RM, McGuffin P, Owen M, Collier D. Linkage studies on chromosome 22 in familial schizophrenia. Am. J. Med. Genet. 1995b;60:139–146. doi: 10.1002/ajmg.1320600210. [DOI] [PubMed] [Google Scholar]
Associated Data
This section collects any data citations, data availability statements, or supplementary materials included in this article.