

Abstract
Background
In vivo magnetic resonance spectroscopy (MRS) has previously been used to directly monitor brain ethanol. It has been proposed that the ethanol methyl 1H resonance intensity is larger in ethanol-tolerant individuals than in sensitive individuals. To characterize the relationship between long-term ethanol exposure and the brain ethanol MRS intensity, we present data from a longitudinal experiment conducted using nonhuman primate subjects.
Methods
In vivo MRS was used to measure the gray matter (GM) and white matter (WM) ethanol methyl 1H MRS intensity in 18 adult male rhesus macaques at four time points throughout the course of a chronic drinking experiment. Time points were prior to ethanol drinking, following a 3-month ethanol induction procedure, and following six, and twelve subsequent months of 22-hours/day of “open access” to ethanol (4% w/v) and water.
Results
The ethanol methyl 1H MRS intensity, which we observed to be independent of age over the range examined, increased with chronic ethanol exposure in GM and WM. In GM, MRS intensity increased from naive-level following the ethanol induction period (90 g/kg cumulative ethanol intake). In WM, MRS intensity was not significantly different from the ethanol-naïve state until after 6 months of 22-hours free access (110–850 g/kg cumulative intake range). The WM MRS intensity in the ethanol-naive state was positively correlated with future drinking, and the increase in WM MRS intensity was negatively correlated with the amount of ethanol consumed throughout the experiment.
Conclusions
Chronic exposure to ethanol is associated with brain changes that result in differential increases in ethanol MRS intensity in GM and WM. The ethanol-naïve WM MRS intensity pattern is consistent with its previously proposed relationship to innate tolerance to the intoxicating effects of ethanol. Ethanol-dependent MRS intensity changes in GM required less ethanol exposure than was necessary to produce changes in WM. Within WM, an unexpected, potentially age-dependent, enhanced sensitivity to ethanol in light drinkers relative to heavy drinkers was observed.
Keywords: Nonhuman primate, Magnetic resonance spectroscopy, Self administration, Gray matter, Ethanol
Introduction
A challenge encountered in characterizing pharmacologically-relevant molecular interactions between ethanol and macromolecules in tissue is addressing their generally transient and non-specific biochemical properties (Grant, 1994, Harris et al., 2008). The integrity of an ethanol macromolecular binding site in the in situ brain potentially depends on tissue constituents that are difficult to extract from living systems, such as lipid bilayer elements important for regulating a receptor’s activity, or biomolecular complexes within the cell cytoplasm (Pietrzykowski and Treistman, 2008; Yuan et al., 2008), which can preclude traditional biochemical characterization. One experimental strategy that can be used to directly monitor biophysical properties of ethanol in the brain in spite of these complicating factors is in vivo magnetic resonance spectroscopy (MRS).
Several researchers have demonstrated the ability to detect the ethanol methyl 1H MRS signal in brain following oral or intravascular ethanol administration (Chiu et al., 1994; 2004; Hanstock et al., 1990; Hetherington et al., 1999; Kaufman et al., 1994; 1996; Mendelson et al., 1990; Meyerhoff et al., 1996; Petroff et al., 1990; Spielman et al., 1993). Due to the relative ease with which ethanol crosses the blood brain barrier (Kalant, 1971; Raichle et al., 1976), ethanol equilibrates within brain tissue in minutes (intravascular or intragastric administration (Adalsteinsson et al., 2006; Flory et al., 2010; Quertemont et al., 2003) or tens of minutes (oral administration (Hetherington et al., 1999)) following its initial administration. Indeed, brain ethanol concentration has recently been shown to more closely parallel breath ethanol concentration than does the venous ethanol level, which lags by approximately 7 minutes (Gomez et al., 2012). Relative to methyl 1H nuclei of other compounds present in brain at sufficiently high concentration to study by in vivo MRS, the ethanol methyl 1H are characterized by a short transverse relaxation time constant (Sammi et al., 2000). Intermolecular interactions with macromolecules can give rise to efficient transverse relaxation either by constraining rotational diffusion of ethanol, or through inducing changes in the 1H chemical shift between the bound and unbound (bulk solution) states (De Graaf, 2007). Thus, the short ethanol methyl 1H T2 suggests that in vivo ethanol MRS signals are potentially sensitive probes of intermolecular interactions occurring within the brain. Further suggestive evidence that the brain ethanol MRS signal may be used to characterize ethanol binding interactions with macromolecules has been observed in studies of human subjects (Chiu et al., 1994; 2004; Kaufman et al., 1996), dogs (Moxon et al., 1991), and rat brain extracts (Govindaraju et al., 1997). In each of the above experiments, the T2-weighted ethanol methyl 1H MRS signal intensity was reported to be larger in tissue that was previously exposed to ethanol. It was subsequently noted by Sammi and co-workers (2000) that relatively modest changes in the ethanol methyl 1H T2 could give rise to substantial changes in the MRS signal intensity. However, Sammi and co-workers also documented large differences in the ethanol methyl 1H T2 value between gray matter (GM) and white matter (WM) (Sammi et al., 2000), and hence raised the possibility that confounds related to GM/WM differences complicate the interpretation of earlier reports of changes in the ethanol MRS signal intensity following ethanol exposure.
The objective of the study described here was to utilize a longitudinally-designed experiment to determine whether the T2-weighted methyl 1H MRS intensity changes with chronic ethanol exposure in the brains of rhesus macaques that voluntarily drink ethanol. Use of nonhuman primates as research subjects offers several advantages compared to studies of humans or non-primates. In human studies, it is infeasible to obtain ethanol-naïve subjects to be studied over a precisely-characterized period of ethanol drinking while controlling for other aspects of diet, housing and exposure to other drugs. Studies of non-primate laboratory species are not ideal because they have much shorter life-spans, and therefore cannot be studied over a time range that is relevant to human drinking. Additionally, non-primate species do not possess sufficient intracranial volume fraction of WM to perform analyses of GM and WM tissue components, as is necessary with human subjects. We have recently implemented methods developed in the context of human subjects research (Hetherington et al., 1994; 1996; 1999; Sammi et al., 2000) to account for differences between GM and WM in MRS studies of adult nonhuman primates (Flory et al., 2010). This previously-described methodology is applied here to the analysis of four MRS data sets, acquired prior to ethanol self-administration, following a 3-month ethanol drinking induction period, subsequent to a 6-month period of 22 hours per day of unrestricted ethanol drinking, and following 1 year of 22 hours per day of unrestricted drinking (Vivian et al., 2001). The data are analyzed to examine the hypotheses 1) that relatively high T2-weighted ethanol methyl 1H MRS intensity that has previously been associated with ethanol tolerant, heavy-drinking individuals (Chiu et al., 1994; 2004) is observed in ethanol-naive animals that subsequently become heavy drinkers; and 2) that the ethanol MRS intensity increases with chronic ethanol exposure, potentially in a dose dependent manner.
Materials and Methods
Subjects
Eighteen adult male rhesus monkeys (Macaca mulatta) obtained from the Oregon National Primate Research Center breeding colony served as subjects. The mean ± standard deviation in age at the beginning of the experiment (month 0, defined below) was 7.8 ± 1.6 years, distributed over a range from 6.2 to 10.5 years. All procedures involving animals were conducted in accordance with the “Guidelines of the Committee on the Care and Use of Laboratory Animal Resources” (National Health Council, Department of Health, Education, and Welfare, ISBN 0-309-05377-3, revised 1996) and, prior to their implementation, were reviewed by the Institutional Animal Care and Use Committee of the Oregon National Primate Research Center, and found to be in compliance with all local, state, and national regulations pertaining to the humane use of animal subjects.
Ethanol Self-Administration
All subjects were trained to orally self-administer ethanol as described previously (Grant et al., 2008; Vivian et al., 2001), and reviewed in the Supplemental Information. Drinking periods consisted of a 3 month training/induction phase, in which each monkey consumed an average of 1.0 g/kg ethanol per day, followed by two 6-month periods of 22-hr access to 4% (w/v) ethanol, concurrently available with water.
MR Data Acquisition
Magnetic resonance imaging and spectroscopy data were acquired using a 3T Siemens Magnetom trio MRI system at four different timepoints: prior to ethanol self-administration induction, while the monkeys were still ethanol-naïve (month 0); immediately after ethanol self-administration training (month 3); after 6 months of 22-hour daily access to ethanol (month 9); and after 1 year of 22-hour daily access to ethanol (month 15). The same data acquisition protocol, described in an earlier report (Flory et al., 2010), was followed at each time point for induction of sedation with 10 mg/kg ketamine, maintenance of anesthesia with 1.5% isoflurane under ventilation control, and catheter placement for ethanol administration.
After positioning the monkey in the scanner, a single T1-weighted/MP-RAGE image (Mugler and Brookeman, 1990) was obtained (0.5 mm isotropic image resolution, 128 slices, TE = 4.38 ms, TR = 2500 ms, TI = 1100 ms). As shown in Figure 1A, this image was used to position a single transverse chemical shift imaging (CSI) slice in the center of the brain. The CSI slice consisted of an 8 by 8 square matrix of (8.0 mm)3 voxels (yellow box and green grid, Figure 1A). Additional CSI pulse sequence parameters were echo time (TE) = 150 ms, and recycle delay (TR) = 1770 ms, and these were chosen based on criteria described previously (Flory et al., 2010). To suppress extracranial lipid signals, a volume selection functionality was used to excite magnetization only within a 32 mm × 48 mm volume element within the 64 mm × 64 mm region digitized by the 2D CSI experiment (red box, Figure 1A). The acquisition time for each transient was 2 min. For 10 of the 18 animals, a circularly-polarized extremity transmit/receive RF coil was utilized. For the remaining 8 animals, a circularly polarized transmit, 8 element receive (InVivo, Orlando, FL) coil was used. Although two rf coils were used in this study, all four sessions were recorded using the same coil for each animal.
Figure 1.
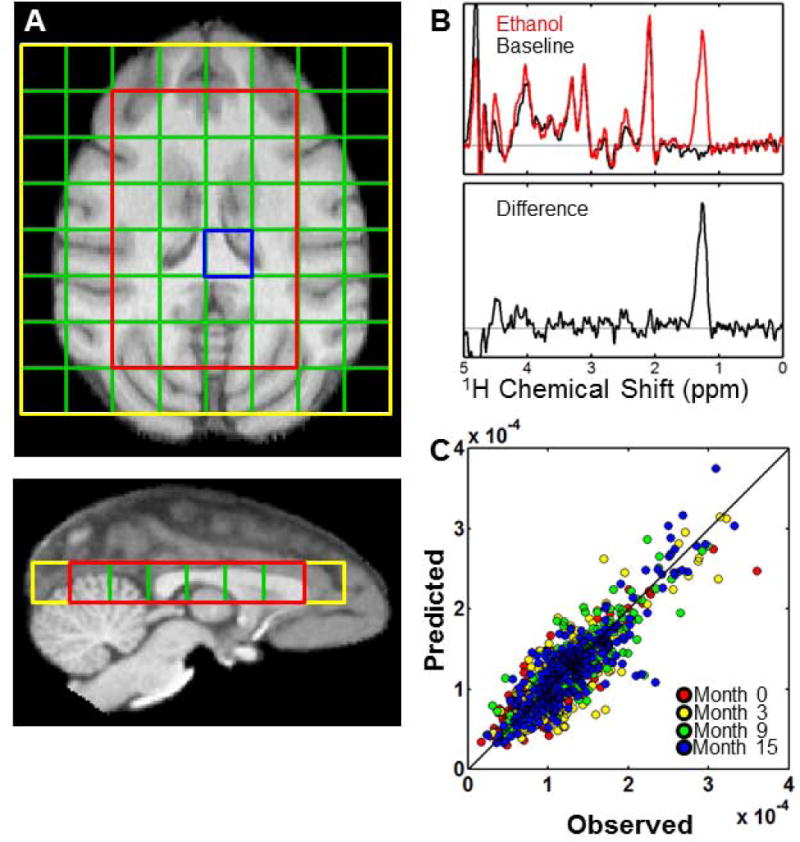
Quantification of ethanol MRS signal intensity in GM and WM. (A) Overlay of the 8×8 grid of (8 mm)3 CSI voxels n an axial T1-weighted image. The region outlined in red is the PRESS-selected volume, within which ethanol and H2O resonances were quantified. (B) Example spectra acquired prior to (black trace) and following (red trace) intravenous infusion of ethanol. The ethanol methyl 1H signal is determined from the difference spectrum (lower trace). (C) Observed (abscissa) vs. expected (ordinate) values obtained for the 995 voxels quantified, after using Eqs. [7]–[9] to estimate and for each monkey at each of the four time points. Data values are color-coded according to the experimental time point in which they were acquired.
Prior to the infusion of ethanol, a baseline CSI dataset was acquired (8 transients, 16 min). An ethanol dose of 1.0 g/kg was then delivered at a rate of 0.1 g/kg per minute through a catheter placed in the saphenous vein. Ethanol was administered through 15′ of microbore PTFE tubing, connected to a PHD 22/2200 infusion pump (Harvard Apparatus, Holliston, MA) without altering the position of the monkey within the magnet. Although spectra were acquired during the ten minute ethanol infusion, ethanol signal intensity was calculated using only spectra that were acquired from 10–40 minutes after the ethanol infusion, as described previously (Flory et al., 2010). In order to calculate the transverse relaxation time constant (T2) of water, water unsuppressed spectra were acquired (1 transient, 2 min), using echo times of 30, 60, 90, 120, 150, 200, and 250 ms, during periods alternating with water-suppressed CSI experiments. Following the execution of the last CSI pulse sequence (40 minutes after the end of the ethanol infusion), three additional T1-weighted images were acquired, so that a sufficiently large signal to noise ratio in the averaged images would facilitate image segmentation so that the CSI voxel fractions of GM, WM, and CSF could be determined, as described previously (Flory et al., 2010). For 10 of the 18 monkeys, only one MP-RAGE image was acquired at timepoint 2. Image segmentation was achieved for each monkey at this time point by performing a rigid body registration to the MP-RAGE data from timepoint 1, and utilizing its segmentation results.
In CSI voxels in which the 1H methyl resonance of N-acetylaspartate was resolved to baseline (e.g., as illustrated in Figure 1B), the ethanol methyl 1H MRS intensity was quantified by first subtracting the baseline spectrum from each water-suppressed post-infusion spectrum (Flory et al., 2010). In Figure 1B, typical baseline and ethanol spectra are shown in black and red, respectively, and a difference spectrum is shown in the lower plot. Spectral intensity between 1.0 to 1.5 ppm was attributed to resonance of the ethanol methyl protons.
Post-Acquisition Data Processing
As described previously (Flory et al., 2010), for voxel i, in monkey j, the ethanol MRS intensity , is the sum of components arising from GM, WM, and CSF
| [1] |
In order to compare intensities between scanner sessions, each of the above terms must be expressed relative to an intensity standard. Previously (Flory et al., 2010), only ethanol-naive animals were studied, and the ethanol MRS intensity within GM and WM was expressed as a ratio of the ethanol/NAA methyl 1H signals. Here, in order to avoid the potential confound that the NAA methyl signal intensity could change with ethanol exposure (Bendszus et al., 2001; Meyerhoff et al., 2004; Schweinsburg et al., 2003; Zahr et al., 2009), we use the water 1H MRS signal (at TE=0) rather than NAA as an intensity standard. For this purpose, the series of water resonance intensities, , for voxel i in monkey j, at varying TE values were fitted to the mono-exponential expression
| [2] |
The water intensity at TE=0 is proportional to the volume fractions of GM, WM, and CSF within the voxel; VGM, VWM, VCSF, respectively; the relative water concentrations within the tissue sub compartments, ρGM, ρWM, and ρCSF; and the tissue-specific T1-weighting factors , , and
| [3] |
in which the leading factor of 2 reflects the two 1H nuclei per H2O water molecule, and following Kalant (1971), [H2O] is the concentration of water in blood plasma. As described previously (Flory et al., 2010), the scaling factor for α ∈ GM, WM, CSF is the T1-weighted steady state magnetization, and is given by
| [4] |
Herein water T1 values of 1600 ms, 840 ms, and 4400 ms were used for the water 1H longitudinal relaxation time constants within GM, WM, and CSF, respectively (Rooney et al., 2007); the relative water concentrations ρGM, ρWM, and ρCSF are 1.01, 0.87, and 1.22, respectively (Kalant, 1971); and the factors VGM, VWM, and VCSF represent the GM, WM, and CSF volume fractions following corrections for slice profile non-uniformity, and accounting for the point spread function of the CSI experiment, as well as the chemical shift effects upon volume localization (Flory et al., 2010).
The expression analogous to Eq. 3 for the ethanol methyl 1H signal intensity for voxel i in monkey j,
| [5] |
contains three additional terms. Its leading factor of 3 reflects 3 methyl 1H protons per ethanol molecule, the scaling factor XJ EtOH = 0.4 arises from the imperfect refocusing of scalar coupling to the ethanol methylene 1H nuclei at a TE value of 150 ms (Flory et al., 2010), and the parameters , , and are the T2-weighted signal intensity components for GM, WM, and CSF for monkey j at a TE value of 150 ms,
| [6] |
for α ∈ GM, WM, CSF. Numerical values of T1,EtOH of 2000 ms, 2000 ms, and 4400 ms in for GM, WM, and CSF, respectively (Flory et al., 2010). The factors ρGM, ρWM, and ρCSF for ethanol are equal to the values for water (Kalant, 1971).
The ethanol/water MRS intensity ratio for voxel i in monkey j, measured using a TE of 150 ms for ethanol and 0 ms for water, consists of three terms, corresponding to GM, WM, and CSF
| [7] |
The GM term is
| [8] |
in which the numerical value of the parameter
| [9] |
can be determined for each voxel from the image segmentation results and physical constants described above. Analogous expressions for the WM and CSF intensity ratios are defined by interchanging superscripts in the numerators of the above expressions. There are a total of 145 adjustable parameters in Eq. 7, including 144 MRS outcomes associated with the four sets of and the four sets of for the j=1,…,18 monkeys obtained from each of the four experimental time points, and the 145th adjustable parameter is the final Eq. 7 term corresponding to the CSF component. These were obtained by least-squares fitting 995 voxel ethanol/water intensity ratios to the expression for the ratio of Eq. 7 using Matlab software (The Mathworks, Boston, MA). The 995 observed intensity ratios are derived from 265, 273, 206, and 251 data values obtained from month 0, 3, 9, and 15 time points, respectively; corresponding to averages of 14.7, 15.2, 11.4, and 13.9 measured ratios per animal (these are out of a maximum of 24 ratios per animal, but many spectra were not analyzed due to the inability to shim the magnetic field such that the NAA resonance is resolved to baseline (Flory et al., 2010)). The measured intensity ratios are plotted vs. the predicted values based on the 145 fitted parameters in Eq. 7 in Figure 1C.
Statistics
To evaluate the effect of brain tissue type (GM vs. WM) and the length of exposure to ethanol on the ethanol methyl 1H signal intensity, as well as on the water 1H T2, a mixed model, repeated measures ANOVA was used. Frequently, in repeated measures experiments, two measurements taken at adjacent times are more highly correlated than two measurements taken several time points apart. Therefore a Bayesian information criterion (BIC) was used to determine the optimal correlation within subjects, which resulted in the use of an unstructured covariance model of the intra-subject random effects. False discovery rate correction was used for multiple comparisons (Benjamini and Hochberg, 1995). Effects were considered significant at the level α ≤ 0.05.
Results
In Figure 2, the mean (± standard error, SEM) ethanol methyl 1H intensity is plotted over the four experimental time points for GM (gray circles) and WM (white circles). A significant fixed effect of brain tissue type is observed in the Figure 2 data (p<0.0001), in which the ethanol WM MRS intensity is less than that for GM. In addition, a significant fixed effect of length of ethanol exposure was also observed (p=0.0003). To evaluate the length of ethanol exposure necessary to observe a difference in the ethanol methyl 1H MRS intensity, comparisons revealed significant differences between 0 and 3, 0 and 9, and 0 and 15 months for GM (p=0.014, 0.004, and 0.016, respectively), and between 0 and 9, and 0 and 15 months for WM (p=0.030, and 0016, respectively). Thus, after the three month ethanol self-administration induction period, the ethanol methyl 1H signal intensity in GM is larger than it was in the ethanol-naïve state, and this increased intensity persists throughout the remaining phases of the ethanol drinking experiment (indicated by asterisks above solid lines, Fig. 2). Within WM, significantly increased ethanol methyl 1H signal intensity relative to naïve-state values is not observed until the 9-months time point (indicated by asterisks above dashed lines, Fig. 2).
Figure 2.
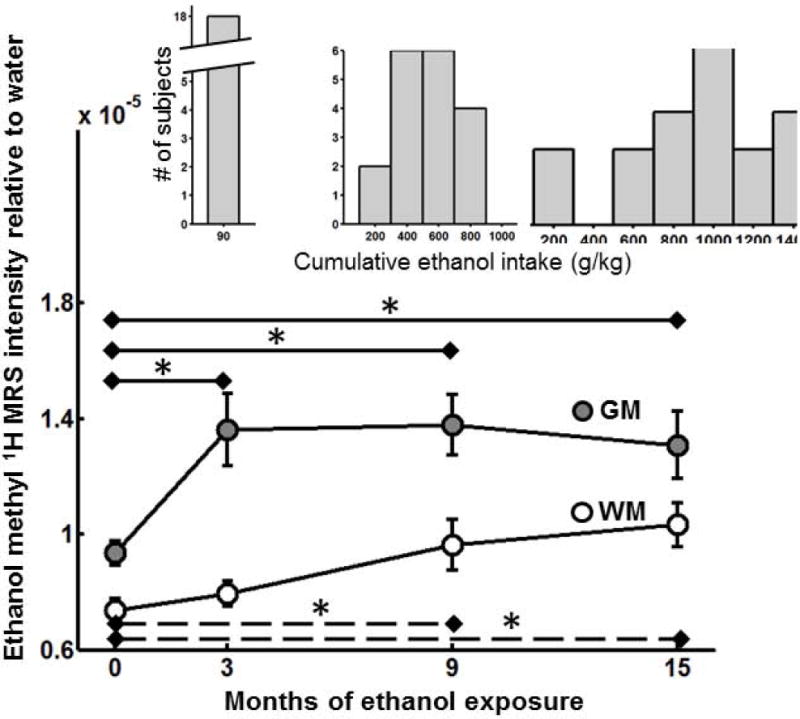
Ethanol MRS intensity increases with exposure in GM and WM. Average ± standard errors in (gray filled circles) and (open circles) are plotted vs. experimental time points. Ethanol MRS intensity in GM is significantly larger at all subsequent time points than it was in the ethanol-naïve state (asterisks, solid lines). In WM, ethanol MRS intensity is observed to be significantly higher than in the ethanol-naïve state following 9, as well as following 12 months 22 hours free-access drinking (asterisks, dashed lines). The distributions of cumulative ethanol intakes following each drinking period are shown as insets.
The cumulative ethanol intake distributions among the subjects are shown as insets above each Figure 2 time point. The month 3 time point occurred immediately after a three month ethanol self-administration induction in which each monkey had ingested the same amount of ethanol (90 g/kg). The third and fourth time points, months 9 and 15, each occurred after a 6 month period of 22-hour daily access to a 4% (w/v) ethanol solution during which the monkeys could consume as much ethanol as they chose. As is evident in Figure 2 cumulative intake distributions, there is variation between animals in the amount they drank between induction and 9 months, and between 9 months and 15 months. Therefore it was of interest to determine whether the amount of ethanol consumed correlated with either the ethanol methyl 1H MRS intensity in the ethanol-naive state, or the magnitude of changes in the ethanol methyl 1H MRS intensity over the course of drinking. Analysis of the GM MRS intensity did not reveal correlations between cumulative ethanol intake and ethanol MRS intensity in the naive state, nor did ethanol intake correlate with changes in ethanol MRS intensity between 0 and 9, and 0 and 15 months. Within GM, the T2-weighted ethanol MRS intensity increases following ethanol exposure, and reaches an asymptotic level by the end of induction.
In contrast, within WM, significant correlations were observed between cumulative ethanol intake and the ethanol methyl 1H MRS intensity in the naive state, as well as the change in WM ethanol MRS intensity with ethanol exposure. Interestingly, the direction of the correlation between cumulative intake at 15 months and ethanol MRS intensity in WM changed from positive in the ethanol-naive time point (month 0 WM MRS vs. intake at 15 months: r=0.59, p=0.01) to a negative correlation at 15 months (month 15 WM MRS vs. intake at 15 months: r=−0.72, p=0.0007). Stated differently, prior to ethanol exposure, animals with high WM MRS intensity are likely to drink more than those with low MRS intensity. However, animals that chose to drink high levels of ethanol do not exhibit sizeable changes in WM MRS intensity, whereas lower-level drinkers exhibit the most dramatic increases in WM MRS intensity.
The contrasting reactions to ethanol exposure for the four animals with the most extreme (two highest and two lowest) drinking patterns, are shown in Figure 3A. In the Figure 3 plots, data are color-coded according to mean daily intake. As shown in Figure 3A, two heavy drinkers (4.1 and 3.7 g/kg/day, red data values) have relatively constant WM MRS intensity over the course of the experiment, whereas two light drinkers (0.3 and 0.5 g/kg/day, black data values) show relatively strong dependencies of WM MRS intensity on cumulative ethanol exposure levels. In order to incorporate the data from all four experimental time points into the two outcomes relevant to WM MRS intensity, intensity vs. cumulative ethanol exposure data from each monkey were fitted to a line. The intercepts of these lines are plotted vs. cumulative intake at 15 months in Figure 3B. The positive correlation (r=0.66, p=0.003) revealed in Figure 3B expresses the reduced likelihood of monkeys with low baseline WM MRS intensity to become heavy drinkers. The slopes of the fitted lines are plotted vs. cumulative intake at 15 months in Figure 3C. The negative correlation (r=−0.79, p=0.0001) expresses the larger sensitivity of WM MRS intensity to ethanol exposure in light drinkers relative to heavy drinkers.
Figure 3.
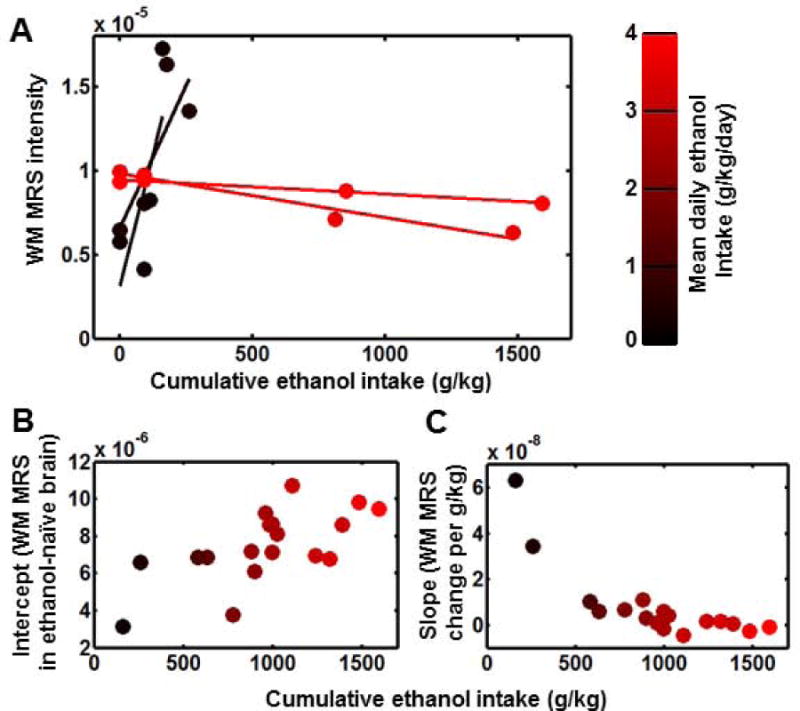
The relationship between drinking behavior and ethanol MRS intensity changes in WM. (A) WM MRS intensity as a function of cumulative ethanol intake for two heaviest (red) and two lightest (black) drinkers of the 18 monkeys over the course of the experiment. Data values for each monkey are fitted to linear expressions, as illustrated by the solid lines. (B) and (C) are intercepts and slopes, respectively, of the resulting lines are plotted as a function of cumulative ethanol intake. For all panels, data are color-coded by mean daily ethanol intake as shown in the color scale.
Discussion
In this longitudinal study, we have found that long-term ethanol exposure is associated with changes in the brain T2-weighted ethanol methyl 1H MRS signal intensity, observed following intravenous injection of a 1 g/kg ethanol dose. Specifically, MRS intensity is larger following chronic exposure to ethanol than it was when the brain was ethanol-naive. This finding is consistent with previous ethanol 1H MRS studies, including a cross-sectional study in which higher ethanol MRS intensity was observed in heavy versus light drinkers (Chiu et al., 1994), a report that the ethanol MRS intensity increases with repeated exposure in dog brain (Moxon et al., 1991), and a report that the ethanol 1H methyl signal is larger in brain extracts of rats previously exposed to ethanol than in control extracts (Govindaraju et al., 1997). Since these earlier reports however, the importance of accounting for differences in ethanol MRS intensity between GM and WM, due to variation in T2 within these environments, has become recognized (Sammi et al., 2000). Therefore, we have incorporated image segmentation procedures (Flory et al., 2010; Hetherington et al., 1994; 1996; Sammi et al., 2000) into our analysis. Interestingly, although the MRS intensity was found to increase within both tissue sub-types over the course of the experiment, the effect of chronic ethanol exposure on MRS intensity is not identical in GM and WM. Notably, the MRS intensity changes in GM are observed across the 18 animals relatively early in our experiment, after all monkeys drank 90 g/kg ethanol over a 3-month period; and subsequent increases in GM MRS intensity are not observed over the next year of ethanol self-administration. In contrast, MRS intensity in WM exhibits significant drinking-dependent variation both in the ethanol-naive state, and following ethanol exposure. Further, WM MRS intensity changes evolve over the course of exposure to higher levels of ethanol than necessary to produce GM intensity changes.
As described by Sammi and co-workers (Sammi et al., 2000), a relatively small percentage change in T2 could produce a large change in MRS intensity, due to the small T2 value relative to TE values typically utilized for in vivo MRS studies. If we assume the GM and WM ethanol 1H T2 is 110 ms and 57 ms, respectively, in naïve monkeys (as was determined in human social drinkers at 4T (Mason et al., 2005)), the MRS intensity changes between the 0 and 15 months time points would be realized by modest changes in T2 values to 146 ms and 65 ms for GM and WM, respectively. In the context of fast two-site exchange between macromolecule-bound and unbound ethanol, the ethanol T2 within a tissue type is the population-weighted average
| [10] |
in which Pbound + Punbound = 1. Taking the T2 of ethanol within CSF of 300 ms (Mason et al., 2005) as an estimate of , and a conservative estimate of 1 ms for (see the discussion of (Fein and Meyerhoff, 2000), for example), the observed MRS intensity changes could result from very subtle changes in Pbound from 1.4% to 1.2% within WM, and 0.58% to 0.35% within GM. An alternate potential interpretation could be that the ethanol MRS intensity changes arise from increased brain ethanol equilibrium concentration (e.g., increased ρGM and ρWM) following chronic ethanol exposure, perhaps as a consequence of cellular-level anatomical changes, or possibly through alterations to the rate of ethanol metabolism in the presence of isoflurane anesthesia. However, compared to the relatively small changes in bound ethanol that could underlie the MRS intensity changes we observe, we consider changes in total ethanol concentration unlikely, because ρGM would have to increase by 47% to produce the GM MRS intensity change from prior to induction to the average value following induction. Such a large change would be unexpected following only 3 months of ethanol exposure, for example, dendritic spine density is only apparent in select brain regions after >20 months of ethanol self-administration (Cuzon Carlson et al., 2011). To definitively distinguish spin relaxation/biochemical effects from ethanol concentration/anatomical effects, it would be necessary to measure the ethanol 1H methyl T2 using a technique to decouple the methyl and methylene 1H nuclei (Sammi et al., 2000). Such measurements were not pursued in this study due to technical challenges associated with pulse sequence design and changes in MRS intensity due to reductions in the brain ethanol concentration over the ~30 minute period of time necessary to perform relaxation measurements.
Demonstration of ethanol MRS intensity changes within GM is significant because ethanol MRS intensity changes have previously been interpreted to arise from interactions with biological membranes (Chiu et al., 1994; Kaufman et al., 1996), and specifically relate to changes in membrane fluidity (Ellingson et al., 1988; Taraschi et al., 1986). The results shown here indicate that ethanol/macromolecular interactions within GM, potentially at sites involved in synaptic contacts, are affected by chronic ethanol exposure.
Previously, the brain ethanol MRS intensity has been proposed to relate to tolerance to intoxicating effects (Chiu et al., 1994; Kaufman et al., 1996). Specifically, higher MRS intensity was proposed to be associated with higher tolerance. However, in the previous studies it has been difficult to disentangle tolerance with the effects of exposure, because members of “tolerant” experimental groups have invariably had greater exposure to ethanol than the “nontolerant” group members. Further, the effects of ethanol drinking on WM and GM MRS intensities have not been studied separately prior to this study. Innate tolerance, on the other hand, is defined as a preexisting biological state conferring resistance to the effects of ethanol (Khanna et al., 1985), and has been identified as a phenotype associated with heightened risk for subsequent heavy alcohol use (Li, 2000; Schuckit, 1994; 2000). In this context, the observed correlation between WM MRS intensity in the ethanol-naive state and subsequent drinking is consistent with the previously proposed relationship between MRS intensity and innate tolerance (Chiu et al., 1994; 2004). We further note that, although Chiu and co-workers (2004) were unable to observe correlations between brain ethanol MRS intensity and an outcome the authors associated with innate tolerance (paternal history of alcoholism), it is possible that the GM/WM segmentation procedures used in this study provided added requisite sensitivity to detect this association in our sample.
In contrast to the expected relationship observed between WM MRS intensity in naïve animals and subsequent drinking, the pattern of change in MRS intensity with ethanol exposure was surprising. Specifically, WM MRS intensity changes in heavy-drinking animals were smaller than changes in light-drinking animals (e.g. Figs. 3a, c). An additional factor that may be of relevance to both the propensity to become a heavy drinker and WM MRS intensity change is the age in which the animals began drinking. Age is negatively correlated with cumulative intake throughout the experiment (for age at time point zero vs. cumulative intake; r=−.71, p=0.001), indicating that the younger animals at the onset of alcohol drinking had a higher propensity to become heavy drinkers. Thus, the combined effects of ethanol exposure and age on WM MRS intensity are such that older animals tend to be lighter drinkers than younger animals, yet the WM MRS intensity changes more with ethanol exposure in older animals than younger ones. If WM MRS intensity changes are associated with aversive effects of ethanol exposure, such as ethanol-induced WM damage, it is possible that susceptibility to such damage increases with age over the range examined in this study, which in turn may limit voluntary intakes of ethanol.
In spite of the age-dependent WM MRS intensity change with ethanol exposure, ethanol WM MRS intensity itself was not observed to depend on age in the absence of sustained ethanol exposure over the age range examined here. The ethanol-naïve animals were between 6.1 and 10.4 years of age at the beginning of the experiment, and at this initial experimental time point, age was not significantly correlated with WM MRS intensity (r=−0.21, p=0.41). A relationship between age and WM MRS intensity prior to ethanol exposure was not expected, because this period approximately corresponds to a human young to early middle age adulthood (Andersen et al., 1999), which is a time in which WM maturation is nearly complete (Lebel et al., 2008), yet changes associated with normal and/or pathological aging have yet to begin (Kochunov et al., 2012; Pfefferbaum et al., 1992). Therefore, although age may be related to the susceptibility to ethanol-induced WM damage and the propensity to drink large quantities of ethanol, age does not directly underlie the variation in WM MRS intensity reported here.
In summary, we have demonstrated that the ethanol methyl 1H MRS signal intensity is characteristically different in white vs. gray matter, and is differentially affected by ethanol exposure. Specifically, ethanol MRS intensity increases with ethanol self-administration in both WM and GM with different time-courses of adaptation. Monkeys that became heavy drinkers showed initially high WM MRS intensity values, and a resistance to change in WM ethanol MRS intensity upon subsequent ethanol exposure. The pattern observed within WM exhibits notable similarities to previous models of innate and acquired tolerance to ethanol, and its role in conferring risk for future heavy drinking.
Supplementary Material
Acknowledgments
This research was supported by the following:
R21 AA018039 (CDK), U01 AA13510 (KAG) P51 RR000163 (CDK and KAG)
References
- Adalsteinsson E, Sullivan EV, Mayer D, Pfefferbaum A. In vivo quantification of ethanol kinetics in rat brain. Neuropsychopharmacology. 2006;31:2683–2691. doi: 10.1038/sj.npp.1301023. [DOI] [PubMed] [Google Scholar]
- Andersen AH, Zhang Z, Zhang M, Gash DM, Avison MJ. Age-associated changes in rhesus CNS composition identified by MRI. Brain Res. 1999;829:90–98. doi: 10.1016/s0006-8993(99)01343-8. [DOI] [PubMed] [Google Scholar]
- Bendszus M, Weijers HG, Wiesbeck G, Warmuth-Metz M, Bartsch AJ, Engels S, Boning J, Solymosi L. Sequential MR imaging and proton MR spectroscopy in patients who underwent recent detoxification for chronic alcoholism: correlation with clinical and neuropsychological data. Ajnr. 2001;22:1926–1932. [PMC free article] [PubMed] [Google Scholar]
- Benjamini Y, Hochberg Y. Controlling the false discovery rate: A practical and powerful approach to multiple testing. J Roy Stat Soc Ser B. 1995;57:289–300. [Google Scholar]
- Chiu TM, Mendelson JH, Sholar MB, Mutschler NH, Wines JD, Hesselbrock VM, Mello NK. Brain alcohol detectability in human subjects with and without a paternal history of alcoholism. J Stud Alcohol. 2004;65:16–21. doi: 10.15288/jsa.2004.65.16. [DOI] [PubMed] [Google Scholar]
- Chiu TM, Mendelson JH, Woods BT, Teoh SK, Levisohn L, Mello NK. In vivo proton magnetic resonance spectroscopy detection of human alcohol tolerance. Magn Reson Med. 1994;32:511–516. doi: 10.1002/mrm.1910320414. [DOI] [PubMed] [Google Scholar]
- Cuzon Carlson VC, Seabold GK, Helms CM, Garg N, Odagiri M, Rau AR, Daunais J, Alvarez VA, Lovinger DM, Grant KA. Synaptic and morphological neuroadaptations in the putamen associated with long-term, relapsing alcohol drinking in primates. Neuropsychopharmacology. 2011;36:2513–2528. doi: 10.1038/npp.2011.140. [DOI] [PMC free article] [PubMed] [Google Scholar]
- De Graaf RA. In vivo NMR spectroscopy: principles and techniques. 2. John Wiley & Sons; Chichester, West Sussex, England; Hoboken, NJ: 2007. [Google Scholar]
- Ellingson JS, Taraschi TF, Wu A, Zimmerman R, Rubin E. Cardiolipin from ethanol-fed rats confers tolerance to ethanol in liver mitochondrial membranes. Proc Natl Acad Sci USA. 1988;85:3353–3357. doi: 10.1073/pnas.85.10.3353. [DOI] [PMC free article] [PubMed] [Google Scholar]
- Fein G, Meyerhoff DJ. Ethanol in human brain by magnetic resonance spectroscopy: Correlation with blood and breath levels, relaxation, and magnetization transfer. Alcohol Clin Exp Res. 2000;24:1227–1235. [PMC free article] [PubMed] [Google Scholar]
- Flory GS, O’Malley J, Grant KA, Park B, Kroenke CD. Quantification of ethanol methyl (1)H magnetic resonance signal intensity following intravenous ethanol administration in primate brain. Methods (San Diego, Calif) 2010;50:189–198. doi: 10.1016/j.ymeth.2009.12.004. [DOI] [PMC free article] [PubMed] [Google Scholar]
- Gomez R, Behar KL, Watzl J, Weinzimer SA, Bulanski B, Sanacora G, Koretski J, Guidone E, Jiang L, Petrakis IL, Pittman B, Krystal JH, Mason GF. Intravenous ethanol infusion decreases human cortical gamma-aminobutyric acid and N-acetalaspartate as measured with proton magnetic resonance spectroscopy at 4 Tesla. Biol Psychiatry. 2012;71:239–246. doi: 10.1016/j.biopsych.2011.06.026. [DOI] [PMC free article] [PubMed] [Google Scholar]
- Govindaraju V, Meyerhoff DJ, Maudsley AA, Vermathen M, Weiner MW. Effects of brain membranes on 1H nuclear magnetic resonance signal intensity of ethanol in vitro. Alcohol Alcohol. 1997;32:671–681. doi: 10.1093/oxfordjournals.alcalc.a008317. [DOI] [PMC free article] [PubMed] [Google Scholar]
- Grant KA. Emerging neurochemical concepts in the actions of ethanol at ligand-gated ion channels. Behav Pharmacol. 1994;5:383–404. doi: 10.1097/00008877-199408000-00003. [DOI] [PubMed] [Google Scholar]
- Grant KA, Leng X, Green HL, Szeliga KT, Rogers LS, Gonzales SW. Drinking typography established by scheduled induction predicts chronic heavy drinking in a monkey model of ethanol self-administration. Alcohol Clin Exp Res. 2008;32:1824–1838. doi: 10.1111/j.1530-0277.2008.00765.x. [DOI] [PMC free article] [PubMed] [Google Scholar]
- Hanstock CC, Rothman DL, Shulman RG, Novotny EJ, Jr, Petroff OA, Prichard JW. Measurement of ethanol in the human brain using NMR spectroscopy. J Stud Alcohol. 1990;51:104–107. doi: 10.15288/jsa.1990.51.104. [DOI] [PubMed] [Google Scholar]
- Harris RA, Trudell JR, Mihic SJ. Ethanol’s molecular targets. Science signaling. 2008;1:re7. doi: 10.1126/scisignal.128re7. [DOI] [PMC free article] [PubMed] [Google Scholar]
- Hetherington HP, Mason GF, Pan JW, Ponder SL, Vaughan JT, Twieg DB, Pohost GM. Evaluation of cerebral gray and white matter metabolite differences by spectroscopic imaging at 4.1T. Magn Reson Med. 1994;32:565–571. doi: 10.1002/mrm.1910320504. [DOI] [PubMed] [Google Scholar]
- Hetherington HP, Pan JW, Mason GF, Adams D, Vaughn MJ, Twieg DB, Pohost GM. Quantitative 1H spectroscopic imaging of human brain at 4.1 T using image segmentation. Magn Reson Med. 1996;36:21–29. doi: 10.1002/mrm.1910360106. [DOI] [PubMed] [Google Scholar]
- Hetherington HP, Telang FW, Pan JW, Sammi MK, Schuhlein D, Molina PE, Volkow ND. Spectroscopic imaging of the uptake kinetics of human brain ethanol. Magn Reson Med. 1999;42:1019–1026. doi: 10.1002/(sici)1522-2594(199912)42:6<1019::aid-mrm5>3.0.co;2-y. [DOI] [PubMed] [Google Scholar]
- Kalant H. Absorption, diffusion, distribution, and elimination of ethanol: effects on biological membranes. In: KISSIN H, BEGLEITER H, editors. The Biology of Alcoholism, Vol 1, Biochemistry, The Biology of Alcoholism, Vol 1, Biochemistry. Plenum; New York: 1971. pp. 1–62. [Google Scholar]
- Kaufman MJ, Chiu TM, Mendelson JH, Woods BT, Mello NK, Lukas SE, Fivel PA, Wighton LG. In vivo proton magnetic resonance spectroscopy of alcohol in rhesus monkey brain. Magn Reson Imaging. 1994;12:1245–1253. doi: 10.1016/0730-725x(94)90089-a. [DOI] [PubMed] [Google Scholar]
- Kaufman MJ, Chiu TM, Mendelson JH, Woods BT, Teoh SK, Eros-Sarnyai M, Mercer G, Mello NK. Brain alcohol detectability increase with repeated administration in humans: a proton spectroscopy study. Magn Reson Med. 1996;35:435–440. doi: 10.1002/mrm.1910350323. [DOI] [PubMed] [Google Scholar]
- Khanna JM, Le AD, LeBlanc AE, Shah G. Initial sensitivity versus acquired tolerance to ethanol in rats selectively bred for ethanol sensitivity. Psychopharmacology. 1985;86:302–306. doi: 10.1007/BF00432218. [DOI] [PubMed] [Google Scholar]
- Kochunov P, Williamson DE, Lancaster J, Fox P, Cornell J, Blangero J, Glahn DC. Fractional anisotropy of water diffusion in cerebral white matter across the lifespan. Neurobiol Aging. 2012;33:9–20. doi: 10.1016/j.neurobiolaging.2010.01.014. [DOI] [PMC free article] [PubMed] [Google Scholar]
- Lebel C, Walker L, Leemans A, Phillips L, Beaulieu C. Microstructural maturation of the human brain from childhood to adulthood. NeuroImage. 2008;40:1044–1055. doi: 10.1016/j.neuroimage.2007.12.053. [DOI] [PubMed] [Google Scholar]
- Li TK. Pharmacogenetics of responses to alcohol and genes that influence alcohol drinking. J Stud Alcohol. 2000;61:5–12. doi: 10.15288/jsa.2000.61.5. [DOI] [PubMed] [Google Scholar]
- Mason G, Bendszus M, Meyerhoff D, Hetherington H, Schweinsburg B, Ross B, Taylor M, Krystal J. Magnetic resonance spectroscopic studies of alcoholism: from heavy drinking to alcohol dependence and back again. Alcohol Clin Exp Res. 2005;29:150–158. doi: 10.1097/01.alc.0000150010.72739.58. [DOI] [PubMed] [Google Scholar]
- Mendelson JH, Woods BT, Chiu TM, Mello NK, Lukas SE, Teoh SK, Sintavanarong P, Cochin J, Hopkins MA, Dobrosielski M. In vivo proton magnetic resonance spectroscopy of alcohol in human brain. Alcohol. 1990;7:443–447. doi: 10.1016/0741-8329(90)90030-g. [DOI] [PubMed] [Google Scholar]
- Meyerhoff DJ, Blumenfeld R, Truran D, Lindgren J, Flenniken D, Cardenas V, Chao LL, Rothlind J, Studholme C, Weiner MW. Effects of heavy drinking, binge drinking, and family history of alcoholism on regional brain metabolites. Alcohol Clin Exp Res. 2004;28:650–661. doi: 10.1097/01.ALC.0000121805.12350.CA. [DOI] [PMC free article] [PubMed] [Google Scholar]
- Meyerhoff DJ, Rooney WD, Tokumitsu T, Weiner MW. Evidence of multiple ethanol pools in the brain: an in vivo proton magnetization transfer study. Alcohol Clin Exp Res. 1996;20:1283–1288. doi: 10.1111/j.1530-0277.1996.tb01124.x. [DOI] [PubMed] [Google Scholar]
- Moxon LN, Rose SE, Haseler LJ, Galloway GJ, Brereton IM, Bore P, Doddrell DM. The visibility of the 1H NMR signal of ethanol in the dog brain. Magn Reson Med. 1991;19:340–348. doi: 10.1002/mrm.1910190225. [DOI] [PubMed] [Google Scholar]
- Mugler JP, 3rd, Brookeman JR. Three-dimensional magnetization-prepared rapid gradient-echo imaging (3D MP RAGE) Magn Reson Med. 1990;15:152–157. doi: 10.1002/mrm.1910150117. [DOI] [PubMed] [Google Scholar]
- Petroff OA, Novotny EJ, Ogino T, Avison M, Prichard JW. In vivo measurements of ethanol concentration in rabbit brain by 1H magnetic resonance spectroscopy. J Neurochem. 1990;54:1188–1195. doi: 10.1111/j.1471-4159.1990.tb01947.x. [DOI] [PubMed] [Google Scholar]
- Pfefferbaum A, Lim KO, Zipursky RB, Mathalon DH, Rosenbloom MJ, Lane B, Ha CN, Sullivan EV. Brain gray and white matter volume loss accelerates with aging in chronic alcoholics: A quantitative MRI study. Alcohol Clin Exp Res. 1992;16:1078–1089. doi: 10.1111/j.1530-0277.1992.tb00702.x. [DOI] [PubMed] [Google Scholar]
- Pietrzykowski AZ, Treistman SN. The molecular basis of tolerance. Alcohol Res Health. 2008;31:298–309. [PMC free article] [PubMed] [Google Scholar]
- Quertemont E, Green HL, Grant KA. Brain ethanol concentrations and ethanol discrimination in rats: effects of dose and time. Psychopharmacology. 2003;168:262–270. doi: 10.1007/s00213-003-1437-7. [DOI] [PubMed] [Google Scholar]
- Raichle ME, Eichling JO, Straatmann MG, Welch MJ, Larson KB, Ter-Pogossian MM. Blood-brain barrier permeability of 11C-labeled alcohols and 15O-labeled water. Am J Physiol. 1976;230:543–552. doi: 10.1152/ajplegacy.1976.230.2.543. [DOI] [PubMed] [Google Scholar]
- Rooney WD, Johnson G, Li X, Cohen ER, Kim SG, Ugurbil K, Springer CS., Jr Magnetic field and tissue dependencies of human brain longitudinal 1H2O relaxation in vivo. Magn Reson Med. 2007;57:308–318. doi: 10.1002/mrm.21122. [DOI] [PubMed] [Google Scholar]
- Sammi MK, Pan JW, Telang FW, Schuhlein D, Molina PE, Volkow ND, Springer CS, Hetherington HP. Measurements of human brain ethanol T2 by spectroscopic imaging at 4T. Magn Reson Med. 2000;44:35–40. doi: 10.1002/1522-2594(200007)44:1<35::aid-mrm7>3.0.co;2-g. [DOI] [PubMed] [Google Scholar]
- Schuckit MA. Low level of response to alcohol as a predictor of future alcoholism. Am J Psychiatry. 1994;151:184–189. doi: 10.1176/ajp.151.2.184. [DOI] [PubMed] [Google Scholar]
- Schuckit MA. Biological phenotypes associated with individuals at high risk for developing alcohol-related disorders. Part 2. Addict Biol. 2000;5:23–36. doi: 10.1080/13556210071243. [DOI] [PubMed] [Google Scholar]
- Schweinsburg BC, Alhassoon OM, Taylor MJ, Gonzalez R, Videen JS, Brown GG, Patterson TL, Grant I. Effects of alcoholism and gender on brain metabolism. Am J Psychiatry. 2003;160:1180–1183. doi: 10.1176/appi.ajp.160.6.1180. [DOI] [PubMed] [Google Scholar]
- Spielman DM, Glover GH, Macovski A, Pfefferbaum A. Magnetic resonance spectroscopic imaging of ethanol in the human brain: a feasibility study. Alcohol Clin Exp Res. 1993;17:1072–1077. doi: 10.1111/j.1530-0277.1993.tb05666.x. [DOI] [PubMed] [Google Scholar]
- Taraschi TF, Ellingson JS, Wu A, Zimmerman R, Rubin E. Membrane tolerance to ethanol is rapidly lost after withdrawal: a model for studies of membrane adaptation. Proc Natl Acad Sci USA. 1986;83:3669–3673. doi: 10.1073/pnas.83.11.3669. [DOI] [PMC free article] [PubMed] [Google Scholar]
- Vivian JA, Green HL, Young JE, Majerksy LS, Thomas BW, Shively CA, Tobin JR, Nader MA, Grant KA. Induction and maintenance of ethanol self-administration in cynomolgus monkeys (Macaca fascicularis): Long-term characterization of sex and individual differences. Alcohol Clin Exp Res. 2001;25:1087–1097. [PubMed] [Google Scholar]
- Yuan C, O’Connell RJ, Wilson A, Pietrzykowski AZ, Treistman SN. Acute alcohol tolerance is intrinsic to the BKCa protein, but is modulated by the lipid environment. The J Biol Chem. 2008;283:5090–5098. doi: 10.1074/jbc.M708214200. [DOI] [PMC free article] [PubMed] [Google Scholar]
- Zahr NM, Mayer D, Vinco S, Orduna J, Luong R, Sullivan EV, Pfefferbaum A. In vivo evidence for alcohol-induced neurochemical changes in rat brain without protracted withdrawal, pronounced thiamine deficiency, or severe liver damage. Neuropsychopharmacology. 2009;34:1427–1442. doi: 10.1038/npp.2008.119. [DOI] [PMC free article] [PubMed] [Google Scholar]
Associated Data
This section collects any data citations, data availability statements, or supplementary materials included in this article.