

Abstract
The large number of primary Spanish speakers both in the United States and the world makes it imperative that appropriate neuropsychological assessment instruments be available to serve the needs of these populations. In this article we describe the norming process for Spanish speakers from the U.S.–Mexico border region on the Brief Visuospatial Memory Test-revised and the Hopkins Verbal Learning Test-revised. We computed the rates of impairment that would be obtained by applying the original published norms for these tests to raw scores from the normative sample, and found substantial overestimates compared to expected rates. As expected, these overestimates were most salient at the lowest levels of education, given the under-representation of poorly educated subjects in the original normative samples. Results suggest that demographically corrected norms derived from healthy Spanish-speaking adults with a broad range of education, are less likely to result in diagnostic errors. At minimum, demographic corrections for the tests in question should include the influence of literacy or education, in addition to the traditional adjustments for age. Because the age range of our sample was limited, the norms presented should not be applied to elderly populations.
Keywords: Cross-cultural assessment, Spanish, Hispanic, Learning, Memory, Ethnic differences
1. Introduction
Culturally and linguistically appropriate assessment of cognitive functioning is necessary for the competent delivery of neuropsychological services as well as for the reliability of research results in ethnically diverse populations. Spanish is among the four most commonly spoken languages in the world, with an estimated 350 million primary speakers (Answers.com, 2005), and is the second most spoken language in the United States, where Hispanics constitute 13% of the population. According to the year 2000 U.S. population census, over 28 million people speak Spanish at home, and half of these report speaking English less than very well (US Census Bureau, 2000).
Despite the large number of primary Spanish speakers both in the U.S. and the world, the availability of neuropsychological assessment instruments validated for use with Spanish-speaking populations remains limited. Driven by the need to assess cognitive functioning in Spanish speakers from the United States–Mexico border region, we undertook a normative study of a large battery of tests with this population. In this article, we focus on the development of norms for Spanish-speakers on two widely used tests of learning and memory: the Brief Visuospatial Memory Test-revised (BVMT-R) (Benedict, 1997) and the Hopkins Verbal Learning Test-revised (HVLT-R) (Brandt & Benedict, 2001).
The BVMT-R requires reproduction of the features and spatial placement of two-dimensional geometric figures. The existing BVMT-R was standardized and normed with 588 healthy English-speaking adults ranging in age from 18 to 79 years (M = 38.6, S.D. = 18.0), with a mean education of 13.4 years (S.D. = 1.8). The sample was 64.5% female and predominantly Caucasian (82%), with small proportions of African Americans (14.5%) and other ethnic groups (3.6%). Hierarchical polynomial regression analyses were used to determine the effects of age, gender, and education on test performance. The investigators concluded that education and gender did not influence test results, and as such, the standard T-scores generated for the BVMT-R correct only for age. Although the education range was not described, the high mean education value for the normative sample suggests that the range was limited at the low end. As such, the existing norms may overestimate impairment among those with low levels of education.
The original English language HVLT-R normative sample consisted of 1,179 adults (75% women), ranging in age from 15 to 92 years (M = 59.0, S.D. = 18.6), and education between 2 and 20 years (M = 13.4 years, S.D. = 2.9). Recruitment source and ethnic composition of the sample were not described. Participants were reportedly free of neurologic or psychiatric disorders. Stepwise multiple regressions were used to examine the influence of age, education, and gender on the four primary HVLT-R variables: total recall, delayed recall, percent retained, and the Recognition Discrimination Index. The authors found age to have the largest effect, accounting for 19% of the variance, but no significant contribution of education or gender. Despite the broad education range, the high mean education level for the normative group suggests that higher levels of education were also overrepresented in the normative sample for the HVLT-R.
The general literature concerning demographic effects on neuropsychological test performance shows that results on both verbal and nonverbal cognitive tests are significantly related to demographic factors (Perkins & Deregowski, 1982; Pineda et al., 2000), with literacy and/or level of education playing a prominent role (Ardila, 2000; Byrd, Jacobs, Hilton, Stern, & Manly, 2005; Heaton, Grant, & Matthews, 1991; Manly et al., 1999). Because education is compulsory in the U.S. until age 16, it is difficult to find neurologically normal volunteers for normative studies in this country that represent the lowest levels of education (e.g., less than 9 years). Thus, neuropsychological instruments normed with populations who are traditionally amenable to research (e.g., college students, middle class whites) may not display significant education effects, and therefore may overdiagnose abnormality in persons with low education.
In addition to literacy and educational experience, test performance may be influenced by other factors associated with cultural diversity, such as degree of acculturation (Coffey, Marmol, Schock, & Adams, 2005; Manly et al., 1998; Ostrosky-Solis, Ramirez, & Ardila, 2004; Pontón, 2001), comfort with the testing situation (Ardila, Rodríguez-Menéndez, & Roselli, 2002; Helms, 2005), intellectual richness of the developmental environment, nutrition, etc. Given that lower educational attainment, poorer quality of education, and poorer developmental milieu are more prevalent among the socioeconomically disadvantaged, who in the U.S. are often members of ethnic minorities and persons born elsewhere, existing norms for the BVMT-R, HVLT-R, and many other commonly used instruments may not account sufficiently for demographic factors that can confound interpretation of test results.
In this article, we describe the creation of norms for the BVMT-R and the HVLT-R with a sample of primary Spanish speakers from the U.S.–Mexico border regions of San Diego, California and Tucson, Arizona. We show that application of the existing published norms results in inadequate specificity in this population, particularly among those with low levels of education.
2. Method
2.1. Subjects
The normative sample consisted of 127 (73 women, 54 men) native Spanish speakers of Mexican descent from the U.S.–Mexico border regions of Arizona and California. Study participants responded to flyers or direct contact with recruiters in community settings. They were selected on the basis of having reason to spend time in the United States on a regular basis (e.g., for work, school, place of residence). All participants responded to a language use questionnaire to determine that Spanish was their preferred language. Additionally, the Controlled Oral Word Association Test (Benton & Hamsher, 1989) was administered in both languages (PMR in Spanish, FAS in English) to confirm language proficiency. On average, participants generated 39 (S.D. = 13) words in PMR compared to 18 (S.D. = 14) words in FAS, with a mean difference between the two measures of 21 (S.D. = 12) words. Subjects were carefully screened to ensure that they had no significant history of neurologic, metabolic, psychiatric, developmental, or substance abuse problems. In order to obtain a representative sample, efforts were made to recruit participants into equal sized cells according to gender as well as pre-set age and education ranges. The resulting sample ranged in age from 20 to 55 years (M = 37.5, S.D. = 9.42) with educational attainment between 0 and 20 years (M = 9.75, S.D. = 4.35). As the BVMT-R and HVLT-R were introduced later in the course of the normative study, the resulting sample for these tests happened to have a larger proportion of women. Two subjects did not have valid data for the HVLT-R.
2.2. Procedure
Participants received the BVMT-R and HVLT-R as part of a larger battery of neuropsychological tests. Testing was performed in Spanish by trained bilingual psychometrists using standardized procedures. The entire neuropsychological battery took approximately 5–6 h to administer, with a number of breaks built into the testing session. Scoring was done according to the guidelines detailed in the published manuals for each measure. An independent examiner verified the scoring of the test protocol prior to entry into a database.
2.3. Measures
Instructions for both tests were translated into Spanish, followed by the use of standard back translation methods. Stimulus words for the HVLT-R were translated from the English if the resulting word was generally equivalent in both languages. In cases where direct translation was inappropriate (e.g., if there is no equivalent word in Spanish, or if the frequency in the language is substantially different), a comparable word was chosen from the same semantic category. We determined the comparability of stimulus words, as well as test instructions, by first obtaining the opinions of bilingual native Spanish speakers from different countries (Argentina, Colombia, Cuba, Mexico, Puerto Rico, Spain) to ensure that the language was neutral across Spanish-speaking regions and that word frequencies appeared comparable in their experience. In addition, we employed two available word frequency dictionaries that were published in the same decade (Juilland & Chang-Rodriguez, 1964; Kucera & Francis, 1967) to verify that occurrence of stimulus words was generally comparable1. In all, only two words were considered inappropriate for direct translation. In Form A, “tent” was replaced by “mansion” because there are a number of correct translations for the word depending on country of origin. In Form B, “bourbon” was replaced with “tequila” because the former is not readily translatable or typically used in Spanish.
The BVMT-R consists of a page containing six geometric designs that are presented to the subject for three immediate recall trials, a delayed free recall trial, a recognition trial, and a copy trial to rule out visual defects. There are six equivalent forms of the BVMT-R. In this study, participants were randomly assigned to receive Form 1 (n = 65) or Form 2 (n = 62). To ensure scoring consistency, all test protocols were re-scored by an independent examiner using the guidelines in the published manual as well as additional guidelines for each figure that were developed locally in order to standardize scoring. These additional guidelines were reviewed and approved by Dr. Benedict, author of the BVMT-R.
The HVLT-R consists of a list of 12 nouns that belong in equal numbers to three semantic categories. There are six forms of this test, each employing different semantic categories. Although Spanish language versions were created for all six forms of the HVLT-R, only Forms A (n = 65) and B (n = 60) were administered to the normative sample, on a random selection basis. As in the BVMT-R, there are three learning trials, delayed free recall, and recognition components.
For both the BVMT-R and HVLT-R, the outcome measures presented are as follows:
Total recall: The sum of all valid items generated across learning trials 1–3.
Delayed recall: The number of valid items generated after a delay (trial 4).
Percent retained: Delayed recall score divided by the higher of trial 2 or 3 × 100.
Recognition Discrimination Index: True positive responses minus false positive responses.
3. Data analysis
3.1. Generation of normative T-scores
Raw BVMT-R and HVLT-R scores were converted into normal quantiles and standardized. Standardized scores were then converted into scaled scores with a mean of 10 and standard deviation of 3. Fractional polynomial multiple regression equations were used to determine the influence of age, education, and gender on the outcomes of interest. These analyses were performed with the Stata statistical package (StataCorp., 2004) employing the method explained by Royston and Altman (1994). This approach uses iterative algorithms to indicate the level of influence that transformed combinations of predictors with predetermined powers (−2, −1, −0.5, 0, 0.5, 1, 2, 3) might have. These non-positive and fractional powers are commonly used transformations in data analysis and are a good practical compromise, providing reasonable flexibility in fitting models with curvature. Further, it can be shown that powers excluded from the enumerated set can be well approximated by those in the set when a fractional polynomial of degree ≥2 is considered (Ambler & Royston, 2001). The residuals from these equations are then converted to T-scores (M = 50, S.D. = 10). Even though this method is meant to ensure the absence of main effects or interactions with the demographic variables, checks were made to verify that this was true with the newly derived T-scores. Only those predictors that accounted for significant variance were included in the final T-score equations.
3.2. Comparisons between published and newly derived norms
T-scores were computed for the raw test scores using the published BVMT-R and HVLT-R norms. Rates of “impairment” obtained in the normative sample, using the published norms, were compared to expected scores based on the new norms. For the purposes of this study, participants who obtained a T-score of 39 or less were classified as impaired and conversely those who obtained a score of 40 or higher were classified as normal. This one standard deviation cutpoint is the same as was employed in the English language normative samples for these tests to denote borderline-mildly impaired performance (Benedict, 1997; Shapiro, Benedict, Schretlen, & Brandt, 1999). In addition, this cutpoint has been shown to provide an optimal balance between sensitivity and specificity in large normative populations such as those for tests in the Expanded Halstead-Reitan Battery (Heaton & Taylor, 2004) and the WAIS-III/WMS-III (Taylor & Heaton, 2002). Rates of “impairment” were also compared at different levels of education. The sample was stratified into four levels of education guided by the landmarks of the Mexican educational system: 6 or fewer years of education: “Primaria” (n = 37), 7–9 years: “Secundaria” (n = 28), 10–12 years: “Bachillerato/Preparatoria” (n = 33) and 13 or more years of education: “Superior” (n = 29). Table 1 shows the demographic composition of the normative sample stratified by educational level.
Table 1.
Demographic composition of the normative sample stratified by education
| Years of education groups
|
||||
|---|---|---|---|---|
| ≤ 6 (n = 36) | 7–9 (n = 26) | 10–12 (n = 33) | ≥ 13 (n = 30) | |
| Age, mean (S.D.) years | 39.4 (9.0) | 38.5 (8.8) | 34.7 (9.6) | 38.5 (9.5) |
| Education, mean (S.D.) years | 4.5 (1.6) | 8.5 (0.6) | 11.6 (0.7) | 15.6 (1.6) |
| % Female | 55 | 70 | 57 | 60 |
4. Results
4.1. Application of the existing norms to the Spanish-speaking sample
T-scores were computed for the raw scores of the Spanish-speaking normative sample using the original published norms for the BVMT-R and HVLT-R, and rates of impaired performances were calculated. T-scores lower than one standard deviation below the mean (<40) were considered impaired, as explained above. As required by the normalized distribution of T-scores, it would be expected that approximately 15–16% of the sample should fall within the impaired range. In the original normative study of the BVMT-R, 14% of their English speaking sample fell in the impaired range using the one standard deviation cutpoint. Similarly, a validation study of the HVLT-R showed that the one standard deviation cutpoint displayed 85% sensitivity and 76% specificity (Shapiro et al., 1999).
The proportion of the Spanish speaking normative sample classified as impaired by the BVMT-R total recall T-score using the original norms was 38%. The proportion considered impaired on delayed recall was 26% (as compared to the expected 15%). Similarly, the proportion of the sample that obtained scores in the impaired range using the published HVLT-R norms was 44% on total recall and 42% on delayed recall.
Examination of the relationship between test scores and education suggests that the published norms for these two tests are least adequate when applied to subjects in the lower education levels, while departures from the expected 15–16% rate of impairment generally diminish with increasing education. On the BVMT-R, impairment rates on total recall were 68% for the group with ≤6 years of education, 46% in the group with 7–9 years, 27% in the group with 10–12 years and 3% in the group with at least some college. Delayed recall showed a somewhat similar pattern: 57% in the group with ≤6 years, but rather equivalent proportions in the rest of the groups: 7–9: 17%, 10–12: 15%, and ≥13: 6%. On the HVLT-R, the proportion of participants considered impaired in total recall was 72% for the group with ≤6 years of education, 37% in the group with 7–9 years, 27% in the group with 10–12 years and 34% in those with 13 or more years. Thus, although the largest overestimate was in the lowest education group, rates of misclassification in the rest of the sample were still double the expected rate of 15%. The results for HVLT-R delayed recall also showed higher than expected rates in all groups: ≤6: 72%, 7–9: 41%, 10–12: 27%, ≥ 13: 24%.
4.2. Raw to scaled score conversions
Table 2 details the range of raw scores obtained by the normative sample on each of the outcome measures of the BVMT-R and HVLT-R. There were no significant differences in the demographic composition or raw scores of the participants who received the alternate forms of each test (see Table 3). The relationship between raw test scores and demographic variables for the sample as a whole is shown in Table 4. There was a small effect of age on most of the BVMT-R scores, but age was related only to the Recognition Discrimination Index of the HVLT-R. There were large education effects for both tests, and no gender effects for either test.
Table 2.
Mean, standard deviation, and range of the BVMT-R and HVLT-R raw scores for the whole sample
| BVMT-R
|
HVLT-R
|
|||||||
|---|---|---|---|---|---|---|---|---|
| Mean | S.D. | Min | Max | Mean | S.D. | Min | Max | |
| Total recall | 22.3 | 7.4 | 3 | 36 | 25.2 | 4.3 | 16 | 35 |
| Delayed recall | 9.1 | 2.8 | 1 | 12 | 8.4 | 2.4 | 0 | 12 |
| Percent retained | 93.2 | 12.4 | 33 | 100 | 83.5 | 18.2 | 0 | 100 |
| Discrimination Index | 5.4 | 1.0 | 1 | 6 | 10 | 1.6 | 5 | 12 |
Table 3.
Demographic characteristic and raw scores of participants who received alternate forms of the BVMT-R and HVLT-R
| BVMT-R
|
HVLT-R
|
|||||
|---|---|---|---|---|---|---|
| Form 1 n = 65 | Form 2 n = 62 | p | Form A n = 65 | Form B n = 60 | p | |
| Age, mean (S.D.) | 37.4 (9.9) | 37.6 (9.0) | NS | 37.6 (9.8) | 37.4 (9.1) | NS |
| Education, mean (S.D.) | 9.5 (4.4) | 10.0 (4.3) | NS | 9.4 (4.4) | 10.1 (4.3) | NS |
| Gender, n (%) female | 37 (57%) | 36 (58%) | NS | 37 (55%) | 36 (60%) | NS |
| Total recall, mean (S.D.) | 21.8 (6.9) | 22.9 (8.0) | NS | 25.2 (4.2) | 25.3 (4.5) | NS |
| Delayed recall, mean (S.D.) | 9.0 (3.0) | 9.3 (2.7) | NS | 8.3 (2.3) | 8.5 (2.5) | NS |
| Percent retained, mean (S.D.) | 91.2 (14.5) | 95.5 (9.1) | .05 | 83.0 (17.5) | 84.1 (19.1) | NS |
| Discrimination Index, mean (S.D.) | 5.4 (0.9) | 5.4 (1.1) | NS | 10.4 (1.6) | 10.6 (1.6) | NS |
Table 4.
Relationship between raw test scores and demographic variables
| Age correlation
|
Education correlation
|
Gender mean (S.D.)
|
|||||
|---|---|---|---|---|---|---|---|
| r | p | r | p | Men | Women | p | |
| BVMT-R | |||||||
| Total recall | −0.20 | 0.023 | 0.59 | <0.001 | 22.10 (7.46) | 22.49 (7.46) | NS |
| Delayed recall | −0.23 | 0.008 | 0.57 | <0.001 | 9.40 (2.77) | 8.95 (2.86) | NS |
| Percent retained | −0.07 | NS | 0.36 | <0.001 | 95.05 (12.88) | 91.92 (11.89) | NS |
| Discrimination Index | −0.15 | 0.091 | 0.46 | <0.001 | 5.48 (0.86) | 5.32 (1.05) | NS |
| HVLT-R | |||||||
| Total recall | −0.14 | NS | 0.36 | <0.001 | 24.94 (4.47) | 25.44 (4.29) | NS |
| Delayed recall | −0.03 | NS | 0.43 | <0.001 | 8.22 (2.64) | 8.50 (2.27) | NS |
| % Retained | −0.04 | NS | 0.33 | 0.001 | 83.43 (19.40) | 83.60 (17.41) | NS |
| Discrimination Index | −0.24 | 0.008 | 0.36 | 0.001 | 10.32 (1.69) | 10.65 (1.50) | NS |
Table 5 shows the raw-to-scaled score conversions for the BVMT-R and HVLT-R total and delayed recall. Given the limited range and skewed distribution of scores for the percent retained and Recognition Discrimination Index of both tests, these measures were not used to generate T-scores and are expressed instead as percentile ranks (see Table 6).
Table 5.
Raw-to-scaled score conversion for the BVMT-R and HVLT-R total and delayed recall
| Scaled | BVMT-R
|
HVLT-R
|
||
|---|---|---|---|---|
| Total recall raw | Delayed recall raw | Total recall raw | Delayed recall raw | |
| 17 | 36 | 35–36 | ||
| 16 | 34–35 | 34 | 12 | |
| 15 | 33 | 12 | 32–33 | |
| 14 | 31–32 | 31 | 11 | |
| 13 | 29–30 | 11 | 30 | |
| 12 | 27–28 | 28–29 | 10 | |
| 11 | 25–26 | 10 | 27 | |
| 10 | 22–24 | 9 | 25–26 | 9 |
| 9 | 20–21 | 8 | 23–24 | 8 |
| 8 | 16–19 | 6–7 | 22 | 7 |
| 7 | 13–15 | 4–5 | 20–21 | 6 |
| 6 | 10–12 | 3 | 19 | 5 |
| 5 | 6–9 | 2 | 18 | 4 |
| 4 | 4–5 | 0–1 | 17 | 2–3 |
| 3 | 0–3 | 0–16 | 0–1 | |
Table 6.
BVMT-R and HVLT-R raw score to percentile conversions for percent retained and Recognition Discrimination Index
| BVMT-R
|
HVLT-R
|
||||||
|---|---|---|---|---|---|---|---|
| Percentile | Percent retained | Percentile | Discrimination Index | Percentile | Percent retained | Percentile | Discrimination Index |
| ≥35 | 100 | ≥38 | 6 | ≥70 | 100 | ≥69 | 12 |
| 34≤ to <35 | 96–99 | 18≤ to <38 | 5 | 69≤ to <70 | 99 | 39≤ to <69 | 11 |
| 33≤ to <34 | 92–95 | 6≤ to <18 | 4 | 68≤ to <69 | 92–98 | 21≤ to <39 | 10 |
| 28≤ to <33 | 91 | 2≤ to <6 | 3 | 61≤ to <68 | 91 | 14≤ to <21 | 9 |
| 25≤ to <28 | 90 | 1≤ to <2 | 1–2 | 54≤ to <61 | 90 | 12≤ to <14 | 8 |
| 21≤ to <25 | 89 | 48≤ to <54 | 89 | 2≤ to <12 | 7 | ||
| 18≤ to <21 | 88 | 47≤ to <48 | 88 | 1≤ to <2 | 5–6 | ||
| 17≤ to <18 | 86–87 | 42≤ to <47 | 83–87 | <1 | <5 | ||
| 16≤ to <17 | 80–85 | 35≤ to <42 | 82 | ||||
| 12≤ to <16 | 79 | 32≤ to <35 | 80–81 | ||||
| 11≤ to <12 | 78 | 30≤ to <32 | 78–79 | ||||
| 10≤ to <11 | 75–77 | 29≤ to <30 | 77 | ||||
| 8≤ to <10 | 73–74 | 23≤ to <29 | 75–76 | ||||
| 7≤ to <8 | 71–72 | 21≤ to <23 | 73–74 | ||||
| 6≤ to <7 | 68–70 | 20≤ to <21 | 72 | ||||
| 5≤ to <6 | 61–67 | 19≤ to <20 | 71 | ||||
| 4≤ to <5 | 60 | 14≤ to <19 | 70 | ||||
| 3≤ to <4 | 58–59 | 13≤ to <14 | 68–69 | ||||
| 2≤ to <3 | 53–57 | 10≤ to <13 | 67 | ||||
| 1≤ to <2 | 38–52 | 9≤ to <10 | 60–66 | ||||
| <1 | 37 | 8≤ to <9 | 57–59 | ||||
| 7≤ to <8 | 56 | ||||||
| 5≤ to <7 | 50–55 | ||||||
| 3≤ to <5 | 40–49 | ||||||
| 2≤ to <3 | 20–29 | ||||||
| 1≤ to <2 | 0–19 | ||||||
4.3. T-score equations
T-score values for the outcomes with adequate distributional properties (total recall and delayed recall) were obtained by applying the fractional polynomial equations with weights for age, education, and gender. Demographic variables that did not account for significant variance were omitted from the final equations. It was verified that the resulting T-scores had a mean of 50 and S.D. of 10. The range T-scores for BVMT-R total recall was between 25 and 72, and for delayed recall between 27 and 72. On the HVLT-R, the range of T-scores for total recall was between 28 and 77, and for delayed recall between 26 and 72. Pairwise correlations showed no significant relationship between the resulting T-scores and age or education for any of the outcomes. Men and women obtained comparable means. The T-score equations used to compute individual T-scores are listed below.
Figs. 1 and 2 illustrate the difference between rates of impairment on the BVMT-R and HVLT-R total recall measure obtained with the original norms versus the actual rates using the newly derived norms.
Fig. 1.

Rates of impairment on BVMT-R total recall based on a one standard deviation cutpoint.
Fig. 2.
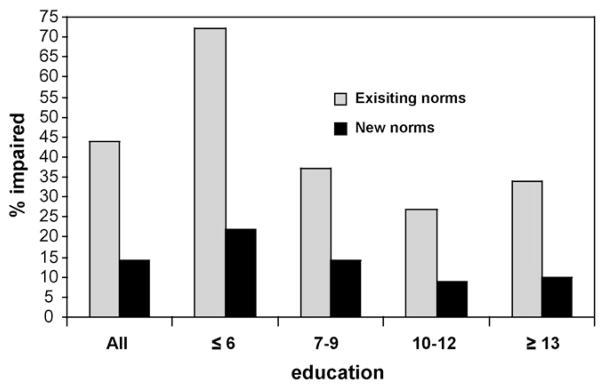
Rates of impairment on the HVLT-R total recall based on a one standard deviation cutpoint.
5. Discussion
Application of published test norms for the BVMT-R and HVLT-R to a sample of neurologically normal Spanish speakers resulted in high rates of misclassification. The existing norms were particularly inadequate at the lower levels of education, where up to two thirds of participants with 6 or fewer years of education fell within the impaired range, using a cutpoint of one standard deviation below the mean. These results are not surprising, given that persons with very low education were not well represented in the original normative samples for these tests. In a number of the outcome measures, the rates of misclassification approached or went below the 15–16% expected base rate in the groups with higher levels education. In others, however, the rates of impairment remained elevated even among participants with at least high school education. This suggests that while level of education was a very important predictor of test performance, other unmeasured factors may also play a role.
Contrary to the findings in the original normative studies for the BVMT-R and HVLT-R (as well as for many other learning and memory tests), effects of age were not salient in our study. Just as the limited education range precluded finding relationships between education and test performance in the original normative studies, so did the limited age range in our study result in the inability to detect effects of this variable. The test manuals for the existing BVMT-R and HVLT-R show that performance declines are not very evident until after about age 70. Thus, it is not surprising that we did not find age effects, as the upper age in our study was 55. Given this limitation, it is not recommended that the norms for Spanish speakers generated in our study be applied to older persons.
As has been reported for other instruments, the results of the present study illustrate that in order to avoid diagnostic errors, culturally and linguistically appropriate norms must be applied that, at minimum, correct not only for age but also for level of education or literacy. Rates of “misdiagnosis” on the BVMT-R and HVLT-R were comparably remediated by applying the norms derived from Spanish speakers with a broad range of education, reinforcing the notion that demographic influences are not limited to verbally based tests (Ellis & Deregowski, 1981; Matute, Leal, Zarabozo, Robles, & Cedillo, 2000; Ostrosky-Solis, Efron, & Yund, 1991).
Some have argued that it is impractical to produce norms for every specific population (Bagley, 1995; Fullilove, 1998), and moreover, defining populations based on racial, ethnic, or national groups may not capture the critical factors that influence test performance (Marcopulos & McLain, 2003). Such broad ethnic or geographic groupings require an assumption of experiential (or even biologic) homogeneity that is often not accurate in real populations and therefore unlikely to account reliably for variance in test scores. Still, when faced with the need to provide neuropsychological assessment for someone living outside his or her sociocultural context, we are challenged to find methods for adapting our instruments in ways that are relevant to the individual being tested and for interpreting the result of such testing.
While few solutions are currently available that can be applied broadly in research or clinical settings, the accumulating body of work in the field will continue to yield promising information about the variables that most affect performance on cognitive tests. Among these, exposure to, and quality of formal education have been shown to play an important role in observed differences in test performance between and within ethnic groups (Manly, Jacobs, Touradji, Small, & Stern, 2002; Ostrosky-Solis, Ardila, Rosselli, Lopez-Arango, & Uriel-Mendoza, 1998). In the current study, we were unable to distinguish the influence of each possible demographic variable in correcting the rate of misdiagnosis. While we did not collect a direct measure of literacy, we were able to show that accounting for years of education provides a significant improvement in the interpretation of test results. Other aspects, such as degree of acculturation and socioeconomic condition may contribute to the correction that was generally afforded by using norms developed on the appropriate population. While the norming approach is cumbersome and imperfect, findings continue to show that appropriately validated instruments and norms provide improved diagnostic accuracy (Heaton & Taylor, 2004; Lucas et al., 2005; Manly et al., 2002; Norman, Evans, Miller, & Heaton, 2000). This translates into better quality of care in culturally diverse populations.
Although our study is limited by a relatively small sample size, we were able to enroll a demographically diverse cohort and collect a great deal of background information. Thus, in future publications we will attempt to distill sociodemographic influences on NP performance beyond the traditional age, gender, and education corrections. In addition, results from this study will need to be validated for specificity in independent samples of normal volunteers, as well as for sensitivity to brain dysfunction in patient groups.
In sum, although there has been increasing interest and research in cross-cultural neuropsychology (Ardila, 1995; Ostrosky-Solis et al., 1985; Pontón, 2001; Rosselli et al., 2002) much work remains in order to accomplish an adequate compendium of instruments that are validated for use with Spanish speakers (Artiola i Fortuny & Mullaney, 1997; Pontón & Ardila, 1999 ; Rey, Feldman, Rivas-Vazquez, Levin, & Benton, 1999). Research and development of neuropsychological measures must take into account demographic and background variables that may impact performance in normal Spanish speaking adults. Age and education have been considered for some time, as these have shown clear relationships with NP performance among English (Heaton et al., 1991) and Spanish speakers (Artiola i Fortuny, Heaton, & Hermosillo, 1998; Pineda et al., 2000; Rosselli, Ardila, Bateman, & Guzman, 2001). Factors such as culture and acculturation, ethnicity, and literacy level, have started to receive closer attention in the last several years. These variables, along with language proficiency, must be incorporated when designing neuropsychological instruments or employing them in research and clinical settings. In addition, because Spanish speakers are not a culturally or linguistically homogeneous group, ideal instruments should endeavor to achieve cultural and linguistic “neutrality” if they are to be generalized to the various Spanish speaking national and sociodemographic groups.
Acknowledgments
The authors gratefully acknowledge the efforts of our research volunteers and staff, as well as and grant support from the National Institute of Mental Health (MH62512 HIV Neurobehavioral Research Center). The San Diego HIV Neurobehavioral Research Center (HNRC) group is affiliated with the University of California, San Diego; Naval Medical Center, San Diego; and the Veterans Administration San Diego Healthcare System. The San Diego HIV Neurobehavioral Research Center (HNRC) group includes Igor Grant, MD, Director; J. Allen McCutchan, MD, Co-Director; Thomas D. Marcotte, PhD, Center Manager; Ronald J. Ellis, MD, P.I. Neuromedical Core; Robert K. Heaton, PhD, P.I. Neurobehavioral Core; Terry Jernigan, PhD, P.I. Imaging Core; Eliezer Masliah, MD, P.I. Neuropathology Core; Anthony Gamst, PhD, P.I. Data Management Component; and Ian Abramson, PhD, P.I. Statistics Unit.
Footnotes
It should be noted that available word frequency dictionaries use varying techniques in the calculation of word usage, including the sources and time periods that sample texts are selected from (e.g., classic novels, sports writing), as well as the geographic regions sampled. Thus, direct comparison between dictionaries is difficult. Moreover, the reliability and reproducibility of published frequencies across and within geographic regions and time periods has not been reported to our knowledge. For these reasons, we favored the opinions of contemporary bilingual speakers and considered Spanish vs. English word frequencies within 50 occurrences per million words to be adequately comparable. The dictionaries we employed reported the occurrence of the most common 5000–6000 words per approximately half a million or one million words. Words that did not appear in the dictionaries were presumed to be of low frequency in the language.
References
- Ambler G, Royston P. Fractional polynomial model selection procedures: Investigation of type I error rate. Journal of Statistical Computing Simulation. 2001;69:89–108. [Google Scholar]
- Answers.com. List of languages by total speakers. 2005 from http://www.answers.com/topic/list-of-languages-by-total-speakers.
- Ardila A. Directions of research in cross-cultural neuropsychology. Journal of Clinical and Experimental Neuropsychology. 1995;17(1):143–150. doi: 10.1080/13803399508406589. [DOI] [PubMed] [Google Scholar]
- Ardila A. Cognitive evaluation in illiterate persons. Revista de Neurologia. 2000;30(5):465–468. [PubMed] [Google Scholar]
- Ardila A, Rodríguez-Menéndez G, Roselli M. Current isuses in neuropsychological assessment with Hispanics/Latinos. In: Ferraro FR, editor. Minority and cross-cultural aspects of neuropsychological assessment. Lisse: Swets & Zeitlinger B.V; 2002. pp. 160–179. [Google Scholar]
- Artiola i Fortuny L, Heaton RK, Hermosillo D. Neuropsychological comparisons of Spanish-speaking participants from the U.S.–Mexico border region versus Spain. Journal of International Neuropsychological Society. 1998;4(4):363–379. [PubMed] [Google Scholar]
- Artiola i Fortuny L, Mullaney HA. Neuropsychology with Spanish speakers: Language use and proficiency issues for test development. Journal of Clinical and Experimental Neuropsychology. 1997;19(4):615–622. doi: 10.1080/01688639708403747. [DOI] [PubMed] [Google Scholar]
- Bagley C. A plea for ignoring race and including insured status in American research reports on social science and medicine. Social Science and Medicine. 1995;40(8):1017–1019. doi: 10.1016/0277-9536(94)00318-n. [DOI] [PubMed] [Google Scholar]
- Benedict R. Brief Visuospatial Memory Test-revised. Odessa, FL: Psychological Assessment Resources, Inc; 1997. [Google Scholar]
- Benton A, Hamsher K. Multilingual aphasia examination. Ioawa City: AJA Associates; 1989. [Google Scholar]
- Brandt J, Benedict R. Hopkins Verbal Learning Test-revised. Lutz, FL: Psychological Assessment Resources, Inc; 2001. [Google Scholar]
- Byrd DA, Jacobs DM, Hilton HJ, Stern Y, Manly JJ. Sources of errors on visuoperceptual tasks: Role of education, literacy, and search strategy. Brain and Cognition. 2005;58(3):251–257. doi: 10.1016/j.bandc.2004.12.003. [DOI] [PubMed] [Google Scholar]
- Coffey DM, Marmol L, Schock L, Adams W. The influence of acculturation on the Wisconsin card sorting test by Mexican Americans. Archives for Clinical Neuropsychology. 2005;20(6):795–803. doi: 10.1016/j.acn.2005.04.009. [DOI] [PubMed] [Google Scholar]
- Deregowski JB. Implicit-shape constancy: A cross-cultural comparison. Perception. 1976;5(3):343–348. doi: 10.1068/p050343. [DOI] [PubMed] [Google Scholar]
- Ellis HD, Deregowski JB. Within-race and between-race recognition of transformed and untransformed faces. The American Journal of Psychology. 1981;94(1):27–35. [PubMed] [Google Scholar]
- Fullilove MT. Comment: Abandoning “race” as a variable in public health research—An idea whose time has come. American Journal of Public Health. 1998;88(9):1297–1298. doi: 10.2105/ajph.88.9.1297. [DOI] [PMC free article] [PubMed] [Google Scholar]
- Heaton RK, Grant I, Matthews CG. Comprehensive norms for an Expanded Halstead-Reitan Battery: Demographic corrections, research findings, and clinical applications. Odessa, FL: Psychological Assessment Resources, Inc; 1991. [Google Scholar]
- Heaton RK, Taylor M. Revised comprehensive norms for and Expanded Halstead-Reitan Battery: Demographically adjusted neurpsychological norms for African American and Caucasian adults. Lutz, FL: Psychological Assessment Resources, Inc; 2004. [Google Scholar]
- Helms JE. Stereotype threat might explain the Black-White test-score difference. The American Psychologist. 2005;60(3):269–270. doi: 10.1037/0003-066X.60.3.269. discussion 271–262. [DOI] [PubMed] [Google Scholar]
- Juilland A, Chang-Rodriguez E. Frequency dictionary of Spanish words. The Hague: Mouton & Co; 1964. [Google Scholar]
- Kucera H, Francis WN. Computational analysis of present-day American English. Providence, RI: Brown University Press; 1967. [Google Scholar]
- Lucas JA, Ivnik RJ, Willis FB, Ferman TJ, Smith GE, Parfitt FC, et al. Mayo’s older African Americans normative studies: Normative data for commonly used clinical neuropsychological measures. The Clinical Neuropsychologist. 2005;19(2):162–183. doi: 10.1080/13854040590945265. [DOI] [PubMed] [Google Scholar]
- Manly JJ. Advantages and disadvantages of separate norms for African Americans. The Clinical Neuropsychologist. 2005;19(2):270–275. doi: 10.1080/13854040590945346. [DOI] [PubMed] [Google Scholar]
- Manly JJ, Miller SW, Heaton RK, Byrd D, Reilly J, Velasquez RJ, et al. The effect of African-American acculturation on neuropsychological test performance in normal and HIV-positive individuals. Journal of International Neuropsychological Society. 1998;4(3):291–302. [PubMed] [Google Scholar]
- Manly JJ, Jacobs DM, Sano M, Bell K, Merchant CA, Small SA, et al. Effect of literacy on neuropsychological test performance in nondemented, education-matched elders. Journal of International Neuropsychological Society. 1999;5(3):191–202. doi: 10.1017/s135561779953302x. [DOI] [PubMed] [Google Scholar]
- Manly JJ, Jacobs DM, Touradji P, Small SA, Stern Y. Reading level attenuates differences in neuropsychological test performance between African American and White elders. Journal of International Neuropsychological Society. 2002;8(3):341–348. doi: 10.1017/s1355617702813157. [DOI] [PubMed] [Google Scholar]
- Marcopulos B, McLain C. Are our norms “normal”? A 4-year follow-up study of a biracial sample of rural elders with low education. The Clinical Neuropsychologist. 2003;17(1):19–33. doi: 10.1076/clin.17.1.19.15630. [DOI] [PubMed] [Google Scholar]
- Matute E, Leal F, Zarabozo D, Robles A, Cedillo C. Does literacy have an effect on stick construction tasks? Journal of International Neuropsychological Society. 2000;6(6):668–672. doi: 10.1017/s1355617700666043. [DOI] [PubMed] [Google Scholar]
- Norman MA, Evans JD, Miller WS, Heaton RK. Demographically corrected norms for the California verbal learning test. Journal of Clinical and Experimental Neuropsychology. 2000;22(1):80–94. doi: 10.1076/1380-3395(200002)22:1;1-8;FT080. [DOI] [PubMed] [Google Scholar]
- Ostrosky-Solis F, Canseco E, Quintanar L, Navarro E, Meneses S, Ardila A. Sociocultural effects in neuropsychological assessment. The International Journal of Neuroscience. 1985;27(1–2):53–66. doi: 10.3109/00207458509149134. [DOI] [PubMed] [Google Scholar]
- Ostrosky-Solis F, Efron R, Yund EW. Visual detectability gradients: Effect of illiteracy. Brain and Cognition. 1991;17(1):42–51. doi: 10.1016/0278-2626(91)90065-g. [DOI] [PubMed] [Google Scholar]
- Ostrosky-Solis F, Ardila A, Rosselli M, Lopez-Arango G, Uriel-Mendoza V. Neuropsychological test performance in illiterate subjects. Archives for Clinical Neuropsychology. 1998;13(7):645–660. doi: 10.1093/arclin/13.7.645. [DOI] [PubMed] [Google Scholar]
- Ostrosky-Solis F, Ramirez M, Ardila A. Effects of culture and education on neuropsychological testing: A preliminary study with indigenous and nonindigenous population. Applied Neuropsychology. 2004;11(4):188–195. doi: 10.1207/s15324826an1104_3. [DOI] [PubMed] [Google Scholar]
- Perkins DN, Deregowski JB. A cross-cultural comparison of the use of a Gestalt perceptual strategy. Perception. 1982;11(3):279–286. doi: 10.1068/p110279. [DOI] [PubMed] [Google Scholar]
- Pineda DA, Rosselli M, Ardila A, Mejia SE, Romero MG, Perez C. The Boston Diagnostic Aphasia Examination—Spanish version: The influence of demographic variables. Journal of International Neuropsychological Society. 2000;6(7):802–814. doi: 10.1017/s135561770067707x. [DOI] [PubMed] [Google Scholar]
- Pontón M. Research and assessment issues with Hispanic populations. In: Pontón MC, editor. Neuropsychology and the Hispanic patient. Mahwah, NJ: Lawrence Erlbaum Associates; 2001. pp. 39–58. [Google Scholar]
- Pontón MO, Ardila A. The future of neuropsychology with Hispanic populations in the United States. Archives for Clinical Neuropsychology. 1999;14(7):565–580. [PubMed] [Google Scholar]
- Rey GJ, Feldman E, Rivas-Vazquez R, Levin BE, Benton A. Neuropsychological test development and normative data on Hispanics. Archives for Clinical Neuropsychology. 1999;14(7):593–601. [PubMed] [Google Scholar]
- Rosselli M, Ardila A, Bateman JR, Guzman M. Neuropsychological test scores, academic performance, and developmental disorders in Spanish-speaking children. Developmental Neuropsychology. 2001;20(1):355–373. doi: 10.1207/S15326942DN2001_3. [DOI] [PubMed] [Google Scholar]
- Rosselli M, Ardila A, Salvatierra J, Marquez M, Matos L, Weekes VA. A cross-linguistic comparison of verbal fluency tests. The International Journal of Neuroscience. 2002;112(6):759–776. doi: 10.1080/00207450290025752. [DOI] [PubMed] [Google Scholar]
- Royston P, Altman GG. Regression using fractional polynomials of continuous covariates: Parsimonious parametric modeling. Applied Statistics. 1994;43:429–467. [Google Scholar]
- Shapiro AM, Benedict RH, Schretlen D, Brandt J. Construct and concurrent validity of the Hopkins Verbal Learning Test-revised. The Clinical Neuropsychologist. 1999;13(3):348–358. doi: 10.1076/clin.13.3.348.1749. [DOI] [PubMed] [Google Scholar]
- StataCorp. Stata Statistical Software (Version 8.2 for Windows) Station, TX: Stata Corporation; 2004. [Google Scholar]
- Taylor MJ, Heaton RK. Sensitivity and specificity of WAIS-III/WMS-III demographically corrected factor scores in neuropsychological assessment. Journal of International Neuropsychological Society. 2002;7:867–874. [PubMed] [Google Scholar]
- US Census Bureau. American fact finder. 2000 from http://factfinder.census.gov/home/saff/main.html?lang=en.