Abstract
The innovations in mass spectrometry-based investigations in proteome biology enable systematic characterization of molecular details in pathophysiological phenotypes. However, the process of delineating large-scale raw proteomic datasets into a biological context requires high-throughput data acquisition and processing. A spectral library search engine makes use of previously annotated experimental spectra as references for subsequent spectral analyses. This workflow delivers many advantages, including elevated analytical efficiency and specificity as well as reduced demands in computational capacity. In this study, we created a spectral matching engine to address challenges commonly associated with a library search workflow. Particularly, an improved sliding dot product algorithm, that is robust to systematic drifts of mass measurement in spectra, is introduced. Furthermore, a noise management protocol distinguishes spectra correlation attributed from noise and peptide fragments. It enables elevated separation between target spectral matches and false matches, thereby suppressing the possibility of propagating inaccurate peptide annotations from library spectra to query spectra. Moreover, preservation of original spectra also accommodates user contributions to further enhance the quality of the library. Collectively, this search engine supports reproducible data analyses using curated references, thereby broadening the accessibility of proteomics resources to biomedical investigators.
Keywords: Error Propagation Control, Library Searching, Noise Control, Sliding Dot Product
INTRODUCTION
Proteomics investigations in biology and medicine generate an enormous amount of mass spectra daily worldwide [1, 2]; specialized bioinformatics platform offers access to biological insights embodied in the raw datasets. In proteomic studies, correlating peptide spectra with their sequences is a vital step towards protein characterization. Such a correlation can be established utilizing theoretical spectra, as demonstrated by SEQUEST [3] and Mascot [4], or alternatively, empirical spectra with known peptide identities as a reference [5]. Both approaches exhibit unique strengths and are complementary in nature.
Attributed to its independence from experimental observations, the sequence database search approach has been effective since the past decade, as it catalyzed a wide-acceptance of mass spectrometry-based proteomic investigations [3, 6]. However, this popular approach has several inherent limitations. For example, the size of a theoretical spectral dataset derived from a proteome database is quite large and inflates exponentially when post-translational modifications are considered [7]. The emergence of faster scanning mass spectrometers impose further strains on existing bioinformatics pipelines [8]. Therefore, dedicated high-performance computational workstations become a mandate to confer reasonable analytical efficiency and throughput [9, 10]. The acquisition and maintenance of such platforms also constitute a significant barrier preventing investigators from embracing proteomics science. Furthermore, the lack of a learning capability of the sequence database search workflow leads to repeated misinterpretations of raw spectra.
The application of empirical spectra as reference for peptide identification addresses challenges associated with a sequence database search workflow [2]. The confined search space of the spectral library focuses on subproteome-of-interest, providing superior specificity and sensitivity [11]. Furthermore, the incorporation of spectra from post-translationally modified peptides leads only to a linear increase in dataset volume. More importantly, the spectral library evolves with iterative contributions from the users. Collectively, the workflow of protein characterization with a spectral library reduces demands on both computational hardware and time, minimizing the barrier of proteomic investigations for biologists and clinicians.
Despite many apparent advantages, enthusiasm towards the application of spectral library has been growing at a rather relaxed rate. The reluctance originates from two related processes: the challenges affiliated with library construction and the accuracy of spectral matching. The quality of spectra is defined by the technical proficiency of current mass spectrometry instrumentations. During the process of library construction, the threshold for spectral quality inversely affects its coverage. Admitting spectra of moderate quality may aid the expansion of the coverage at the expense of compromising analytical accuracy. Falsely annotated spectra may contaminate a spectral library and instigate error propagation [6, 12, 13]. Developing computational models to circumvent these issues in a library-directed workflow can significantly improve its utility in proteomics investigations.
In this study, we engineered a new workflow for spectral library construction and spectral matching. Unaltered experimental spectra were collected and compiled into a reference library. In parallel, a noise control spectrum was generated for each reference spectrum collected in this library. Accordingly, this data structure enables a spectral matching algorithm to differentiate peptide fragments and noise in the user spectra, enhancing the accuracy of analyses. This integrated bioinformatics platform demonstrated sound performance in protein characterization through parallel benchmark tests using independent datasets from various instrumentations. Taken together, this workflow mobilizes mass spectra accumulated by the proteomics community, which serves as a foundation for future investigations.
MATERIALS AND METHODS
Collection of Raw Mass Spectra and Spectral Analyses via Sequence Database Search
Peptide spectra previously collected from purified murine 20S proteasome complexes were selected to construct a spectral library [14–16]. The purification procedure [16] isolated both proteasome subunits and their interacting partners [17]. A total of 14 biological sample replicates were analyzed, totaling 190 LC-MS/MS runs. These data have been integrated to construct a spectral library.
Theoretical sequence database search was conducted with a SEQUEST search engine (BioWorks cluster, V3.3) on a Beowulf cluster [18]. The IPI mouse database (V3.47, 55,298 entries) was selected as the reference [19]. Endoproteolytic specificity was set to be semi-tryptic with a maximum of two missed cleavages. 50 ppm was assigned for deviations in peptide precursor masses measured with an LTQ-Orbitrap, and 2 AMU was assigned for deviations in peptide precursor masses measured by an LTQ instrument. Allowance for fragment mass deviation was set at 1 AMU for both cases. Carbamidomethylation on cysteine residues (+57.02146 Da) was set as the static modification; whereas oxidation of methionine residues (+15.9949 Da) and acetylation of protein N-termini (+42.0106 Da) were set as two differential modifications. Scaffold (Proteome Software, V2.0) [20] was applied to filter results at confidence thresholds of 95% for peptides and 99% for proteins. Only proteins with two or more distinct peptides detected were considered as positive identifications.
Design of a Noise Control Spectra System for the Library
To integrate noise information into our spectral library, we created a reference spectral component with negative controls. For every peptide, multiple spectra may exist in the spectral library due to variations in their charge states (e.g., +2 or +3) or modification status (e.g., methionine oxidation). Two spectra were implemented for each combination of charge state and modification status. The first spectrum was an unaltered experimental spectrum, selected according to the highest Xcorr score computed by a sequence database search engine. In parallel, a second spectrum containing only noise peaks was constructed from the first spectrum in silico, which is referred to as the ‘noise control spectrum’ hereafter. Based on the sequence of the assigned peptide, the noise control spectrum was constructed by removing peaks within a ±2 Th window of a-, b- and y- ions and their common neutral loss (-H2O, -NH3) ions from the representative spectrum. Accordingly, an entire collection of representative spectra and their corresponding noise control spectra were created and stored in pairs. A total of 2,476 spectral pairs were compiled in the murine 20S proteasome spectral library. This effort translated experimental data into a reference component for the library.
Development and Implementation of the Spectral Library Search Engine
The library search engine was coded in C# language and compiled with the .Net Framework (V3.5) on a Microsoft Windows platform (http://www.heartproteome.org/COPaClient/Publish.htm). An optimized dot product (DP) algorithm [21] was customized to evaluate spectral matches. An algorithm similar to PeptideProphet was adapted as a statistical model to estimate the accuracy of peptide assignments to tandem mass (MS/MS) spectra. The search engine can either operate as a Microsoft Windows service to handle local requests or function as a web service to process remote analyses. The entire library was mapped to the RAM to ensure rapid retrieval. The current server is supported by 2 six-core CPUs (2.40 GHz), 12 GB RAM, 2 TB hard drive storage and Windows 7 (64-bit) operating system.
Assembly of Test Spectral Datasets
To thoroughly evaluate the applicability of the library search engine, we assembled three distinct query datasets. SDS-PAGE-separated 20S proteasome subunits characterized by LTQ-Orbitrap were used as the first test dataset [15]. Native PAGE-displayed intact complexes analyzed by LCQ-Deca XP formed the second test dataset [16, 18]. In the final test dataset, 20S proteasome components displayed on 2-D PAGE were sequenced by a Q-Star (AB Sciex) instrument [16, 18]. To maintain objectivity, none of the test datasets were included for reference library construction. For the LTQ-Orbitrap and LCQ-Deca XP datasets, SEQUEST was used to conduct sequence database searches using the same parameters as stated before. The Q-Star dataset was analyzed by Mascot (v2.2) with the same set of parameters except with a precursor tolerance of 0.80 Da and a fragment tolerance of 0.80 Da. Scaffold analysis was performed for both as described before.
The library search engine accepts query spectra in mzML format as input [22]; therefore, ProteoWizard converter (v2.1) was used to transform raw spectral files into mzML format [23]. Skyline (V0.7.0.2556) [24] was installed to aid the conversion of Q-Star wiff files into mzML format.
Benchmark of Noise Management Strategy
Publicly accessible datasets [25] were used in these tests. These datasets contained 10 data replicates; each replicate included 12 LC-MS/MS runs. The efficiency of the noise management strategy was benchmarked on the SpectraST algorithm [11] with and without noise control spectra. The tests were designed as follows: data in each replicate was first analyzed by SEQUEST; results were filtered by PeptideProphet. Subsequently, three libraries were constructed, containing 15,231; 19,182; and 24,227 spectra (Table S1). Library search results were processed by PeptideProphet in Trans Proteomics Pipeline (TPP V4.6). Query datasets were also selected from these publicly accessible datasets (Table S1). Source code used for such comparison is provided in the Supplemental Materials.
RESULTS
This investigation included four major components (Fig. S1): (i) the construction of a spectral library with original spectra to provide verifiable references; (ii) the creation of a novel algorithm to elevate the sensitivity of identifications and reduce the propagation of false annotations; (iii) the establishment of a robust workflow to manage fluctuations in mass measurements; and (iv) the implementation of a technological platform to validate the library search engine for peptide identification.
The newly configured library search engine demonstrated convincing sensitivity and specificity in peptide identifications. In particular, the inclusion of noise control spectra system as a negative control effectively distinguished target spectral matches from false positives; a mathematical compensation for deviations in spectral mass measurements within the matching algorithm further reduced the rate of false negative annotations. Collectively, this platform demonstrated broad versatility in analyzing spectra collected by a diverse set of instrumentations.
Sensitive and Specific Peptide Identification with the Noise Control Algorithm
Addressing the issue of false positive annotations introduced by noise peaks is a critical step to achieve accurate peptide identification. Current strategies have focused on building a consensus spectrum by either integrating multiple replicates in the raw datasets [11], or alternatively, selecting the most intense peaks in the library spectra by pre-established criteria [26].
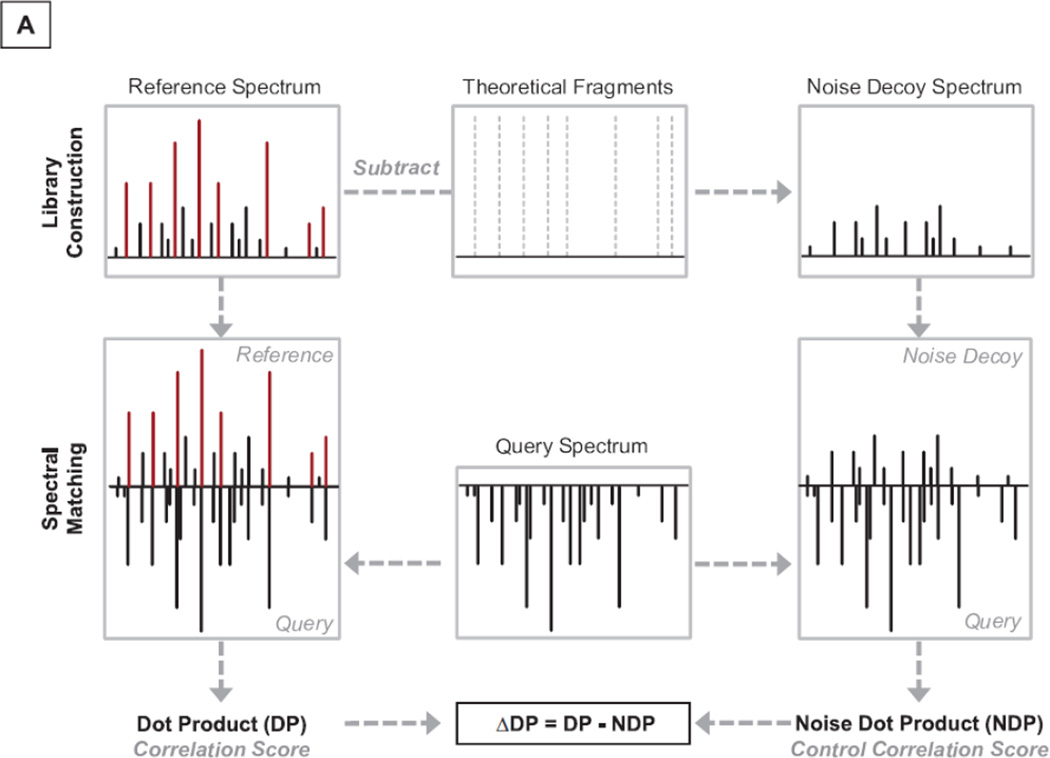
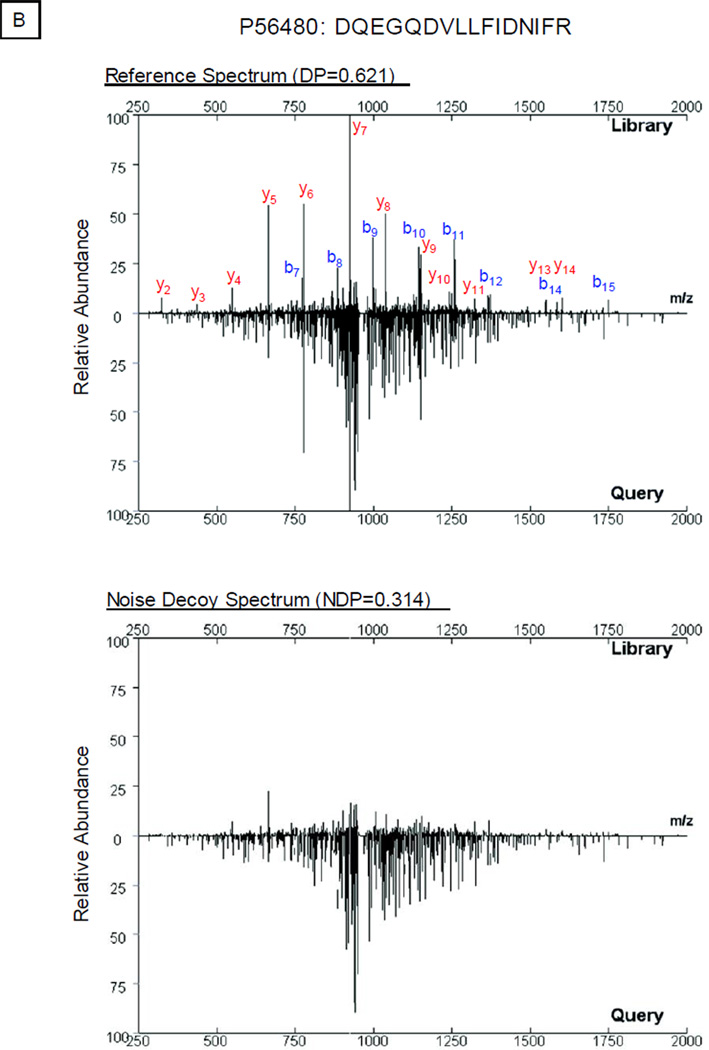
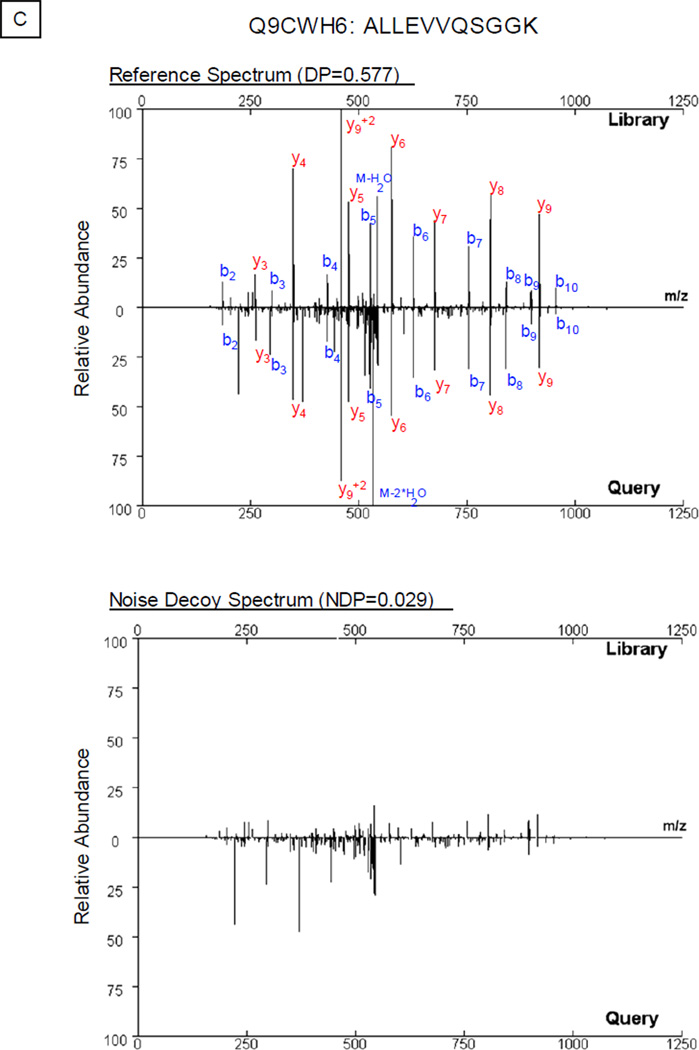
In this study, we developed and tested a new approach to process noise peaks. Along with the compilation of the spectral library, the peptide sequence and charge state for each spectrum were obtained following sequence database search [10]. Thus, the mass-to-charge ratios of characteristic peptide fragments as well as their neutral loss signals can be calculated. After removal of these signals from the original spectrum, a new spectrum was generated comprising of noise peaks (Fig. S2). Dot product (DP) score alone was insufficient for accurate protein identification, as illustrated in Fig. 1. Dot product score evaluated the correlation between two given mass spectra: e.g., the DP in Fig. 1B was 0.621 and the DP in Fig. 1C was 0.577. A higher dot product value generally represented a closer resemblance between the two spectra including contributions from noise. We next examined the contributions from the relevant noise as noise dot product (NDP) scores: e.g., the NDP in Fig. 1B was 0.314 and the NDP in Fig. 1C was 0.029. The final evaluation of the two spectra was computed by subtracting the NDP value from the relevant DP value. With this noise management system, the final scores were adjusted to 0.307 in Fig. 1B and 0.548 in Fig. 1C, which reduced false positive spectral matches introduced by noise peaks; in the examples given above, the two spectra in Fig. 1B were recognized as a false positive match.
Figure 1.
Noise Control Strategy. A. In the library search workflow, a hypothetical query spectrum (center) is screened against a reference spectrum in the library both in its original form (dot product, DP; left) and in the form of its noise control spectrum (noise dot product, NDP; right). The difference between DP and NDP, delta dot product (ΔDP), is computed to evaluate the correlation of the query spectrum to the reference spectrum. B. An example query spectrum was screened against both the original experimental spectrum and its targeted noise control spectrum for peptide DQEGQDVLLFIDNIFR (P56480). The noise signals contributed significantly (NDP=0.314) towards the scoring of the spectral correlation (DP=0.621). C. A query spectrum was compared against the pair of spectra for peptide ALLEVVQSGGK (Q9CWH6). The difference in dot product values (0.577−0.029=0.548) supported assignment of this peptide sequence to the query spectrum.
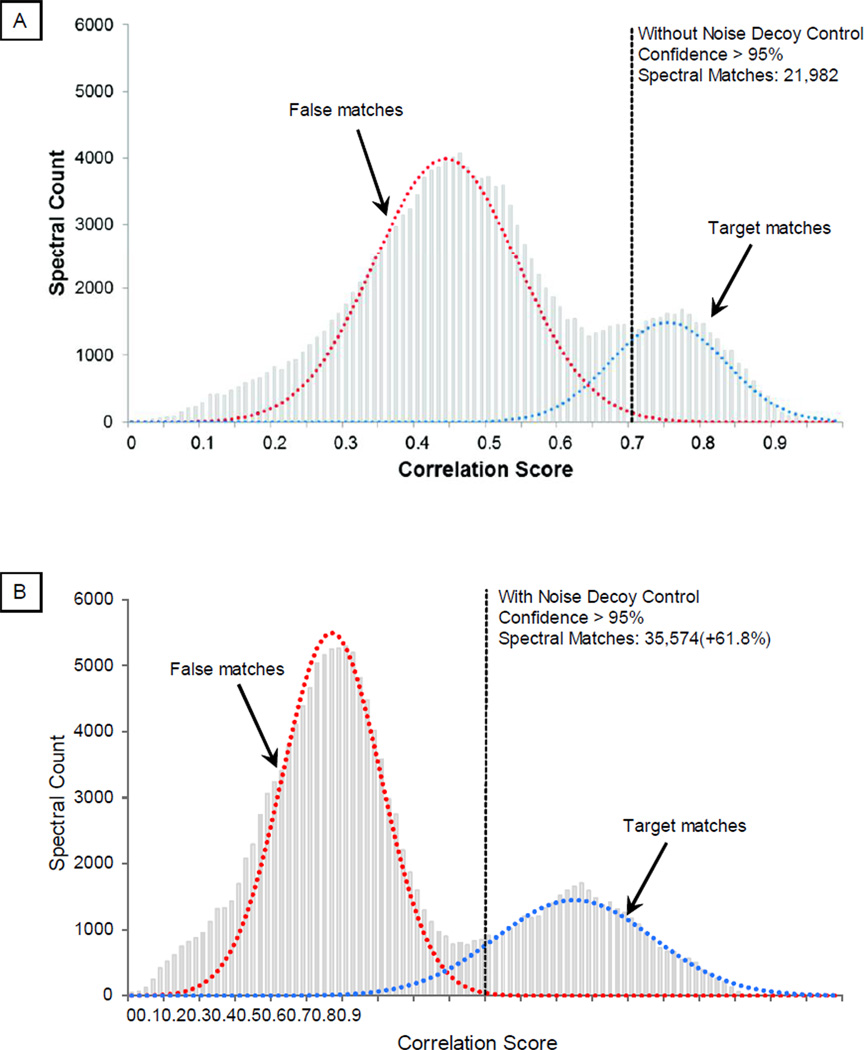
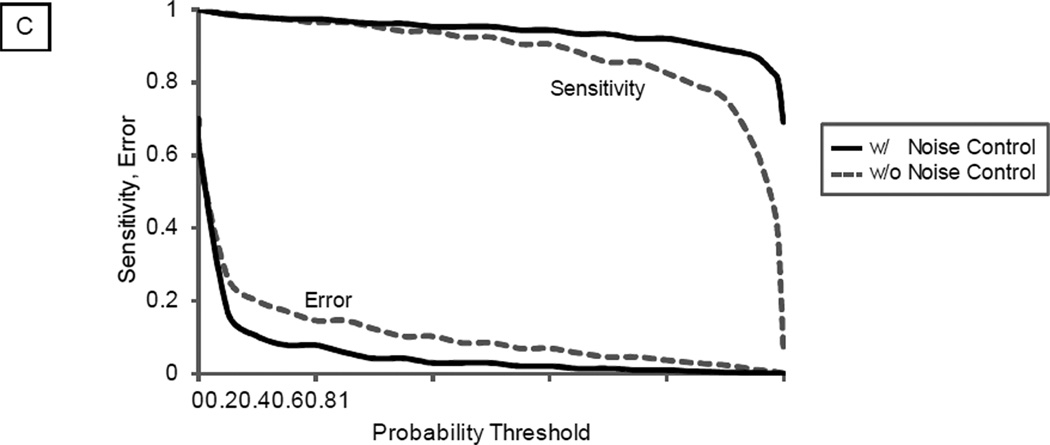
A statistical module was coupled with the library search engine to distinguish correct matches from false matches according to a user-specified statistical threshold. As shown, the application of the noise control achieved a better separation between correct and false spectral matches (Fig. 2A–2B). Thus, at a defined statistical confidence level, employment of the noise control method enhanced the accuracy of spectral matches. With an example test dataset, the employment of noise control method identified 35,574 spectral matches compared to 21,982 without using this method, which was a 61.8% increase in total number of spectral matches. Such improvements were present under a broad range of probability thresholds (Fig. 2C)
Figure 2.
Distinguishing Correct Matches from False Matches. The distribution of the correlation score can be used to separate correct spectral matches from false matches via a mechanism analogous to PeptideProphet. A. Without the noise control, the distribution of correlation scores for correct matches and false matches significantly overlapped. At a statistical threshold of 95% confidence, a total of 21,982 spectral matches were filtered. B. The distribution of correlation scores for correct and false matches was better separated with noise control. At a statistical threshold of 95% confidence, a total of 35,574 spectral matches were filtered (a 61.8% increase), illustrating higher identification sensitivity. C. The impact of noise control strategy on identification sensitivity and error was illustrated in relation to probability threshold.
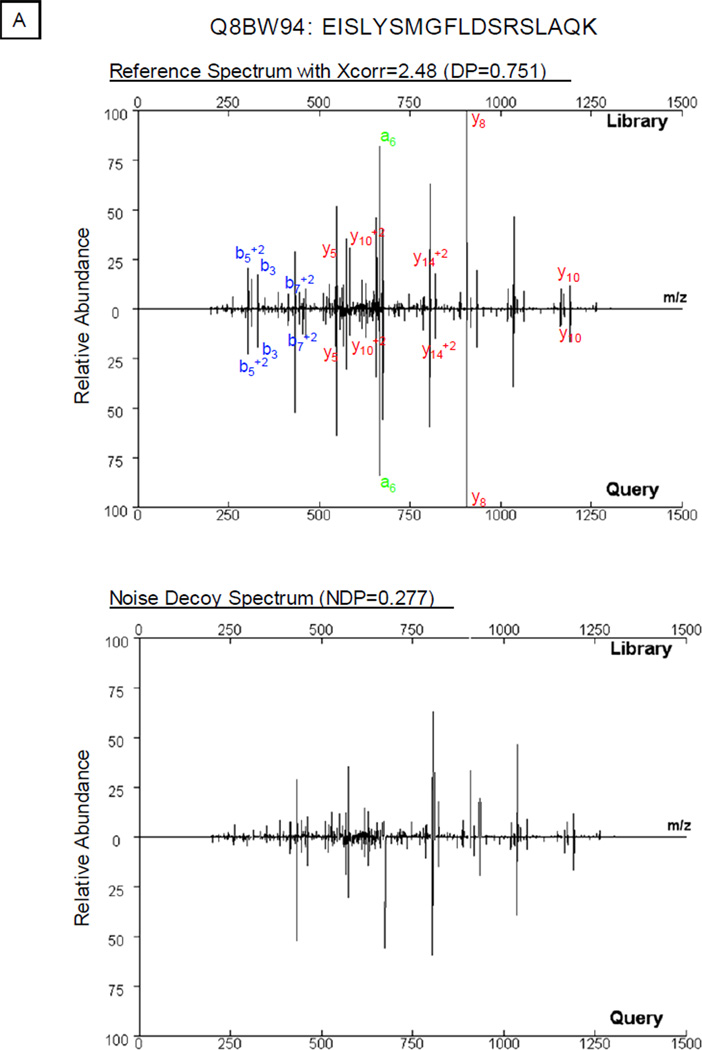
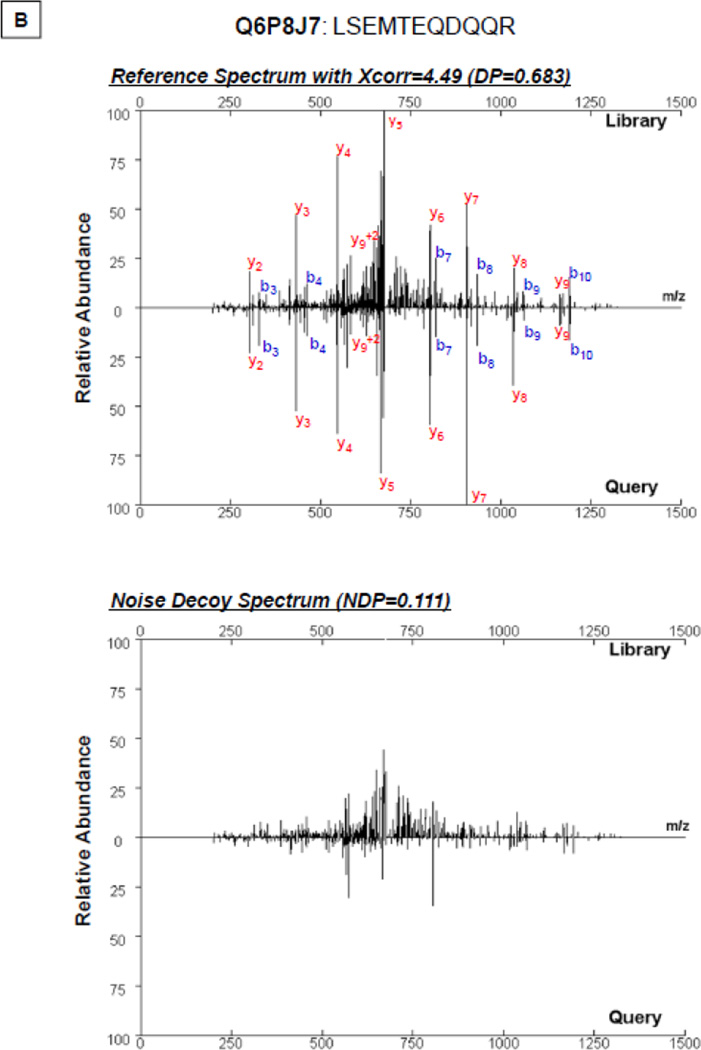
The process of library construction inevitably introduces a small fraction of falsely annotated spectra [13], as this process is based on a sequence database search at a defined statistical cutoff. Matches made to such spectra will propagate errors to the query spectra. The noise control method demonstrated proficiency in suppressing this route of propagation. As shown in Figure 3A, a query spectrum matched with a falsely annotated library spectrum yielded a dot product score of 0.751. Meanwhile, the noise control spectrum produced a noise correlation score (0.277); thus the difference between the overall correlation score and the noise correlation score provided an avenue to exclude matches to falsely annotated reference (0.474). Conversely, the deduction of correlation contributed by noise did not affect peptide identification using correctly annotated spectra as references (Fig. 3B).
Figure 3.
Inhibiting the Propagation of False Annotations using the Noise Control Method. A small number of falsely annotated spectra are present in peptide spectral libraries. A. As shown in the example, a high correlation between the query spectrum and the falsely annotated reference spectrum (Q8BW94: EISLYSMGFLDSRSLAQK) (DP = 0.751) accompanied a high noise correlation value (NDP = 0.277). The adjustment of the spectral correlation score (ΔDP=DP−NDP=0.474) assured the accuracy of spectral analysis; thus inhibiting the propagation of this false annotation. B. With a correctly annotated reference spectrum (Q6P8J7: LSEMTEQDQQR), the difference in dot product values (ΔDP=0.683−0.111=0.572) supported correct spectral annotation.
Development of Mathematical Algorithm for Spectral Matching and Peptide Identification
In consideration of its computational efficiency, the dot product algorithm was selected to evaluate correlations between spectra. Three components, the dot product (DP), noise dot product (NDP) and dot bias (DB), were integrated into a formula to assess a final score (FS) (Formula 1).
| (1) |
The dot product value of library and query spectra provides an overall assessment of their similarity; NDP measures the contribution of noise peaks towards the overall assessment. Thereby, the difference between DP and NDP values highlights the signals representing characteristic fragments from the peptide precursor.
By using a dot product algorithm, the correlations of a few dominant peaks can lead to an arbitrarily high match score. Thus, DB was recruited as the third component to counter this predisposition [21]; previously, a deduction had been made from the overall correlation score with either a large or small DB value. With this noise control method, the deduction for a small DB value was no longer necessary. Meanwhile, a linear increase in deduction for large DB values was implemented to assess the relative contributions of dominant peaks towards the overall correlation.
Managing Mass Measurement Fluctuations with a Specialized Matching Algorithm
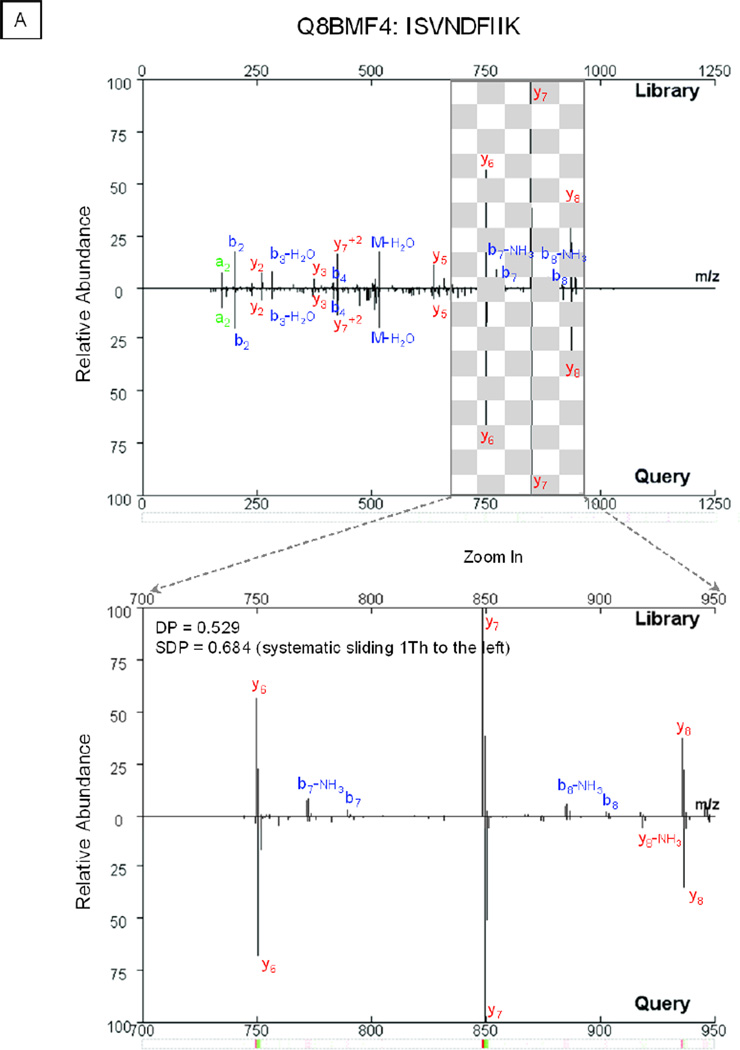
The binning of signals in mass spectra is a necessary step prior to peak matching via a dot product mechanism [26, 27]. In this investigation, we integrated peaks within a bin window, which aligned the signals from query and library spectra. The size of the bin window determines the specificity, robustness and efficiency of spectral matching. A narrower window maximally retains spectral features at the expense of computational power; whereas, a wider window affords high tolerance towards fluctuations in mass measurements. Accordingly, an optimized window size of 1 Th was used to bin spectra; a deviation of 1 bin or more in mass measurements between the query and library spectrum would lead to a false negative annotation (Fig. 4A).
Figure 4.
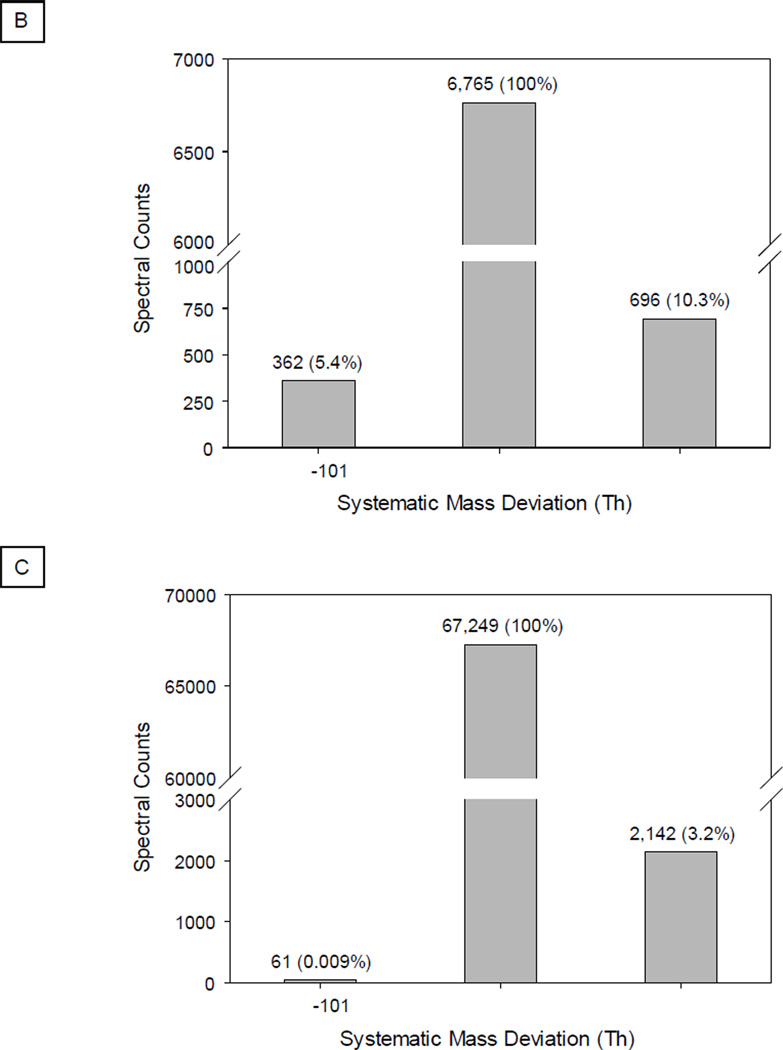
Managing Systematic Deviations in Mass Measurements Using the Sliding Dot Product. An ion trap mass spectrometer affords limited resolution in mass measurements. A slight deviation in mass measurement may misalign peptide fragments from the query and reference spectrum into different bin windows, which significantly affects the value of the dot product. A. As shown in the example spectrum for peptide ISVNDFIIK (Q8BMF4), without a mass adjustment, the DP value equaled 0.529; with adjustment, the DP value reached 0.684. B. With query spectra collected by a poorly-calibrated LTQ instrument, the sliding dot product workflow provided 15.7% (5.4% + 10.3%) additional spectral matches. C. With a well-calibrated instrument, this adjustment offered analytical benefits of 3.2% extra spectral matches.
To accommodate an inherent analytical dynamic range [28, 29], a novel “sliding dot product” (SDP) workflow was designed in the library search engine. The computational algorithm enabled each individual peak of a library spectrum to shift by the unit of the bin window in either direction, which assured the best alignment with a query spectrum. Furthermore, the query spectrum was compared with the resulting spectral variants; subsequently, the highest correlation score was reported. This process reduced the rate of false negative annotations introduced by inaccurate mass measurements.
The new scoring system accommodated spectra of variable quality. As expected, the SDP workflow improved the detection sensitivity of spectra of lower quality by up to 15% (Fig. 4B). An increase in the number of spectral matches was also observed for spectra of higher quality by up to 3% (Fig. 4C).
Validation of the Library Search Engine
The library search engine was further validated using a murine 20S proteasome spectral library and three independent test datasets.
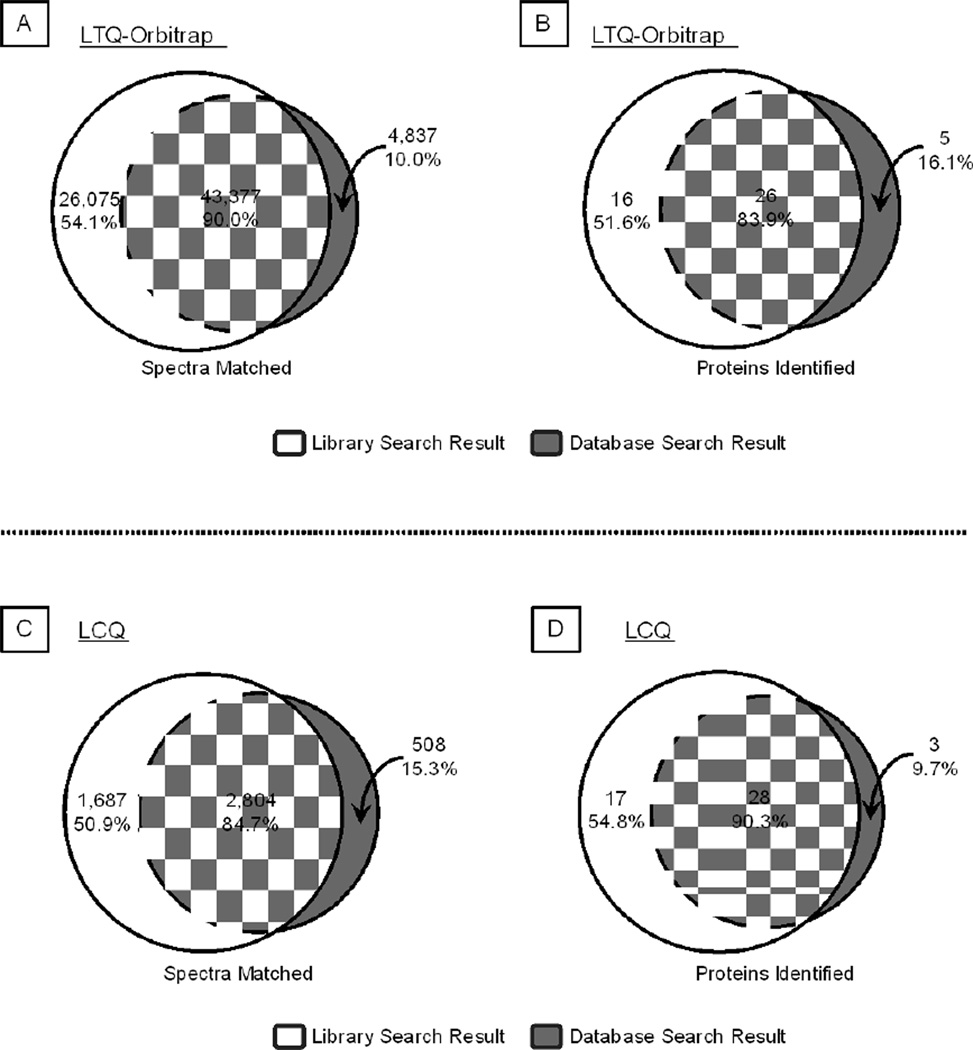
The first dataset was collected by LTQ-Orbitrap and included six LC-MS/MS experiments. The library search covered 90% of spectral matches provided by sequence database search and offered an additional 54.1% matches (Fig. 5A). This translated into 83.9% coverage in protein identification with an extra 51.6% detection (Fig. 5B).
Figure 5.
Benchmark Tests of Library Search Engine in Protein Identification. A–B. With the test dataset of murine 20S proteasome spectra collected by an LTQ-Orbitrap mass spectrometer, the library search workflow covered 90.0% of the spectral matches (A) and 83.9% of protein identifications (B) provided by a sequence database search workflow. Furthermore, the library search offered an additional 54.1% unique spectral matches and 51.6% unique protein identifications. C–D. With the LCQ test dataset, the library search workflow covered 84.7% of spectral matches (C) and 90.3% of protein identifications (D) that were captured via a sequence database search workflow. The library search also offered an additional 50.9% unique spectral matches and 54.8% unique protein identifications.
To further demonstrate that the search engine was effective in analyzing data collected from different instruments, a second dataset was formulated with spectra collected by a 3-D ion trap (LCQ). The library search workflow documented 84.7% spectral matches as reported via the SEQUEST database search route, as well as 50.9% additional matches that escaped the SEQUEST database search (Fig. 5C). Thereby, 90.3% coverage and a bonus of 54.8% in protein identifications were observed (Fig. 5D).
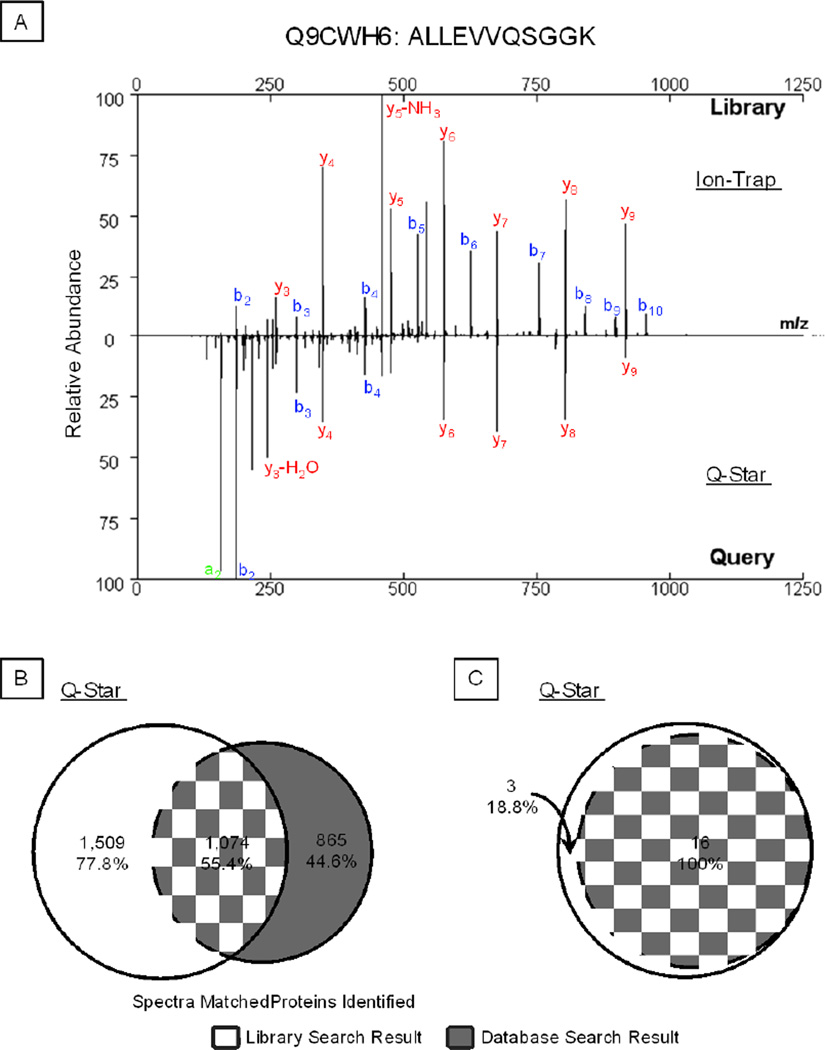
We also evaluated the utility of this spectral library workflow in the analyses of a Q-Star dataset, where peptides were fragmented in a quadrupole collision cell. Library search showed a 55.4% coverage consistent with a SEQUEST database search, as well as a 77.8% expanded results in spectral matches (Fig. 6A). Despite differences in fragmentation patterns, a strong correlation was found between the spectra collected by the two instruments (Fig. 6B). For each spot analyzed in the 2-D gel, the dominant protein species identified by our library search were in agreement with the sequence database search (Fig. 6C); and the library search workflow offered 18.8% additional identifications.
Figure 6.
Benchmark Test of Ion Trap Spectral Library in Analyzing Q-Star Collected Query Spectra. A. Ion-trap and Q-Star spectra of the same peptide ALLEVVQSGGK (Q9CWH6) were shown in a mirror image form. Despite a characteristic distinction between the two spectra, a strong correlation in b- and y- ion series was clearly present, giving a final score of 0.687. B. With the Q-Star test dataset, a search using an ion trap spectral library covered 55.4% of the spectral matches offered via a sequence database search workflow, as well as 77.8% additional unique matches. C. Library search covered 100% of proteins identified via a sequence database search and offered an additional 18.8% in protein identification.
Finally, we benchmarked the efficiency of the noise control mechanism on existing spectral library workflow. Publicly accessible datasets were used in these tests. Consistently, noise control strategy delivered higher analytical sensitivity and accuracy (Fig. S3). The benefit increased as the size of the library grew.
DISCUSSION
A spectral library as a reference for peptide identification confers unique advantages in analytical accuracy and efficiency. Minimizing false spectral annotations is essential for the success of a broader application of spectral library-based platforms. This study presents a new workflow on spectral library that emphasizes three inter-related features to enhance accuracy: (i) introducing a new mechanism to manage false spectral matches using noise control spectra (Fig. 1) and to achieve greater accuracy (Fig. 2 and Fig. 3), (ii) advancing the formula to integrate the dot bias value into final score (Formula 1) and (iii) implementing a sliding dot product strategy to overcome spectral variability resulting from different LC-MS/MS instruments (Fig. 4). Collectively, examples highlighting the benefits of these three features are shown in Fig. 5 and Fig. 6.
Proteomics Expertise Delivered by Spectral Libraries
Innovations in proteomics technology enable a systems perspective to dissect and evaluate biomedical phenotypes [30, 31]. However, taking advantage of this platform mandates specialized expertise in bioinformatics. A significant gap exists between those who are driving the innovation of the technology and those who are exercising them to discoveries in biology; sharing of expertise via spectral analytic tools and annotated datasets are critical to unite the two groups.
Sequence database search-based characterization of proteomic datasets is the traditional workflow, which is computationally demanding and lacks cumulative memory. Many biomedical investigators have limited access to high performance computational platforms as well as to proprietary bioinformatics software packages. In addition, there is a lack of specialized expertise in manual inspection of mass spectra by the majority of biologists. Accordingly, a reference spectral library provides an avenue by delivering curated proteomics data with reduced demands of computational power and trainings in mass spectrometry. Curated empirical spectral libraries are on the rise [2, 32]. Expert annotated spectra can be shared among research scientists as a reference for protein identification and further progress towards a public resource. Consequently, proteomics technologies are broadly accessible, and insights from diverse origins are integrated to cultivate creative intuitions.
Spectral Library Workflow Offers Enhanced Accuracy in Protein Identifications
Both a theoretical spectrum database and an empirical spectrum library offer unique opportunities and challenges in proteomics analyses. An empirical spectrum library preserves the relative intensities of peptide fragments, permitting the delivery of elevated specificity. However, an empirical spectrum carries noise peaks, which may lead to an incorrect assessment of spectral correlation.
Noise peaks of various intensities are present in nearly all empirical spectra. In the scenario of an empirical spectrum as a reference for spectra matching, the overall correlation scores are determined, in part, by noise peaks in both the query and library spectra. When noise peaks become prominent, a false positive annotation will emerge. Thus far, two strategies have been reported to address this issue: building a consensus spectrum by integrating multiple replicates [11], or alternatively, selecting the most intense peaks in the library spectra by pre-established criteria [26]. The first approach may effectively remove noise peaks if a large set of redundant spectra are available. However, when the size of the spectral pool is insufficient, the removal of noise peaks becomes less efficient, and the consensus spectrum possesses limited consistency. Additionally, the maintenance of such a library demands archiving large cohorts of redundant spectra, which are resource-consuming. In the latter approach, the most intense peaks in a reference spectrum are considered specific and retained, while the residual peaks are arbitrarily regarded as noise and consequently removed. However, both peptide fragment and noise peaks may vary in intensities; thus this elimination process may sacrifice specific features of a spectrum. Overall, the construction of representative references are insufficient to address compounded spectrum formed by co-eluted peptides and recurring noises. More importantly, such “standard spectra” disturb the authenticity of original data, compromising the ability for post-analysis validation.
With the implementation of the noise control strategy presented in this study, contributions from noise peaks to the overall correlation score are removed, thus enhancing the accuracy of the analysis. These functionalities are available for libraries formed with raw mass spectra. Moreover, the construction of a spectral library is straightforward, and the representative spectra in the library can be easily updated. Furthermore, the signals from a reference spectrum were aligned with those from a query spectrum via a binning process, an essential step for calculating a dot product score. The SDP approach incorporated in this library search engine provides a solution to accommodate misalignments, assuring the sensitivity in protein identifications. With the SDP algorithm, the spectra of a peptide carrying a PTM that introduces a mass shift smaller than the size of slide window (e.g., 1 Th or less), may not be distinguished with its unmodified counterpart during spectral match. A high resolution MS1 spectrum will enable this separation.
Library Search Engine Mitigates the Propagation of False Annotation
To limit the false discovery rate in large scale data analyses, few approaches, e.g., reverse database search [12, 33], have been developed. Nevertheless, the large volume of proteomic datasets makes it difficult to eliminate false annotations [13]. The incorporation of falsely annotated spectra in the library may propagate such annotations to the query spectra, limiting the wide application of the library search workflow. In this study, our analysis demonstrated the efficiency of noise control spectra in addressing this issue. The final score offered by the search engine factors in the quality of the reference spectra through the relative intensity of the negative control signals, preventing false annotations from propagating to the query spectra. This feature encourages individual research groups to build their own spectral library relatively independent of the reference spectra quality.
The ultimate goal of constructing a spectral library is to provide a curated collection of high-quality spectra for efficient protein identifications. The constraints imposed by the wide dynamic range of protein expression and sensitivity of instruments render spectral libraries to contain a mixture of spectra with high and moderate quality. This presents two opportunities: (i) an opportunity to effectively exploit the information conveyed in spectra of moderate quality and (ii) an opportunity to configure a spectral library in a fashion to transform existing spectra gradually into higher quality counterparts.
The workflow presented in this study affords an integrated solution pertaining to spectra library construction and search engine implementation, with adequate consideration of affiliated challenges. It accommodates spectra of various qualities, therefore meeting the immediate needs as well as long term applications of library-directed proteomic analyses. In time, a consolidated reference may mature as a resource to the scientific community at large.
Supplementary Material
Highlights.
A new search engine employs noise decoy spectra to suppress correlation errors.
Integration of original spectra enables sensitive and specific identifications.
Sliding dot product algorithm supports management of mass measurement fluctuations.
Validation via different instrumentations documents search engine proficiency.
ACKNOWLEDGEMENTS
This work was supported, in part, by NHLBI Proteomics Center Award HHSN268201000035C, NIH R01 HL063901, and an endowment from Theodore C. Laubisch at UCLA to Dr. Peipei Ping.
Abbreviations
- DB
Dot Bias
- DP
Dot Product
- NDP
Noise Dot Product
- SDP
Sliding Dot Product.
Footnotes
Publisher's Disclaimer: This is a PDF file of an unedited manuscript that has been accepted for publication. As a service to our customers we are providing this early version of the manuscript. The manuscript will undergo copyediting, typesetting, and review of the resulting proof before it is published in its final citable form. Please note that during the production process errors may be discovered which could affect the content, and all legal disclaimers that apply to the journal pertain.
REFERENCES
- 1.Washburn MP, Wolters D, Yates JR., 3rd Large-scale analysis of the yeast proteome by multidimensional protein identification technology. Nat Biotechnol. 2001;19:242–247. doi: 10.1038/85686. [DOI] [PubMed] [Google Scholar]
- 2.Jones P, Cote RG, Cho SY, Klie S, Martens L, Quinn AF, et al. PRIDE: new developments and new datasets. Nucleic Acids Res. 2008;36:D878–D883. doi: 10.1093/nar/gkm1021. [DOI] [PMC free article] [PubMed] [Google Scholar]
- 3.Eng JK, McCormack A, Yates JR. An approach to correlate tandem mass spectral data of peptides with amino acid sequences in a protein database. J Am Soc Mass Spectrom. 1994;5:976–989. doi: 10.1016/1044-0305(94)80016-2. [DOI] [PubMed] [Google Scholar]
- 4.Perkins DN, Pappin DJ, Creasy DM, Cottrell JS. Probability-based protein identification by searching sequence databases using mass spectrometry data. Electrophoresis. 1999;20:3551–3567. doi: 10.1002/(SICI)1522-2683(19991201)20:18<3551::AID-ELPS3551>3.0.CO;2-2. [DOI] [PubMed] [Google Scholar]
- 5.Yates JR, 3rd, Morgan SF, Gatlin CL, Griffin PR, Eng JK. Method to compare collision-induced dissociation spectra of peptides: potential for library searching and subtractive analysis. Anal Chem. 1998;70:3557–3565. doi: 10.1021/ac980122y. [DOI] [PubMed] [Google Scholar]
- 6.Nesvizhskii AI, Keller A, Kolker E, Aebersold R. A statistical model for identifying proteins by tandem mass spectrometry. Anal Chem. 2003;75:4646–4658. doi: 10.1021/ac0341261. [DOI] [PubMed] [Google Scholar]
- 7.Creasy DM, Cottrell JS. Unimod: Protein modifications for mass spectrometry. Proteomics. 2004;4:1534–1536. doi: 10.1002/pmic.200300744. [DOI] [PubMed] [Google Scholar]
- 8.Second TP, Blethrow JD, Schwartz JC, Merrihew GE, MacCoss MJ, Swaney DL, et al. Dual-pressure linear ion trap mass spectrometer improving the analysis of complex protein mixtures. Anal Chem. 2009;81:7757–7765. doi: 10.1021/ac901278y. [DOI] [PMC free article] [PubMed] [Google Scholar]
- 9.Halligan BD, Geiger JF, Vallejos AK, Greene AS, Twigger SN. Low cost, scalable proteomics data analysis using Amazon's cloud computing services and open source search algorithms. J Proteome Res. 2009;8:3148–3153. doi: 10.1021/pr800970z. [DOI] [PMC free article] [PubMed] [Google Scholar]
- 10.Xu T, Wong CC, Kashina A, Yates JR., 3rd Identification of N-terminally arginylated proteins and peptides by mass spectrometry. Nat Protoc. 2009;4:325–332. doi: 10.1038/nprot.2008.248. [DOI] [PMC free article] [PubMed] [Google Scholar]
- 11.Lam H, Deutsch EW, Eddes JS, Eng JK, Stein SE, Aebersold R. Building consensus spectral libraries for peptide identification in proteomics. Nat Methods. 2008;5:873–875. doi: 10.1038/nmeth.1254. [DOI] [PMC free article] [PubMed] [Google Scholar]
- 12.Elias JE, Gygi SP. Target-decoy search strategy for increased confidence in large-scale protein identifications by mass spectrometry. Nat Methods. 2007;4:207–214. doi: 10.1038/nmeth1019. [DOI] [PubMed] [Google Scholar]
- 13.Desiere F, Deutsch EW, Nesvizhskii AI, Mallick P, King NL, Eng JK, et al. Integration with the human genome of peptide sequences obtained by high-throughput mass spectrometry. Genome Biol. 2005;6:R9. doi: 10.1186/gb-2004-6-1-r9. [DOI] [PMC free article] [PubMed] [Google Scholar]
- 14.Drews O, Wildgruber R, Zong C, Sukop U, Nissum M, Weber G, et al. Mammalian Proteasome Subpopulations with Distinct Molecular Compositions and Proteolytic Activities. Mol Cell Proteomics. 2007;6:2021–2031. doi: 10.1074/mcp.M700187-MCP200. [DOI] [PubMed] [Google Scholar]
- 15.Gomes AV, Young GW, Wang Y, Zong C, Eghbali M, Drews O, et al. Contrasting proteome biology and functional heterogeneity of the 20 S proteasome complexes in mammalian tissues. Mol Cell Proteomics. 2009;8:302–315. doi: 10.1074/mcp.M800058-MCP200. [DOI] [PMC free article] [PubMed] [Google Scholar]
- 16.Zong C, Gomes AV, Drews O, Li X, Young GW, Berhane B, et al. Regulation of murine cardiac 20S proteasomes: role of associating partners. Circ Res. 2006;99:372–380. doi: 10.1161/01.RES.0000237389.40000.02. [DOI] [PubMed] [Google Scholar]
- 17.Wang X, Chen CF, Baker PR, Chen PL, Kaiser P, Huang L. Mass spectrometric characterization of the affinity-purified human 26S proteasome complex. Biochemistry. 2007;46:3553–3565. doi: 10.1021/bi061994u. [DOI] [PubMed] [Google Scholar]
- 18.Gomes AV, Zong C, Edmondson RD, Li X, Stefani E, Zhang J, et al. Mapping the murine cardiac 26S proteasome complexes. Circ Res. 2006;99:362–371. doi: 10.1161/01.RES.0000237386.98506.f7. [DOI] [PubMed] [Google Scholar]
- 19.Kersey PJ, Duarte J, Williams A, Karavidopoulou Y, Birney E, Apweiler R. The International Protein Index: an integrated database for proteomics experiments. Proteomics. 2004;4:1985–1988. doi: 10.1002/pmic.200300721. [DOI] [PubMed] [Google Scholar]
- 20.Wang D, Zong C, Koag MC, Wang Y, Drews O, Fang C, et al. Proteome Dynamics and Proteome Function of Cardiac 19S Proteasomes. Mol Cell Proteomics. 2011;10 doi: 10.1074/mcp.M110.006122. M110 006122. [DOI] [PMC free article] [PubMed] [Google Scholar]
- 21.Lam H, Deutsch EW, Eddes JS, Eng JK, King N, Stein SE, et al. Development and validation of a spectral library searching method for peptide identification from MS/MS. Proteomics. 2007;7:655–667. doi: 10.1002/pmic.200600625. [DOI] [PubMed] [Google Scholar]
- 22.Deutsch E. mzML: a single, unifying data format for mass spectrometer output. Proteomics. 2008;8:2776–2777. doi: 10.1002/pmic.200890049. [DOI] [PubMed] [Google Scholar]
- 23.Kessner D, Chambers M, Burke R, Agus D, Mallick P. ProteoWizard: open source software for rapid proteomics tools development. Bioinformatics. 2008;24:2534–2536. doi: 10.1093/bioinformatics/btn323. [DOI] [PMC free article] [PubMed] [Google Scholar]
- 24.MacLean B, Tomazela DM, Shulman N, Chambers M, Finney GL, Frewen B, et al. Skyline: an open source document editor for creating and analyzing targeted proteomics experiments. Bioinformatics. 2010;26:966–968. doi: 10.1093/bioinformatics/btq054. [DOI] [PMC free article] [PubMed] [Google Scholar]
- 25.Kline KG, Frewen B, Bristow MR, Maccoss MJ, Wu CC. High quality catalog of proteotypic peptides from human heart. J Proteome Res. 2008;7:5055–5061. doi: 10.1021/pr800239e. [DOI] [PMC free article] [PubMed] [Google Scholar]
- 26.Frewen BE, Merrihew GE, Wu CC, Noble WS, MacCoss MJ. Analysis of peptide MS/MS spectra from large-scale proteomics experiments using spectrum libraries. Anal Chem. 2006;78:5678–5684. doi: 10.1021/ac060279n. [DOI] [PubMed] [Google Scholar]
- 27.Craig R, Cortens JC, Fenyo D, Beavis RC. Using annotated peptide mass spectrum libraries for protein identification. J Proteome Res. 2006;5:1843–1849. doi: 10.1021/pr0602085. [DOI] [PubMed] [Google Scholar]
- 28.Brancia FL. Recent developments in ion-trap mass spectrometry and related technologies. Expert Rev Proteomics. 2006;3:143–151. doi: 10.1586/14789450.3.1.143. [DOI] [PubMed] [Google Scholar]
- 29.Perry RH, Cooks RG, Noll RJ. Orbitrap mass spectrometry: instrumentation, ion motion and applications. Mass Spectrom Rev. 2008;27:661–699. doi: 10.1002/mas.20186. [DOI] [PubMed] [Google Scholar]
- 30.Baker ES, Liu T, Petyuk VA, Burnum-Johnson KE, Ibrahim YM, Anderson GA, et al. Mass spectrometry for translational proteomics: progress and clinical implications. Genome medicine. 2012;4:63. doi: 10.1186/gm364. [DOI] [PMC free article] [PubMed] [Google Scholar]
- 31.Plymoth A, Hainaut P. Proteomics beyond proteomics: toward clinical applications. Current opinion in oncology. 2011;23:77–82. doi: 10.1097/CCO.0b013e32834179c1. [DOI] [PubMed] [Google Scholar]
- 32.Deutsch EW, Lam H, Aebersold R. PeptideAtlas: a resource for target selection for emerging targeted proteomics workflows. EMBO reports. 2008;9:429–434. doi: 10.1038/embor.2008.56. [DOI] [PMC free article] [PubMed] [Google Scholar]
- 33.Cociorva D, D LT, Yates JR. Validation of tandem mass spectrometry database search results using DTASelect. Curr Protoc Bioinformatics. 2007;Chapter 13(Unit 13):4. doi: 10.1002/0471250953.bi1304s16. [DOI] [PubMed] [Google Scholar]
Associated Data
This section collects any data citations, data availability statements, or supplementary materials included in this article.


