

Abstract
Background
Frontotemporal lobar degeneration (FTLD) is most commonly associated with TAR-DNA binding protein (TDP-43) or tau pathology at autopsy, but there are no in vivo biomarkers reliably discriminating between sporadic cases. As disease-modifying treatments emerge, it is critical to accurately identify underlying pathology in living patients so that they can be entered into appropriate etiology-directed clinical trials. Patients with tau inclusions (FTLD-TAU) appear to have relatively greater white matter (WM) disease at autopsy than those patients with TDP-43 (FTLD-TDP). In this paper, we investigate the ability of white matter (WM) imaging to help discriminate between FTLD-TAU and FTLD-TDP during life using diffusion tensor imaging (DTI).
Methods
Patients with autopsy-confirmed disease or a genetic mutation consistent with FTLD-TDP or FTLD-TAU underwent multimodal T1 volumetric MRI and diffusion weighted imaging scans. We quantified cortical thickness in GM and fractional anisotropy (FA) in WM. We performed Eigenanatomy, a statistically robust dimensionality reduction algorithm, and used leave-one-out cross-validation to predict underlying pathology. Neuropathological assessment of GM and WM disease burden was performed in the autopsy-cases to confirm our findings of an ante-mortem GM and WM dissociation in the neuroimaging cohort.
Results
ROC curve analyses evaluated classification accuracy in individual patients and revealed 96% sensitivity and 100% specificity for WM analyses. FTLD-TAU had significantly more WM degeneration and inclusion severity at autopsy relative to FTLD-TDP.
Conclusions
These neuroimaging and neuropathological investigations provide converging evidence for greater WM burden associated with FTLD-TAU, and emphasize the role of WM neuroimaging for in vivo discrimination between FTLD-TAU and FTLD-TDP.
Introduction
Frontotemporal lobar degeneration (FTLD) is the second most common pre-senile neurodegenerative disease (1) affecting approximately 20 per 100,000 adults under the age of 65.(2) From a pathological perspective, FTLD is a heterogeneous neurodegenerative disease with distinct underlying histopathological abnormalities. Approximately half of FTLD patients have tau-positive inclusions (FTLD-TAU), while most of the remainder have an accumulation of TAR DNA binding protein of ~43 kDa (TDP-43; FTLD-TDP).(3,4) Some clinical-pathological evidence suggests that syndromes of primary progressive aphasia (PPA) may be preferentially associated with one of these histopathological abnormalities,(5) but syndromes such as behavioral-variant frontotemporal dementia (bvFTD) are equally likely to have FTLD-TAU and FTLD-TDP.(6) As potential disease-modifying treatments emerge that target tau or TDP-43, it is critical to establish in vivo diagnostic methods that are sensitive and specific to these histopathologic abnormalities.
Previous attempts to establish in vivo diagnostic methods for discriminating between underlying pathologies in FTLD have been largely observational. One study identified a series of clinical and behavioral features and used a clustering algorithm that suggested that poor planning was associated with FTLD-TAU, while poor personal conduct was associated with tau-negative FTLD.(7) More recently, a proteomic CSF study suggested that a combination of five cerebrospinal fluid analytes can achieve high sensitivity (86%) and modest specificity (78%) for differentially identifying FLTD-TDP relative to FTLD-TAU.(8)
In the present study, we take a hypothesis-driven approach to predict underlying pathology in individual patients based on previous neuropathological observations of these diseases. Specifically, FTLD-TAU, such as Corticobasal Degeneration (CBD), has characteristic tau inclusions throughout both grey matter (GM) and white matter (WM),(9) while TDP-43 histopathologic burden appears to be more prevalent in GM with relative sparing of white matter (WM).(10) Therefore, an in vivo method of evaluating WM integrity, such as diffusion tensor imaging (DTI) of WM, may provide a sensitive and specific method that helps discriminate between FTLD subtypes.
Neuroimaging studies of WM in FTLD have been rare and suggest that FTLD-TAU and FTLD-TDP both have reduced WM volume relative to older controls.(11,12) One study reported that FTLD-TAU has reduced WM volume in the genu and anterior corpus callosum relative to FTLD-TDP.(11) However, volumetric analyses of WM, unlike DTI, do not accurately reflect microstructure changes in WM tracts. DTI studies suggest that fractional anisotropy (FA) is reduced in autopsy-confirmed FTLD compared to Alzheimer’s disease (AD).(13,14) However, we are unaware of an evaluation of DTI for establishing an in vivo diagnosis of underlying FTLD-TAU and FTLD-TDP histopathological abnormalities in individual cases.
Methods
Participants
Thirty-five patients diagnosed with a neurodegenerative disease who had either a detailed neuropathological diagnosis at autopsy or a pathogenic genetic mutation consistent with FTLD-TAU (MAPT) or FTLD-TDP (GRN; C9orf72) pathology were recruited from the Penn Frontotemporal Degeneration Center at the University of Pennsylvania. All patients underwent both volumetric T1 MRI and diffusion weighted image (DWI) scans. The FTLD subgroups were matched for age, education, disease duration, and disease severity (Table 1). Our study cohort included a range of clinical phenotypes that are summarized in Supplementary Table 1. Written informed consent was obtained from all participants using a protocol approved by the University of Pennsylvania Institutional Review Board.
Table 1.
Mean (SE) Demographic & Clinical Profiles of Autopsy-Confirmed and Genetic Surrogate Patients with FTLD-TDP and FTLD-TAU.
| Group1 | Group | N (Female) | Age | Education | Duration | MMSE |
|---|---|---|---|---|---|---|
| FTLD-TDP | Total | 25 (13) | 61.6 (1.4) | 14.8 (0.7) | 2.9 (0.5) | 23.0 (1.3) |
| Autopsy | 6 (2) | 58.5 (2.4) | 16.7 (1.9) | 2.7 (1.0) | 23.0 (2.0) | |
| C9ORF72 | 12 (5) | 61.3 (1.6) | 14.9 (0.7) | 3.5 (1.0) | 25.8 (1.0) | |
| GRN | 7 (6) | 64.7 (3.3) | 13.1 (1.6) | 2.1 (0.3) | 17.2 (3.5) 2 | |
| FTLD-TAU | Total | 10 (6) | 62.2 (5.3) | 15.4 (0.9) | 2.8 (0.5) | 20.7 (3.3) |
| Autopsy | 7 (4) | 67.1 (6.2) | 15.4 (0.9) | 3.2 (0.6) | 19.2 (4.3) 2 | |
| MAPT | 3 (2) | 50.7 (7.5) | 15.3 (2.4) | 1.7 (0.9) | 23.7 (5.4) | |
Note.
T-tests confirmed that FTLD-TDP and FTLD-TAU were matched for age at MRI [t(33)<1; p>0.1], education [t(33)<1; p>0.1], disease duration [t(33)<1; p>0.1], and disease severity measure using the MMSE [t(31)<1; p>0.1. A Chi-square analysis demonstrated that groups were matched for gender [X2=0.18; p>0.1].
MMSE was not available for one patient from each group.
Neuropathological Diagnosis
Thirteen patients had a detailed neuropathological examination at autopsy consistent with FTLD-TAU or FTLD-TDP, as previously reported.(15) Neuropathologic diagnoses were established according to consensus criteria (4) by an expert neuropathologist (JQT) using immunohistochemistry with established monoclonal antibodies specific for pathogenic tau (mAb PHF-1)(16) and TDP-43 (mAbs p409/410 or 171).(17,18) Six cases had disease consistent with FTLD-TDP and were further classified into harmonized FTLD-TDP subtypes.(19) Seven cases were diagnosed with a disease consistent with FTLD-TAU. There were no significant differences in brain weight, duration between neuroimaging acquisition and neuropatholgical exam, post–mortem interval, or CERAD plaque score(20) between FTLD-TAU and FTLD-TDP subgroups. Specific neuropathological diagnoses are summarized in Supplemental Table 2.
Semi-quantitative ratings (0=absent, 1=mild, 2=moderate, and 3=severe) were used to assess the angular gyrus and adjacent WM in the superior longitudinal fasiculus identified on the basis of imaging results (see below). Two trained examiners used a consensus procedure to evaluate four neuropathological features: (1) intensity of WM degeneration was graded using luxol-fast blue; (2) WM inclusion burden was determined based on the density of tau-positive lesions in FTLD-TAU and TDP-43-positive lesions in FTLD-TDP; (3) neuronal loss was assessed using hematoxylin and eosin (H-E) stained slides; (4) GM inclusion burden was determined based on the density of tau-positive lesions in FTLD-TAU and TDP-43-positive lesions in FTLD-TDP. To additionally evaluate the specificity of the imaging results (see below) we evaluate WM and GM inclusion burden in the temporal cortex and adjacent uncinate fasciculus. To statistically evaluate group-level differences in neuropathological measures, we performed Mann-Whitney U tests.
We additionally used genetic mutations as a surrogate for FTLD pathology (see Supplementary Materials for details), as previously reported(21,22). This included 4 patients who had a MAPT pathogenic mutation, which is exclusively associated with FTLD-TAU. Likewise, individuals with either a C9orf72 expansion greater than 30 repeats (N=12) or a GRN pathogenic mutation (N=9), which are exclusively associated with FTLD-TDP, were included. Two of the GRN cases additionally had autopsy-confirmation of FTLD-TDP and one MAPT case had autopsy-confirmed FTLD-TAU.
Volumetric T1 MRI Acquisition and Preprocessing
All participants underwent a structural T1-weighted MPRAGE MRI acquired from a SIEMENS 3.0T Trio scanner with an 8-channel coil using the following parameters: repetition time=1620msec; echo time=3msec; slice thickness=1.0mm; flip angle=15°; matrix=192×256, and in-plane resolution=1.0mm isotropic. MRI volumes were preprocessed using PipeDream (http://sourceforge.net/projects/neuropipedream/) and Advanced Normalization Tools (ANTs)(23) as previously reported.(14) Briefly, PipeDream diffeomorphically deforms each individual dataset into a standard local template space using a procedure that is symmetric to minimize bias toward the reference space for computing the mappings, and topology-preserving to capture the large deformation necessary to aggregate images in a common stereotactic space. These algorithms allow template-based priors to guide cortical segmentation and compute GM cortical thickness in the subject image space.(24) Cortical thickness images were normalized to template space and smoothed using a 4mm full-width-half-maximum Gaussian kernel.
Diffusion Tensor Imaging Acquisition and Preprocessing
Diffusion-weighted images (DWI) were acquired with either a 30-directional or 12-directional acquisition sequence. The former included a single-shot, spin-echo, diffusion-weighted echo planar imaging sequence (FOV=245mm; matrix size=128×128; N-slices=57; voxel size=2.2mm isotropic; TR=6700ms; TE=85ms; fat saturation). In total, 31 volumes were acquired per subject, one without diffusion weighting (b=0 s/mm2) and 30 with diffusion weighting (b=1000 s/mm2) along 30 non-collinear directions. The 12-directional DTI-sequence included a single-shot, spin-echo, diffusion-weighted echo planar imaging sequence (FOV=220mm; matrix size=128×128; N-slices=40; slice thickness=3mm; TR=6500ms, TE=99ms). In total 13 volumes were acquired per subject, one without diffusion-weighting and 12 with diffusion-weighting along 12 non-collinear directions. An equal proportion of data from each DTI-sequence was available per subject group (approximately 25% 12-directional; 75% 30-directional; X2=0.03, p=0.98) and thus there is unlikely to be DTI-sequence bias across groups. To be conservative we minimized any potential DTI-sequence bias by including a nuisance covariate for DTI-sequence in all DTI analyses.
DWI were preprocessed using ANTS(23) and Camino(25) within the associated PipeDream (http://sourceforge.net/projects/neuropipedream/) analysis framework. Motion and distortion artifacts were removed by affine co-registration of each DWI to the unweighted image. Diffusion tensors were computed using a weighted-linear-least-squares algorithm implemented in Camino. Each participant’s T1 image was warped to the template via the symmetric diffeomorphic procedure in ANTS described above. Distortion between participants’ T1 and DT images was corrected by regularized intra-subject registration of the FA image to the T1 image. The DT image was then warped to template space by applying both the intra-subject (FA to participant T1) and inter-subject (participant T1 to template) warps.
Neuroimaging Analysis
To analyze cortical thickness and FA we employed Eigenanatomy (available within the sccan algorithm in the ANTs toolkit).(26) Eigenanatomy involves identifying volumes-of-interest (VOIs) composed of correlated voxels that maximally account for the greatest variance in the entire dataset.(14,26) By reducing the dimensionality of the data from over 1M voxels to N-1 Eigenanatomy VOIs, we can perform high-powered statistics. Eigenanatomy is based on sparse singular value decomposition and identifies the VOI that accounts for the greatest variance first, the second most variance second, and so on. To identify these VOIs, all normalized GM thickness volumes are first transformed into a number-of-subjects (N) by number-of-cortical-voxels matrix where voxels are selected to lie within a GM cortical mask. Sparse singular value decomposition is then used to identify the first N sparse eigenvectors from the data matrix. The ANTs implementation of Eigenanatomy employs a sparseness penalty on the eigenvectors such that (1) the entries of the eigenvector are both sparse (i.e. have many zero entries) and non-negative and (2) the non-zero voxels are clustered and exceed a cluster extent threshold (>50 adjacent voxels). The sparseness and non-negativity allows the eigenvectors to be interpreted as weighted averages of the original data, resembling a distributed version of a traditional region of interest. We refer to each of these distributed regions as an Eigenanatomy VOI. We employ an identical procedure for our analysis of FA using a WM atlas(27) explicit mask to constrain analyses to regions of probabilistically-likely WM tracts.
Classification Analysis
To evaluate the ability of neuroimaging to discriminate between FTLD-TDP and FTLD-TAU, we performed leave-one-out linear logistic regressions for each modality (MRI, DTI). To identify the optimal model for each neuroimaging modality, we performed N-1 training logistic regressions by iteratively increasing the number of eigenvectors included in the model (e.g., FTLD.GROUP ~ EIG1; FTLD.GROUP ~ EIG1 + EIG2 + …EIGN-1) and for each model generated a prediction for the left-out patient. We then performed an ROC curve analysis using predicted data and selected the model that achieved the highest area under the curve (AUC). This revealed that the GM model that included the first three Eigenanatomy VOIs and the FA model that included the first Eigenanatomy VOI achieved the highest AUCs, respectively, 0.55 and 1.0. We report sensitivity and specificity for each selected model using an a priori defined probabilistic cutoff value of 0.714 since this proportion of patients were included in the FTLD-TDP group.
Results
Classification of FTLD-TAU and FTLD-TDP using Fractional Anisotropy
An ROC curve analysis based on a logistic regression with the first FA-eigenvector revealed 96% sensitivity and 100% specificity for classifying FTLD-TDP (Figure 1). The FA-eigenvector volume included two clusters located in the left and right superior longitudinal fasciculi (Figure 2.A). This FA-eigenvector correctly classified all FTLD-TAU cases and 24 of 25 FTLD-TDP cases. Refer to Table 2 for a description of the misclassified case.
Figure 1.
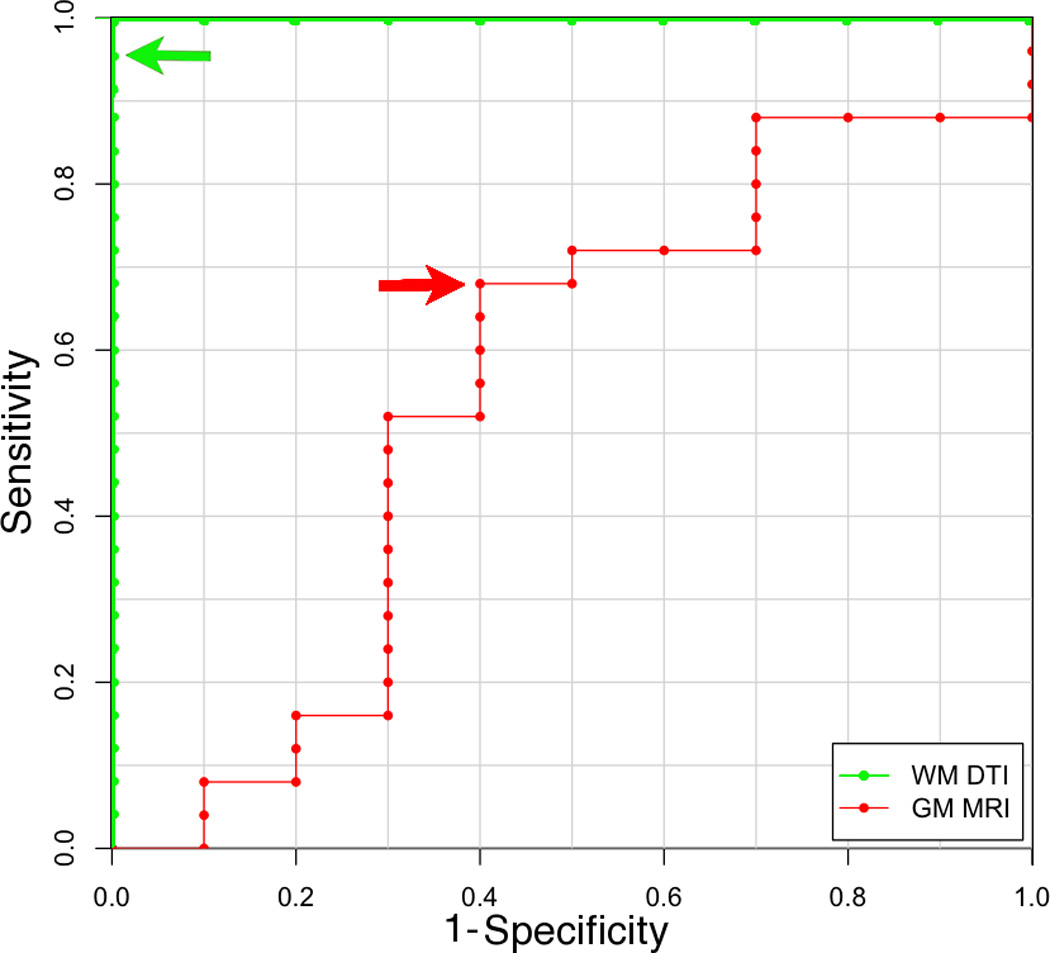
Receiver operator characteristic (ROC) curves illustrating sensitivity and specificity of diffusion tensor imaging classifiers of white matter (green) and cortical thickness classifiers of grey matter (red) for discriminating between FTLD-TDP (sensitivity) and FTLD-TAU (specificity). Arrows indicate cutoff thresholds for each classifier.
Figure 2.

(A) Eigenanatomy volume of interest for fractional anisotropy (FA) with optimal classification of FTLD-TDP and FTLD-TAU is highlighted in orange within the corpus callosum (opaque color) overlaid on RGB image illustrating the direction of the white matter tracts (anterior-posterior=green; superior-inferior=blue; left-right=red); (B) Red, green, and blue regions represent Eigenanatomy volumes of interest for grey matter cortical thickness with optimal classification of FTLD-TDP and FTLD-TAU.
Table 2.
Neuropathological, genetic, clinical, and demographic details for misclassified cases.
| Case | Neuropathological Diagnosis / Genetic Mutation | Clinical Phenotype | Demographic Features1 |
|---|---|---|---|
| White matter analysis misclassified case(s): | |||
| WM.1 | FTLD-TDP; intermediate tangles (Braak Stage III-IV) | bvFTD | MMSE=18 |
| Grey matter analysis misclassified case(s): | |||
| GM.1 | Tauopathy NOS; MAPT (p.G389R) | bvFTD | MMSE=0 |
| GM.2 | MAPT pathogenic mutation (E10+16C>T) | PNFA | |
| GM.3 | PSP | PSP | |
| GM.4 | PSP | CBS | |
| GM.5 | C9orf72 expansion | PNFA | |
| GM.6 | C9orf72 expansion | bvFTD | Disease Duration=8 yrs. |
| GM.7 | C9orf72 expansion | bvFTD | Disease Duration=7 yrs. |
| GM.8 | C9orf72 expansion | bvFTD/ALS | |
| GM.9 | GRN (p.V279GfsX5) | CBS | Education=6 yrs. |
| GM.10 | GRN (p.Thr272SerfsX10) | CBS | MMSE=12 |
| GM.11 | GRN (p.V90SfsX67) | CBS | |
| GM.12 | FTLD with TDP-43 inclusions; GRN (p.R418X) | PNFA | |
| GM.13 | FTLD with TDP-43 inclusions 114753 | bvFTD | |
Note. Case numbers (e.g., WM.1) provide an arbitrary label for each misclassified case.
Only includes demographic features that differ more than 2.5 standard deviations from means reported in Table 1.
Classification of FTLD-TAU and FTLD-TDP using Gray Matter Thickness
An ROC curve analysis based on a logistic regression model included the first three GM Eigenanatomy volumes and revealed 64% sensitivity and 60% specificity for classifying FTLD-TDP (Figure 1). The GM Eigenanatomy volumes, in order of accounted variance, included: angular gyrus, amygdala, and caudate (Figure 2.B). The misclassified cases included 4 out of 10 FTLD-TAU patients and 9 out of 25 FTLD-TDP patients (see Table 2 for a summary of misclassified cases).
In order to evaluate if there was a relationship between GM prediction and WM prediction we additionally performed a correlation analysis (see Supplementary Figure 1). This analysis revealed no significant relationship between GM and WM prediction accuracy [r(33)=0.11; p>0.1] suggesting that both modalities capture independent measures of pathology associated with FTLD.
Neuropathological Evaluation in Autopsy Cohort
Mann-Whitney U comparisons evaluated pathological burden in the GM of the angular gyrus and the WM of the superior longitudinal fasciculus since these adjacent regions were implicated as having the greatest classification accuracy in both the GM and WM neuroimaging analyses. Representative samples of WM degeneration, WM inclusion burden, GM neuronal loss, and GM inclusion burden for FTLD-TAU and FTLD-TDP are illustrated in Figure 3. As summarized in Figure 4, we observe a significant difference between FTLD-TAU and FTLD-TDP in measures of WM degeneration (MannU=5.5; p<0.05) and WM inclusion burden (MannU=7.5; p<0.05), with both measures being more severe in FTLD-TAU than FTLD-TDP. There was also a trend toward greater GM neuronal loss for FTLD-TDP relative to FTLD-TAU (MannU=10.0; p=0.09). GM inclusions did not differ across pathological subtypes (MannU=19.0; p>0.10). An evaluation of WM and GM inclusion burden in a control region in the temporal lobe and adjacent uncinate fasiculus, which was not implicated in the neuroimaging analyses did not yield significant differences across groups: WM inclusion (MannU=28.5; p>0.10) and GM inclusion (MannU=25.5; p>0.10) burden. This suggests that the angular gyrus and adjacent superior longitudinal fasciulus are specific for discriminating between FTLD-TDP and FTLD-TAU. Together, these findings parallel our neuroimaging analyses and emphasize the contribution of WM analyses in the distinction between FTLD-TAU and FTLD-TDP.
Figure 3.

Neuropathological evidence for a dissociation of grey matter (GM) and white matter (WM) burden in representative cases of FTLD-TAU and FTLD-TDP at 40x (Scale bar represents 100μm): (A) LFB stain for WM degeneration for FTLD-TAU; (B) Tau inclusions in WM for FTLD-TAU; (C) H-E stain for neuronal loss in GM for FTLD-TAU; (D) Tau inclusions in GM for FTLD-TAU; (E) LFB stain for WM degeneration for FTLD-TDP; (F) TDP-43 inclusions in WM for FTLD-TDP; (G) H-E stain for neuronal loss in GM in for FTLD-TDP; (D) TDP-43 inclusions in GM for FTLD-TDP.
Figure 4.
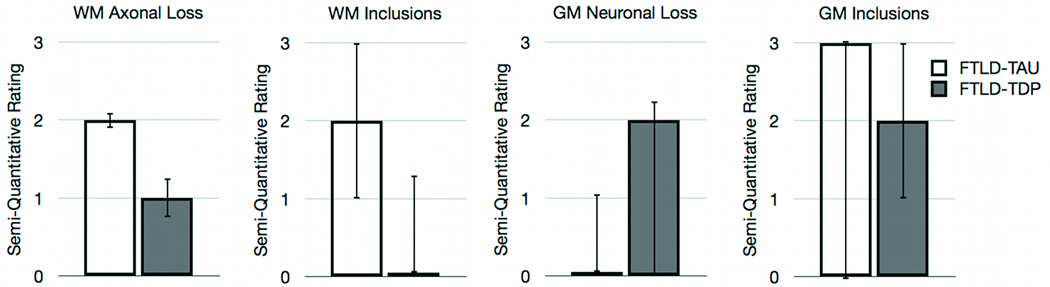
Median semi-quantitative ratings (interquartile range) for neuropathological measures of angular gyrus and adjacent white matter in the superior longitudinal fasciculus.
Discussion
FTLD is a heterogeneous neurodegenerative condition associated mainly with FTLD-TAU or FTLD-TDP pathology. Previous investigations have suggested significant GM and WM pathology in FTLD-TAU,(9) while FTLD-TDP generally has greater GM than WM pathology.(10) Our comparative neuroimaging analyses suggest that WM disease, as reflected in DTI measurements of FA, is significantly more prominent in FTLD-TAU than FTLD-TDP. These in vivo DTI measures of substantial WM disease in FTLD-TAU relative to FTLD-TDP were confirmed by ex vivo comparative neuropathological measures of WM in a subset of the same patients. GM measures showed differences between FTLD-TAU and FTLD-TDP as well, but were relatively modest. Thus, multimodal neuroimaging that includes DTI assessment of WM may be a promising biomarker that helps establish an in vivo diagnosis distinguishing between FTLD-TDP and FTLD-TAU in individual patients.
Previous group-level studies have shown that FTLD-TAU and FTLD-TDP have reduced WM volume relative to older controls,(11,12) and one study reported that FTLD-TAU has reduced WM volume in the anterior corpus callosum relative to FTLD-TDP.(11) By comparison, previous group-level neuroimaging comparisons of GM in FTLD-TAU and FTLD-TDP using volumetric T1 MRI have yielded mixed results. Some work has found different patterns of GM atrophy in FTLD-TAU and FTLD-TDP,(11,28) while others have reported no significant GM differences between FTLD-TAU and FTLD-TDP.(12) This is consistent with our observation that GM neuroimaging achieves only modest sensitivity and specificity for evaluating pathology in individual cases, and suggests that GM neuroimaging alone may not be sufficient as a candidate biomarker for predicting histopathological abnormalities in FTLD.
Recent work suggests that multimodal imaging is helpful for in vivo diagnosis since the addition of WM neuroimaging to GM neuroimaging optimizes discrimination between FTLD and AD.(13,14) These previous finidngs may have been due in part to the WM changes in the subgroup of FTLD patients with tau pathology. In one previous study GM and WM neuroimaging datasets were combined by using covariates for each modality in a logistic regression.(13) In another study the two modalities were combined statistically using a multivariate sparse canonical correlation analysis to evaluate how GM and WM changes associated with FTLD and AD were related to one another.(14) In the current study we did not evaluate a multimodal approach since WM alone achieved such high accuracy for discriminating between FTLD-TAU and FTLD-TDP and there was a pathological basis for this observation. Additionally, our comparison of WM prediction to GM prediction suggested that both of these neuroimaging measures are independent from one another, which is consistent with our hypothesis that FA would capture WM pathology that is specific to FTLD-TAU.
Discrepancies between our findings and previous work failing to discriminate between FTLD-TAU and FTLD-TDP may have been due in part to our use of optimized imaging analysis procedures. Our use of Eigenanatomy benefits from massive data reduction and therefore allows us to implement powerful prediction statistics.(26) In a previous study using a similar Eigenanatomy approach, we demonstrated that neuroimaging can be used to predict cerebrospinal fluid analytes,(29) thereby reducing the need for repeated lumbar punctures during a treatment trial. Importantly, both the current study and previous work using Eigenanatomy rely on cross-validation and prediction-based statistics to illustrate a relationship between pathology and neuroimaging, and to demonstrate that neuroimaging can be used to derive specific predictions about pathology in individual patients.
We took advantage of previous neuropathological reports of significant WM disease burden in FTLD-TAU(9) but modest WM disease in FTLD-TDP, and used this observation to motivate an in vivo WM neuroimaging study to help distinguish between these histopathologic subgroups. Our DTI results suggest that reduced FA in bilateral superior longitudinal fasciculus yields optimal classification accuracy for discriminating between FTLD-TAU and FTLD-TDP. A previous study from our lab also found reduced FA in superior longitudinal fasciculus in autopsy-confirmed patients with the non-fluent/agrammatic variant of primary progressive aphasia,(30) and sporadic forms of this clinical syndrome are more often associated with FTLD-TAU than FTLD-TDP pathology.(5) This overlap between WM regions in the current study and a region observed in the prior clinicopathological study provides converging evidence that the superior longitudinal fasciculus is specific for FTLD-TAU. We confirmed our findings by observing significant WM degeneration and a higher rate of inclusions for FTLD-TAU compared to FTLD-TDP in this region and, importantly, WM and GM inclusion burden did not differ in a control region. It is unlikely that our findings are related to distinct subtypes of TDP-43 proteinopathy that have varying degrees of neuronal loss and gliosis in WM.(10) In our sample, most FTLD-TDP patients were TDP subtypes A or B (5/6 88.3%), which contain a higher burden of TDP-43 immunoreactive glial pathology compared with, for example, subtype C.(10) Another potential confound is that non-FTLD spectrum pathology can be intermixed in these diseases,(31) but in our autopsy-confirmed sample only one case of FTLD-TAU (PSP) and one case of FTLD-TDP had sufficient density of neurofibrillary tangles and senile plaques to meet criteria for a secondary diagnosis of low probability AD.(32) Future validation studies that involve extensive training and testing procedures will be necessary to determine whether superior longitudinal fasciculus is a “signature region” of FTLD-TAU, paralleling signature regions for AD.(33)
This study provides the only report that we are aware of that evaluates in vivo neuroimaging and ex vivo neuropathological examination of specific histopathological abnormalities in the same neurodegenerative disease patient cohort. Despite the time delay between neuroimaging and autopsy, our observations suggest that the WM dissociation observed at autopsy between FTLD-TAU and FTLD-TDP are detectable at earlier stages of the disease using DTI. An important direction of future research will be to evaluate how different DTI measures (e.g., radial diffusivity, axial diffusivity, mean diffusivity, and fractional anisotropy) reflect fine-grained microstructural changes associated with specific histopathological abnormalities (e.g., neuronal loss, axonal loss, demyelination, etc..). In the current study we only focused on fractional anisotropy since at first evaluation this measure alone achieved high sensitivity and specificity.
An important caveat to consider when interpreting our findings is concerned with the clinical characteristics of our cohort. A shortcoming of pathological studies is that they are performed after end stage disease when patients are typically too impaired to participate in a detailed clinical examination. Previous studies have investigated how the distribution of disease is modulated by underlying pathology in a single clinical phenotype and have achieved mixed findings. It has been reported that naPPA and lvPPAA have either a more anterior or posterior distribution of GM disease depending on whether they have FTLD or AD pathology, respectively.(34) A study of the distribution of GM disease in an autopsy-confirmed behavioral variant FTLD cohort revealed distinct patterns of atrophy depending on the source of FTLD pathology (28) while a study of svPPA reported similar patterns of GM disease independent of different sources of FTLD pathology.(35) Importantly, none of these previous studies investigated how WM is affected by different sources of FTLD-TAU or FTLD-TDP pathology. There is some value to identifying diagnostic features that can discriminate between FTLD-TAU and FTLD-TDP regardless of the clinical phenotype so that patients may be entered into a disease-modifying clinical trial with equal confidence. The current study combined samples with a range of clinical phenotypes and, despite the clinical heterogeneity of our cohort, we observed that DTI may provide a promising biomarker for identifying whether living patients have FTLD-TAU and FTLD-TDP on an individual case by case basis.
Our study additionally contained some genetic heterogeneity and we did not discriminate between different subtypes of FTLD-TAU or FTLD-TDP pathology. Previous studies have investigated GM neuroimaging in specific genetic mutations associated with FTLD, and these may yield different distributions of disease compared to sporadic cases with the same underlying pathology.(36–38) Also, finer-grained distinctions of FTLD subtype pathology relative to healthy cohorts have suggested that these may yield distinct patterns of atrophy (39,40). Additional work is needed to systematically evaluate neuroimaging in inherited and sporadic disorders with a range of clinical and pathological presentations to optimize the generalizability of neuroimaging biomarkers.
There are additionally technical caveats to consider when interpreting our results. These are both related to the relatively new emergence of high-quality DTI procedures in combination with a several year duration between in vivo DTI acquisition and ex vivo neuropathological exam. First, given these limited samples we were restricted to using leave- one-out cross-validation. As more pathologically-validated cases of high-resolution DTI data become available we anticipate that we will be able to use more advanced classification algorithms, including the testing of our prediction algorithms in an independent dataset. Second, DTI data used in this prediction study was comprised of a small proportion of lower-resolution data (25%). It is possible that classification accuracy may be more accurate when using high-resolution datasets. Importantly, despite these technical limitations we were able to reliably discriminate between FTLD-TAU and FTLD-TDP and we were able to establish that our DTI results were convergent with white matter measures of tissue pathology.
In conclusion, FTLD-TDP and FTLD-TAU appear to have distinct patterns of WM change in neuroimaging studies, paralleling our neuropathological observations. We found that DTI improves the ability to discriminate between histopathological subtypes of FTLD during life. In the context of a treatment trial, DTI thus may provide a promising, non-invasive screening measure that is both sensitive and specific. A multimodal neuroimaging approach that incorporates both T1 imaging of GM and DTI imaging of WM therefore may contribute to screening patients for treatment trials designed to target specific histopathological abnormalities.
Supplementary Material
Acknowledgments
This work was supported in part by the Wyncote Foundation and the National Institutes of Health: T32-AG000255; NS065347; AG010124, AG032953, AG017586; AG000255; NS044266, AG015116, NS053488. JBT is supported by the Alfonso Martín Escudero Foundation. The authors would like to thank would also like to thank Dr. Peter Davies for the kind gift of the paired-helical filament-1 monoclonal antibody used in our study.
Footnotes
All other authors report no financial disclosures.
References
- 1.Ratnavalli E, Brayne C, Dawson K, Hodges JR. The prevalence of frontotemporal dementia. Neurology. 2002 Jun 11;58(11):1615–1621. doi: 10.1212/wnl.58.11.1615. [DOI] [PubMed] [Google Scholar]
- 2.Knopman DS, Roberts RO. Estimating the Number of Persons with Frontotemporal Lobar Degeneration in the US Population. J. Mol. Neurosci. 2011 May 17;45(3):330–335. doi: 10.1007/s12031-011-9538-y. [DOI] [PMC free article] [PubMed] [Google Scholar]
- 3.Mackenzie IRA, Neumann M, Bigio EH, Cairns NJ, Alafuzoff I, Kril J, et al. Nomenclature for neuropathologic subtypes of frontotemporal lobar degeneration: consensus recommendations. Acta Neuropathol. 2009;117(1):15–18. doi: 10.1007/s00401-008-0460-5. [DOI] [PMC free article] [PubMed] [Google Scholar]
- 4.Mackenzie IRA, Neumann M, Bigio EH, Cairns NJ, Alafuzoff I, Kril J, et al. Nomenclature and nosology for neuropathologic subtypes of frontotemporal lobar degeneration: an update. Acta Neuropathol. 2010 Jan;119(1):1–4. doi: 10.1007/s00401-009-0612-2. [DOI] [PMC free article] [PubMed] [Google Scholar]
- 5.Grossman M. Primary progressive aphasia: clinicopathological correlations. Nat Rev Neurol. Nature Publishing Group. 2010 Feb 1;6(2):88–97. doi: 10.1038/nrneurol.2009.216. [DOI] [PMC free article] [PubMed] [Google Scholar]
- 6.Josephs KA, Hodges JR, Snowden JS, Mackenzie IR, Neumann M, Mann DM, et al. Neuropathological background of phenotypical variability in frontotemporal dementia. Acta Neuropathol. 2011 Aug;122(2):137–153. doi: 10.1007/s00401-011-0839-6. [DOI] [PMC free article] [PubMed] [Google Scholar]
- 7.Hu WT, Mandrekar JN, Parisi JE, Knopman DS, Boeve BF, Petersen RC, et al. Clinical features of pathologic subtypes of behavioral--variant frontotemporal dementia. Arch Neurol. 2007 Nov 1;64(11):1611–1616. doi: 10.1001/archneur.64.11.1611. [DOI] [PubMed] [Google Scholar]
- 8.Hu WT, Chen-Plotkin A, Grossman M, Arnold SE, Clark CM, Shaw LM, et al. Novel CSF biomarkers for frontotemporal lobar degenerations. Neurology. 2010 Dec 7;75(23):2079–2786. doi: 10.1212/WNL.0b013e318200d78d. [DOI] [PMC free article] [PubMed] [Google Scholar]
- 9.Forman MS, Zhukareva V, Bergeron C, Chin SS-M, Grossman M, Clark C, et al. Signature tau neuropathology in gray and white matter of corticobasal degeneration. Am. J. Pathol. 2002 Jun;160(6):2045–2053. doi: 10.1016/S0002-9440(10)61154-6. [DOI] [PMC free article] [PubMed] [Google Scholar]
- 10.Geser F, Martinez-Lage M, Robinson J, Uryu K, Neumann M, Brandmeir NJ, et al. Clinical and pathological continuum of multisystem TDP-43 proteinopathies. Arch Neurol. 2009 Feb;66(2):180–189. doi: 10.1001/archneurol.2008.558. [DOI] [PMC free article] [PubMed] [Google Scholar]
- 11.Kim EJ, Rabinovici GD, Seeley WW, Halabi C, Shu H, Weiner MW, et al. Patterns of MRI atrophy in tau positive and ubiquitin positive frontotemporal lobar degeneration. J Neurol Neurosurg Psychiatr. 2007 Dec;78(12):1375–1378. doi: 10.1136/jnnp.2006.114231. [DOI] [PMC free article] [PubMed] [Google Scholar]
- 12.Rohrer JD, Lashley T, Schott JM, Warren JE, Mead S, Isaacs AM, et al. Clinical and neuroanatomical signatures of tissue pathology in frontotemporal lobar degeneration. Brain. 2011 Sep;134(Pt 9):2565–2581. doi: 10.1093/brain/awr198. [DOI] [PMC free article] [PubMed] [Google Scholar]
- 13.McMillan CT, Brun C, Siddiqui S, Churgin M, Libon D, Yushkevich P, et al. White matter imaging contributes to the multimodal diagnosis of frontotemporal lobar degeneration. Neurology. 2012 May 29;78(22):1761–1768. doi: 10.1212/WNL.0b013e31825830bd. [DOI] [PMC free article] [PubMed] [Google Scholar]
- 14.Avants BB, Cook PA, Ungar L, Gee JC, Grossman M. Dementia induces correlated reductions in white matter integrity and cortical thickness: a multivariate neuroimaging study with sparse canonical correlation analysis. NeuroImage. 2010 Apr 15;50(3):1004–1016. doi: 10.1016/j.neuroimage.2010.01.041. [DOI] [PMC free article] [PubMed] [Google Scholar]
- 15.Forman MS, Farmer J, Johnson JK, Clark CM, Arnold SE, Coslett HB, et al. Frontotemporal dementia: clinicopathological correlations. Ann Neurol. 2006 Jun;59(6):952–962. doi: 10.1002/ana.20873. [DOI] [PMC free article] [PubMed] [Google Scholar]
- 16.Otvos L, Feiner L, Lang E, Szendrei GI, Goedert M, Lee VM. Monoclonal antibody PHF-1 recognizes tau protein phosphorylated at serine residues 396 and 404. J. Neurosci. Res. 1994 Dec 15;39(6):669–673. doi: 10.1002/jnr.490390607. [DOI] [PubMed] [Google Scholar]
- 17.Lippa CF, Rosso AL, Stutzbach LD, Neumann M, Lee VM-Y, Trojanowski JQ. Transactive response DNA-binding protein 43 burden in familial Alzheimer disease and Down syndrome. Arch Neurol. 2009 Dec;66(12):1483–1488. doi: 10.1001/archneurol.2009.277. [DOI] [PMC free article] [PubMed] [Google Scholar]
- 18.Neumann M, Kwong LK, Lee EB, Kremmer E, Flatley A, Xu Y, et al. Phosphorylation of S409/410 of TDP-43 is a consistent feature in all sporadic and familial forms of TDP-43 proteinopathies. Acta Neuropathol. 2009 Feb;117(2):137–149. doi: 10.1007/s00401-008-0477-9. [DOI] [PMC free article] [PubMed] [Google Scholar]
- 19.Mackenzie IRA, Neumann M, Baborie A, Sampathu DM, Plessis Du D, Jaros E, et al. A harmonized classification system for FTLD-TDP pathology. Acta Neuropathol. 2011 Jul;122(1):111–113. doi: 10.1007/s00401-011-0845-8. [DOI] [PMC free article] [PubMed] [Google Scholar]
- 20.Mirra SS, Heyman A, McKeel D, Sumi SM, Crain BJ, Brownlee LM, et al. The Consortium to Establish a Registry for Alzheimer“s Disease (CERAD). Part II. Standardization of the neuropathologic assessment of Alzheimer”s disease. Neurology. 1991 Apr;41(4):479–486. doi: 10.1212/wnl.41.4.479. [DOI] [PubMed] [Google Scholar]
- 21.Brettschneider J, Van Deerlin V, Robinson JL, Kwong L, Lee EB, Ali YO, et al. Ubiquillin pathology in ALS and FTLD is determined by the presence of C90RF72 hexanuceotide expansion. Acta Neuropathol. 2012 doi: 10.1007/s00401-012-0970-z. [DOI] [PMC free article] [PubMed] [Google Scholar]
- 22.Yu C-E, Bird TD, Bekris LM, Montine TJ, Leverenz JB, Steinbart E, et al. The spectrum of mutations in progranulin: a collaborative study screening 545 cases of neurodegeneration. Arch Neurol. 2010 Feb;67(2):161–170. doi: 10.1001/archneurol.2009.328. [DOI] [PMC free article] [PubMed] [Google Scholar]
- 23.Avants BB, Epstein CL, Grossman M, Gee JC. Symmetric diffeomorphic image registration with cross-correlation: evaluating automated labeling of elderly and neurodegenerative brain. Med Image Anal. 2008 Feb;12(1):26–41. doi: 10.1016/j.media.2007.06.004. [DOI] [PMC free article] [PubMed] [Google Scholar]
- 24.Das SR, Avants BB, Grossman M, Gee JC. Registration based cortical thickness measurement. NeuroImage. 2009 Apr 15;45(3):867–879. doi: 10.1016/j.neuroimage.2008.12.016. [DOI] [PMC free article] [PubMed] [Google Scholar]
- 25.Cook P, Bai Y, Nedjati-Gilani S. Camino: Open-source diffusion-MRI reconstruction and processing. International Society for Magnetic Resonance Imaging in Medicine. 2006:2759. [Google Scholar]
- 26.Avants B, Dhillon P, Kandel BM, Cook PA, McMillan CT, Grossman M, et al. Eigenanatomy Improves Detection Power for Longitudinal Cortical Change. Medical image computing and computer-assisted intervention : MICCAI. 2012:206–213. doi: 10.1007/978-3-642-33454-2_26. [DOI] [PMC free article] [PubMed] [Google Scholar]
- 27.Oishi K, Zilles K, Amunts K, Faria A, Jiang H, Li X, et al. Human brain white matter atlas: identification and assignment of common anatomical structures in superficial white matter. NeuroImage. 2008 Nov 15;43(3):447–457. doi: 10.1016/j.neuroimage.2008.07.009. [DOI] [PMC free article] [PubMed] [Google Scholar]
- 28.Whitwell JL, Jack CR, Parisi JE, Knopman DS, Boeve BF, Petersen RC, et al. Imaging signatures of molecular pathology in behavioral variant frontotemporal dementia. J. Mol. Neurosci. 2011 Nov;45(3):372–378. doi: 10.1007/s12031-011-9533-3. [DOI] [PMC free article] [PubMed] [Google Scholar]
- 29.McMillan CT, Avants B, Irwin DJ, Toledo JB, Wolk DA, Van Deerlin VM, et al. Can MRI screen for cerebrospinal fluid biomarkers in neurodegenerative disease? Neurology. 2012 doi: 10.1212/WNL.0b013e31827b9147. [DOI] [PMC free article] [PubMed] [Google Scholar]
- 30.Grossman M, Powers J, Ash S, McMillan C, Burkholder L, Irwin D, et al. Disruption of large-scale neural networks in non-fluent/agrammatic variant primary progressive aphasia associated with frontotemporal degeneration pathology. Brain Lang. 2012 doi: 10.1016/j.bandl.2012.10.005. [DOI] [PMC free article] [PubMed] [Google Scholar]
- 31.Toledo JB, Brettschneider J, Grossman M, Arnold SE, Hu WT, Xie SX, et al. CSF biomarkers cutoffs: the importance of coincident neuropathological diseases. Acta Neuropathol. 2012 Apr 22; doi: 10.1007/s00401-012-0983-7. [DOI] [PMC free article] [PubMed] [Google Scholar]
- 32.Consensus recommendations for the postmortem diagnosis of Alzheimer“s disease. The National Institute on Aging, and Reagan Institute Working Group on Diagnostic Criteria for the Neuropathological Assessment of Alzheimer”s Disease. Neurobiol. Aging. 1997:S1–S2. [PubMed] [Google Scholar]
- 33.Dickerson BC, Wolk DA. On behalf of the Alzheimer's Disease Neuroimaging Initiative. MRI cortical thickness biomarker predicts AD-like CSF and cognitive decline in normal adults. Neurology. 2012 Jan 10;78(2):84–90. doi: 10.1212/WNL.0b013e31823efc6c. [DOI] [PMC free article] [PubMed] [Google Scholar]
- 34.Hu WT, McMillan C, Libon D, Leight S, Forman M, Lee VM-Y, et al. Multimodal predictors for Alzheimer disease in nonfluent primary progressive aphasia. Neurology. 2010 Aug 17;75(7):595–602. doi: 10.1212/WNL.0b013e3181ed9c52. [DOI] [PMC free article] [PubMed] [Google Scholar]
- 35.Pereira JMS, Williams GB, Acosta-Cabronero J, Pengas G, Spillantini MG, Xuereb JH, et al. Atrophy patterns in histologic vs clinical groupings of frontotemporal lobar degeneration. Neurology. 2009 May 12;72(19):1653–1660. doi: 10.1212/WNL.0b013e3181a55fa2. [DOI] [PMC free article] [PubMed] [Google Scholar]
- 36.Whitwell JL, Weigand SD, Boeve BF, Senjem ML, Gunter JL, DeJesus-Hernandez M, et al. Neuroimaging signatures of frontotemporal dementia genetics: C9ORF72, tau, progranulin and sporadics. Brain. 2012 Mar;135(Pt 3):794–806. doi: 10.1093/brain/aws001. [DOI] [PMC free article] [PubMed] [Google Scholar]
- 37.Rohrer JD, Warren JD. Phenotypic signatures of genetic frontotemporal dementia. Curr. Opin. Neurol. 2011 Dec;24(6):542–549. doi: 10.1097/WCO.0b013e32834cd442. [DOI] [PubMed] [Google Scholar]
- 38.Irwin DJ, McMillan CT, Brettschneider J, Libon DJ, Powers J, Rascovsky K, et al. Cognitive decline and reduced survival in C9orf72 expansion Frontotemporal degeneration and Amyotrophic lateral sclerosis. J Neurol Neurosurg Psychiatr. 2012 doi: 10.1136/jnnp-2012-303507. [DOI] [PMC free article] [PubMed] [Google Scholar]
- 39.Rohrer JD, Ridgway GR, Modat M, Ourselin S, Mead S, Fox NC, et al. Distinct profiles of brain atrophy in frontotemporal lobar degeneration caused by progranulin and tau mutations. NeuroImage. 2010 Nov 15;53(3):1070–1076. doi: 10.1016/j.neuroimage.2009.12.088. [DOI] [PMC free article] [PubMed] [Google Scholar]
- 40.Whitwell JL, Jack CR, Parisi JE, Senjem ML, Knopman DS, Boeve BF, et al. Does TDP-43 type confer a distinct pattern of atrophy in frontotemporal lobar degeneration? Neurology. 2010 Dec 14;75(24):2212–2220. doi: 10.1212/WNL.0b013e31820203c2. [DOI] [PMC free article] [PubMed] [Google Scholar]
Associated Data
This section collects any data citations, data availability statements, or supplementary materials included in this article.