Abstract
Objectives
The ability to estimate tissue perfusion (in mL/min/g) in vivo using contrast-enhanced three-dimensional (3D) harmonic and subharmonic ultrasound imaging was investigated.
Materials and Methods
A Logiq 9 scanner (GE Healthcare, Milwaukee, WI) equipped with a 4D10L probe was modified to perform 3D harmonic imaging (HI; ftransmit = 5 MHz and freceive = 10 MHz) and subharmonic imaging (SHI; ftransmit= 5.8 MHz and freceive= 2.9 MHz). In vivo imaging was performed in the lower pole of both kidneys in five open-abdomen canines after injection of the ultrasound contrast agent (UCA) Definity (Lantheus Medical Imaging, N Billerica, MA). The canines received a 5 μL/kg bolus injection of Definity for HI and a 20 μL/kg bolus for SHI in triplicate for each kidney. Ultrasound data acquisition was started just prior to injection of UCA (in order to capture the wash-in) and continued until washout. A microvascular staining technique based on stable (non-radioactive) isotope-labeled microspheres (Biophysics Assay Laboratory Inc, Worcester, MA) was used to quantify the degree of perfusion in each kidney (the reference standard). Ligating a surgically exposed branch of the renal arteries induced lower perfusion rates. This was followed by additional contrast-enhanced imaging and microsphere injections to measure post-ligation perfusion. Slice data were extracted from the 3D ultrasound volumes and used to generate time-intensity curves off-line in the regions corresponding to the tissue samples used for microvascular staining. The mid-line plane was also selected from the 3D volume (as a quasi-2D image) and compared to the 3D imaging modes. Perfusion was estimated from the initial slope of the fractional blood volume uptake (for both HI and SHI) and compared to the reference standard using linear regression analysis.
Results
Both 3D HI and SHI were able to provide visualization of flow and, thus, perfusion in the kidneys. However, SHI provided near complete tissue suppression and improved visualization of UCA flow. Microsphere perfusion data were available for 4 canines (1 was excluded because of an error with the reference blood sample) and showed an average perfusion of 9.30 ± 6.60 and 5.15 ± 3.42 mL/min/g pre and post ligation, respectively. The reference standard showed significant correlation with overall 3D HI perfusion estimates (r=0.38; P=0.007), but correlated more strongly with 3D SHI (r=0.62; P<0.001). Additionally, these results showed an improvement over the quasi-2D HI and SHI perfusion estimates (r=−0.05 and r=0.14) and 2D SHI perfusion estimates previously reported by our group (r=0.57)
Conclusions
In this preliminary study, 3D contrast-enhanced nonlinear ultrasound was able to quantify perfusion in vivo. 3D SHI resulted in better overall agreement with the reference standard than 3D HI and was superior to previously reported 2D SHI results. 3D SHI outperforms the other methods for estimating blood perfusion, due to the improved visualization of the complete perfused vascular networks.
Keywords: Subharmonic imaging, harmonic imaging, 3D ultrasound, ultrasound contrast agents, perfusion estimation
Introduction
The ability to quantify blood flow in tissue, organs and tumors can provide information necessary to diagnose abnormalities or monitor treatment. It has been shown that by combining ultrasound imaging with microbubble based contrast agents it possible to increase the sensitivity to blood flow in both macro and microvasculature1–3. Hence, contrast-enhanced ultrasound imaging has been used widely as a tool for blood perfusion imaging4–14. Renal quantitative perfusion imaging using both wash-in and destruction-reperfusion of ultrasound contrast agents (UCA) has been able to produce good correlation (r>0.9) with absolute perfusion4, 5. Perfusion derived parameters such as time-to-peak, peak-intensity, wash-in slope and mean transit time also have shown promise in identifying altered hepatic hemodynamics7 as well as in microvascular applications monitoring antiangiogenic treatment of tumors9–11, 13. Determination of thresholds for identification of critical changes in perfusion and development of parametric perfusion maps in cases of acute ischemic stroke using contrast-enhanced ultrasound have also been studied12, 15. Parameters (such as arterial liver perfusion, portal-venous perfusion) derived from time-intensity curves using curve-fitting techniques for studying malignant liver tumors have shown moderate correlation with dynamic contrast-enhanced computed tomography (CT) in terms of quantifying perfusion8. Also, the use of UCA wash-out (presence and timing) in the differential diagnosis of hypervascular liver masses has proven to be feasible6. Most perfusion studies to date have been performed using conventional two-dimensional (2D) ultrasound (i.e., they are limited to a single scanning plane)4–14. By limiting the measurement to a single plane, it may be difficult to accurately gauge a volumetric parameter such as blood perfusion. Using a 3D ultrasound transducer, assessment of volumetric data is possible.
Under sufficient acoustic excitation and correct transmit frequency, UCAs are able to act as nonlinear scatters, producing a wide range of frequency components in the received spectra16. These frequency components range from the subharmonic (f0/2) to higher harmonics (n·f0) of the transmitted frequency (f0). Selectively receiving at a specific harmonic allows for improved contrast detection by substantially reducing linear echoes produced by tissue14, 17–23. One such contrast specific imaging mode that has now been implemented on most commercial ultrasound scanners is the second harmonic or harmonic imaging (HI) mode. However, HI suffers from low contrast to tissue ratio due to second harmonic generation in the surrounding tissue. Generation of the subharmonic frequency component is UCA specific. By receiving at the subharmonic frequency (f0/2) it is possible to achieve near complete tissue suppression24. The feasibility of subharmonic imaging (SHI) has been shown by both our group24–27 and others28–31. In a previous study by our group, a modified Logiq 9 scanner with a 4D10L probe and capability to perform 3D SHI was validated in vitro and in vivo32. In this study, we hypothesized that a combination of 3D imaging and SHI would be able to estimate perfusion (in mL/min/g) in vivo and perform better than 3D HI as well as previously reported 2D perfusion estimates.
Materials and Methods
Animal Preparation
All animal studies were performed in accordance with National Institute of Health guidelines for use of laboratory animals and approved by our institution’s Animal Use and Care Committee. In vivo studies were performed on five canines (mean weight, 21.4±1.1 kg) sedated with an intravenous injection of propofol (Abbot Laboratories, Chicago, IL, USA; dose 7 mL/kg). The canines were placed on a warming blanket to maintain body temperature. A facemask with 4 to 5% isoflurane (Isothesia; Abbot Laboratories, North Chicago, IL) was used for introduction of anesthesia, which was maintained with 0.5 to 2% isoflurane during the entire procedure. A 4F intravascular catheter (for administration of microspheres) was introduced into the left ventricle of the heart through the carotid artery and another 5F intravascular catheter (for collecting the reference blood sample) was inserted into the aorta (above the level of the renal artery) through a femoral artery. The intravascular catheters were positioned under ultrasound guidance. Finally, an 18-gauge angiocatheter (for administration of UCA) was placed in left forelimb peripheral vein. A mid-line abdominal incision was made to provide direct placement of the probe on the kidney.
Ultrasound Imaging Setup
A Logiq 9 US scanner (GE Healthcare, Milwaukee, WI) equipped with a 4D10L probe (Footprint, 50 X 58 mm; bandwidth, 3.5–11.9 MHz; field of view, 37.4 mm) was modified to perform 3D HI (ftransmit = 5 MHz and freceive = 10 MHz; two cycle transmit pulses) and 3D SHI (ftransmit = 5.8 MHz and freceive = 2.9 MHz; four cycle transmit pulses) based on results from a prior study32. Pulse inversion was implemented for both imaging modes to suppress linear signal components from the received signals. The acoustic output of the system was previously measured for these configurations and found to have a peak mechanical index of 0.33 and 0.36 at the focus for HI and SHI (at maximum transmit settings) respectively32.
In Vivo Harmonic and Subharmonic Imaging
In vivo imaging was performed in the lower pole of each kidney. A sterile transducer cover (Civco Medical Instruments, Kalona, IA) was used to cover the ultrasound probe while imaging. Initially, a baseline image was acquired in conventional B-mode to determine position and orientation of transducer. An acoustic output of 12% and gain of 20 dB were selected as optimum settings based on earlier qualitative observations of trial injections in both HI and SHI modes. These settings allowed minimization of tissue signals without suppressing contrast agent visualization. All system settings were maintained constant for both HI and SHI to allow direct comparison of their performance. In order to acquire 3D US scan volumes, a region-of-interest (ROI) was selected in B-mode. The size and position of the ROI was the same for HI and SHI. The size and volume angle of the ROI determined the volume acquisition rate (VR; 1.6–3.0 Hz). After the ROI was selected, 3D HI and SHI were performed.
The canines received a weight-based bolus injection of Definity (Lantheus Medical Imaging, North Billerica, MA) followed by a 5 mL saline flush through the 18-gauge catheter placed in the forelimb peripheral vein. Bolus injection dosage of 5 μL/kg and 20 μL/kg were used for HI and SHI respectively. These ultrasound contrast agent concentrations have been identified as optimal based on our previous experiences with each of the imaging modes26, 32, 33. Wilson et al34 also used similar concentrations for their study comparing diagnosis of focal liver masses between contrast enhanced and unenhanced ultrasound. The differences in ultrasound contrast agent concentrations used for each imaging mode are attributed to the ability of HI to more easily detect ultrasound contrast agent within the microvasculature due to higher resolution at increased frequencies and weaker signals associated with subharmonic emissions. Image acquisition was started prior to injection of contrast agent and recorded until UCA washout. Harmonic imaging and SHI were performed in triplicate for each kidney with an interval of 15 minutes or more between injections to avoid any cumulative effect of the UCA and allow for a return to baseline conditions. After the first set of 12 injections (3 per imaging mode per kidney), a microvascular staining technique35, 36 based on stable (nonradioactive), isotope labeled microspheres (Biophysics Assay Laboratory [BioPAL] Inc, Worcester, MA) was used as a reference standard to quantify the degree of perfusion. The microspheres are 15 μm in diameter and are suspended in normal saline containing Tween 80 and 0.01% Thimerosal. For this study approximately 10 million microspheres (gold was used for pre-ligation; concentration, 2.5 million spheres/mL) were injected through the 4F catheter in to the left ventricular chamber. Immediately after microspheres injection, a reference blood sample was drawn from the 5F catheter into a 20 mL syringe using an automatic withdrawal pump (Syringe Pump 11 Plus; Harvard Apparatus, Holliston, MA). The withdrawal rate was set to 10 mL/min, and blood was collected for a 1-minute period, resulting in a 10 mL reference blood sample.
Next, ischemic areas of the renal tissue were created by ligating a surgically exposed branch of the renal artery feeding the lower pole of the kidney. These low perfusion areas were imaged for 6 contrast injections (3 HI and 3 SHI). This was followed by an injection of a different isotope-labeled microsphere (either lutetium or samarium) and withdrawal of a 10 mL reference blood sample. This process was repeated for the other kidney. No attempts were made to standardize the ligations, because the intent was to produce a range of different perfusion stages. After completion of the experiments, the dogs were euthanized by an intravenous injection of Beuthanasia (0.25 mg/kg; Schering-Plough Animal Health Corporation, Summit, NJ). After euthanasia, the kidneys were harvested and 1 mL of methylene blue dye was injected through the main renal artery to identify areas of infarction/ischemia (see Fig 1). The kidney was then cut in half, corresponding to the imaging plane, and 4 small sections (approximately 1 × 1 × 1 cm3; anterial-lateral, anterial-medial; posterial-lateral and posterial-medial) of tissue from the lower pole (scanning region) were extracted. All tissue samples were weighed (average tissue sample weight: 0.90 ± 0.20 g) and stored in pre-weighed sample vials. The tissue and blood samples were stored in an oven (Imperial III incubator, Model No 305, Lab-Line Instruments Inc, Melrose Park, Illinois) at 50° C for about 12 hours and then sent to BioPAL’s facilities for activation and analysis. Results of the assay were reported as the microsphere concentration of each tissue sample normalized to the microsphere concentration in the reference blood sample, which provides a measure of absolute perfusion (QP, in mL/min/g) according to
Figure 1.
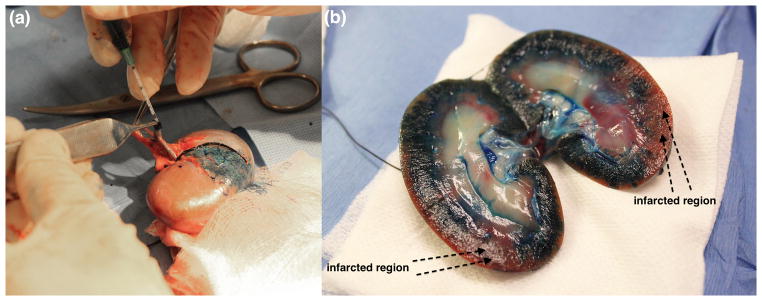
(a) Injection of methylene blue dye via renal artery. (b) Normal and infarcted regions visualized after making a mid-line cut.
| (1) |
where, QR is the reference withdrawal rate (in mL/min)25.
Image Processing and Analysis
The 3D digital clips (stored as DICOM files) obtained from each injection were transferred from the scanner to a desktop computer (Dell Optiplex 960, Dell Inc, Austin, Texas) for offline analysis. Volume information was extracted from the DICOM files into MATLAB (Version 2012a, Mathworks Inc, Natick, MA) using custom-made GE (GE Global Research, Niskayuna, NY) extraction software. Acquired volumes contained about 45–55 image slices/volume over a 19° volume angle. All image processing was performed using the Image Processing Toolbox in MATLAB. To standardize image processing, all HI and SHI volumes were color scaled to the same level.
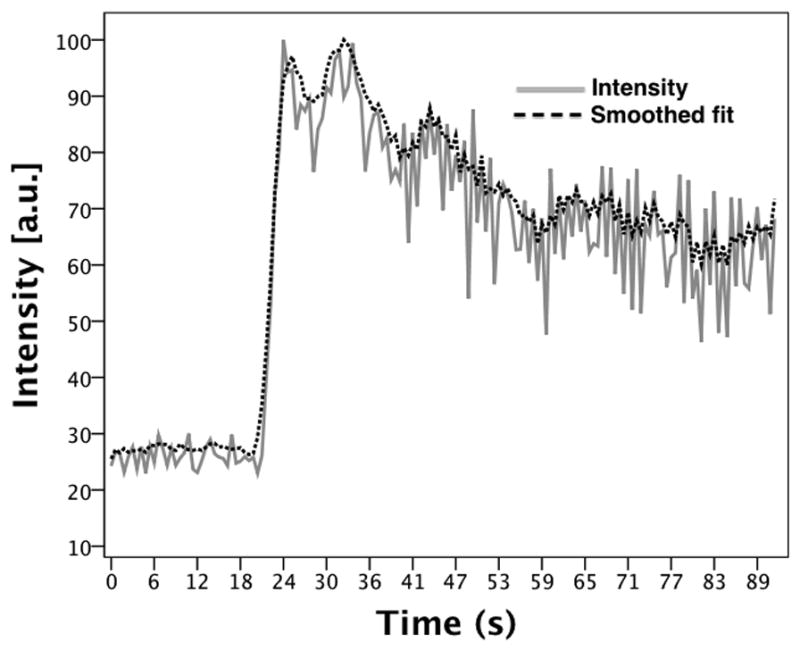
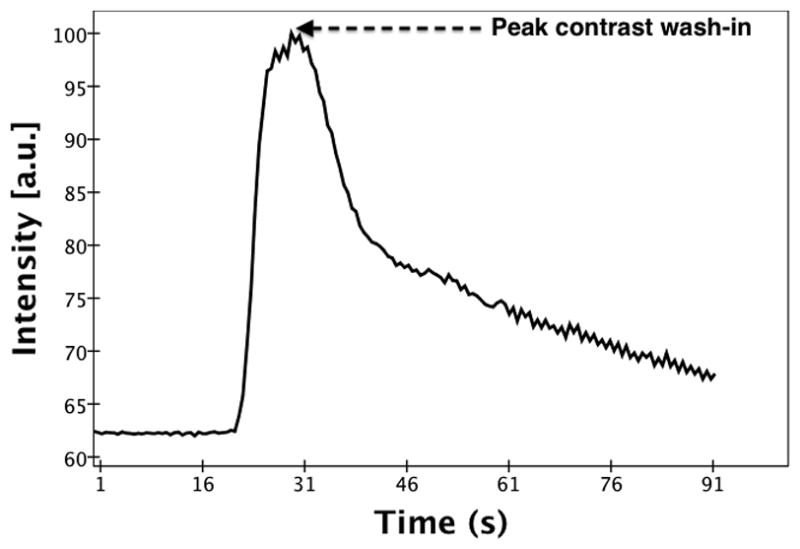
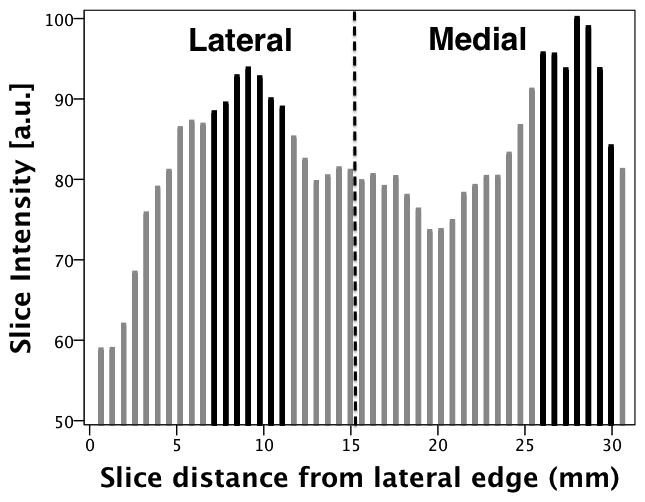
For each injection, the average image intensity per volume (which is the sum of the image intensity across all slices per volume divided by the number of slices in the volume) was calculated across the entire time sequence. These averaged intensities were used to generate a time-intensity curve. Figure 2 shows a time-intensity curve (normalized to the maximum intensity) generated for a single injection pre-ligation. Based on the time-intensity curve, the time point of peak contrast wash-in (Tpk) was determined. The individual slice intensities of the volume corresponding to Tpk were plotted as a distribution across the volume with reference to the midline plane. Figure 3 shows the slice intensity distribution from the lateral to the medial sections of the volume corresponding to Tpk identified in figure 2. To correlate with the lateral and medial tissue samples previously obtained, the peak slice (±3 slices) in both the lateral and medial parts of the slice intensity distribution were selected. The selected slice groups were isolated from the rest of the volume and used for all further image processing. The image intensity of the isolated volumes was averaged across the slices and a cine loop over the entire time sequence was generated. Next, a radiologist was asked to select ROIs (5 × 5 pixels) corresponding to the tissue samples (anterial-lateral, anterial-medial, posterial-lateral and posterial-medial) from the respective (medial or lateral) cine loops. The average ROI image intensity was used to generate a time-intensity curve. A 5th order moving average filter was applied to the time-intensity curve to reduce noise induced by changes in speckle pattern arising from slight variations in the scan plane with respiratory and cardiac motion (see Figure 4). Baseline intensity was determined by averaging the first ten time-points on the curve.
Figure 2.
Subharmonic time-intensity curve generated from the averaged image intensities for a single injection (pre-ligation). The point of peak contrast wash-in is labeled.
Figure 3.
Slice (image intensity) distribution across the volume (from lateral to medial sections). The dashed line is a representation of the mid-line plane. The slices highlighted in black were isolated from the entire volume for further image processing (as lateral and medial volumes).
Figure 4.
Subharmonic time-intensity curve generated from an ROI selected in the lateral anterior section before and after smoothing (solid and dashed line respectively).
Assuming that the total harmonic or subharmonic backscattering cross section is the sum of the subharmonic cross sections of all individual bubbles in the volume of interest at low bubble concentrations37, a quantifiable parameter termed the fractional blood volume (FBV) similar to the definition of the fractional moving blood volume38–40 can be defined. The FBV in an ROI can be estimated as the contrast signal intensities from the blood normalized by the intensity of 100% blood (i.e., a normal blood vessel) obtained at the same depth and with overlying tissues38, 39. Perfusion was estimated from the initial slope of the FBV uptake (rFBV) as
| (2) |
where the initial slope was defined as the slope from 10% to 30% above baseline (scaling relative to the difference between baseline and peak enhancement). Perfusion estimation from the initial slope of the time-intensity curve was used based on experience from a previous 2D perfusion study25. The perfusion estimates were averaged over 3 injections to obtain the final result. The variability of the measurements was assessed as the standard deviation divided by the mean.
In order to compare the performance of the 3D ultrasound modes to 2D, the midline plane of each volume was isolated to generate a quasi-2D image sequence for each injection. The ROIs previously selected for the 3D volumes were applied to the 2D image sequence. However, since it is not possible to differentiate between medial and lateral sections (unless scanned separately) in 2D, individual anterior and posterior ROI were selected and compared to the average of the medial and lateral perfusion values obtained from the tissue samples for their respective anterior and posterior regions.
Statistical Analysis
The 3D HI and SHI perfusion estimates were compared to the microsphere perfusion results and to each other using linear regression. The Pearson’s correlation coefficients along with the RMSE were calculated for the entire data set for both HI and SHI. Perfusion data were further analyzed in subsets of location (anterior and posterior) and perfusion state (pre and post ligation). All four combinations of location and state were also compared to the reference standard. A two-way analysis of variance using the mixed effects model was used to evaluate the effect of biological variability (dog, location within the kidneys and perfusion state) on the perfusion estimates. All statistical analyses were performed using SPSS 20 (IBM Corporation, Armonk, New York) with P<0.05 considered as statistically significant.
Results
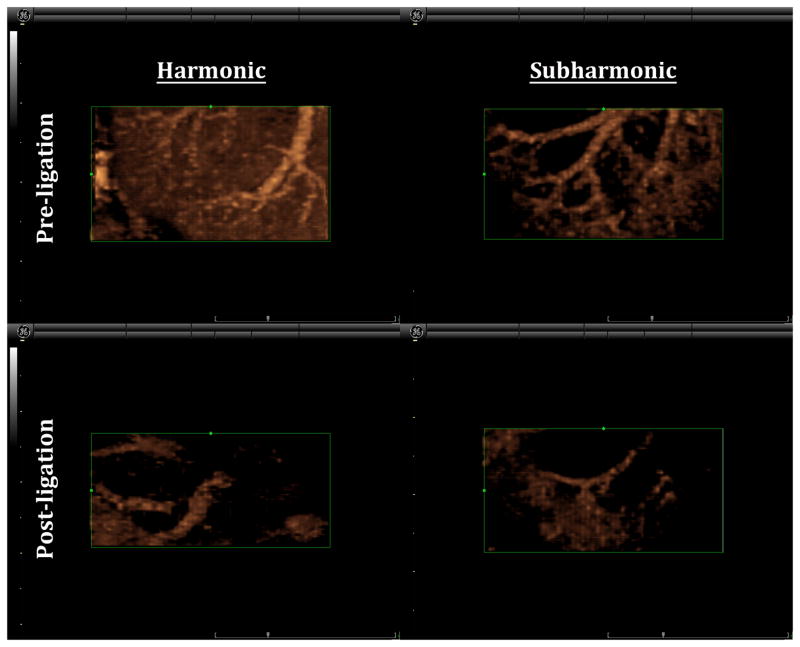
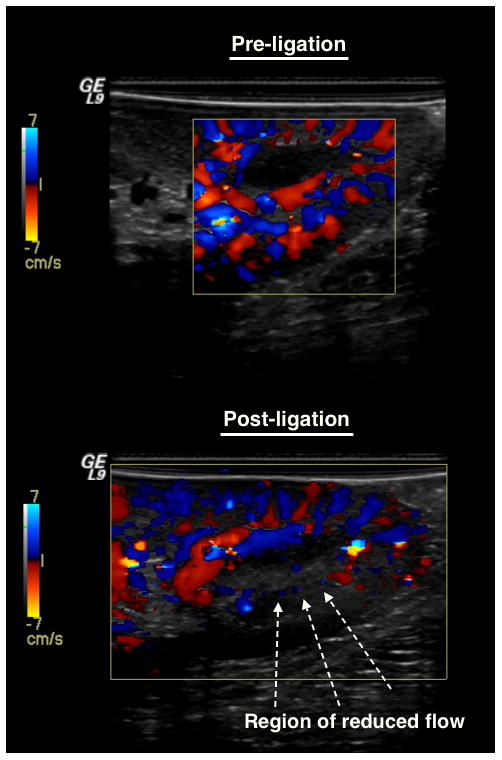
Both 3D HI and 3D SHI were able to provide excellent visualization of vascularity within the lower pole of the kidney after administration of UCA. However, it was evident that the ability to delineate the vessel from surrounding tissue was better in 3D SHI due to almost complete tissue suppression. The 3D renderings were able to show vascularity in fine detail and the ability to freely rotate on any of the three-axes of imaging allowed for visualization of vasculature, which would otherwise not be appreciated in 2D (as shown in Figure 5). In Figure 5 there is noticeable reduction in contrast enhancement post-ligation. A Doppler overlay of the scanning region confirms the reduction of blood flow and hence reduction in contrast perfusion (Figure 6).
Figure 5.
Comparison of 3D HI and SHI pre and post ligation (same canine and same kidney). Clear suppression of tissue is seen in the 3D SHI rendering as compared to HI. Reduced flow is visualized (post-ligation) in both the modes.
Figure 6.
Color Doppler visualization of blood flow before and after ligation
A total of 108 UCA injections were administered throughout the study (in one canine scanning was performed only on a single kidney). The data from one canine was discarded due to a problem with the reference blood sample acquired for microvascular staining. The remaining data yielded 336 time-intensity curves (for 3D HI and SHI) based on ROIs selected in the anterior, posterior, medial and lateral regions of the kidney. After averaging, a total of 56 perfusion estimates were available for each mode i.e., HI and SHI. However, 4 perfusion estimates were removed from HI due lack of information owing to shadowing artifacts in the posterior region of the kidney and 2 perfusion results from the microvascular staining technique yielded no value. In order to allow for direct comparison of performance, all 6 data points were removed from the correlations. The variability of the perfusion estimates was on average 0.456 (range of 0.364 – 0.657) for 3D HI and 0.488 (range of 0.306 – 0.681) for 3D SHI.
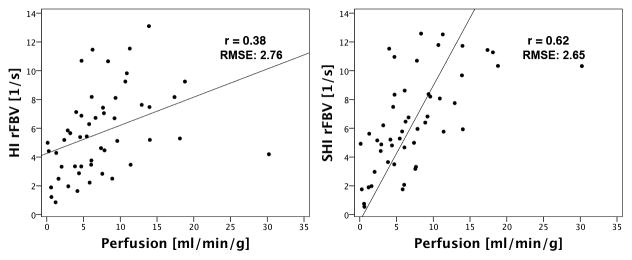
Overall (i.e., pre and post-ligation for anterior and posterior), both 3D HI (r=0.38; P=0.007) and 3D SHI (r=0.62; P<0.001) showed significant correlation with the microsphere reference standard and with each other (r=0.73; P<0.001). However, when analyzed in subsets of perfusion state and location, 3D SHI had better correlation with the reference standard compared to 3D HI in all cases except one (post-ligation posterior) as shown in Table 1. Harmonic imaging did not show significant correlation with the reference standard in the subsets of pre-ligation, pre-ligation anterior, pre-ligation posterior and post-ligation posterior data. Subharmonic imaging also showed no significant correlation in the subsets of post-ligation posterior and pre-ligation anterior, but correlated significantly in the remaining subsets. When present in sufficient concentrations shadowing artifacts from overlying contrast agent usually impacts posterior regions of scanning. It is therefore not surprising that ligation induced low perfusion states combined with the posterior scanning plane produced greater variability in the results. However, it is surprising that the pre-ligation anterior subset does not show significant correlation in both the 3D SHI and 3D HI perfusion estimates. The best 3D SHI perfusion estimates occurred in the subsets of posterior and pre-ligation posterior (r=0.79; P<0.001). The overall perfusion data set and the best linear fit of data for 3D HI (regression line: QP = 0.20 rFBV + 4.25) and 3D SHI (regression line: QP = 0.36 rFBV + 3.82) and their corresponding RMSE are shown in Figure 7. Analysis of variance was performed only on the overall perfusion data set. Results showed that there was no significant effect of canine (HI: P=0.60 and SHI: P=0.94), and that there were no significant interactions between location and perfusion state (HI: P=0.19 and SHI: P=0.11). Significant interaction was observed between location, perfusion state and canine for 3D SHI (P=0.007) but not for 3D HI (P=0.10).
TABLE 1.
Regression Results From the Overall and Regional Subsets of the 3D HI and 3D SHI Perfusion Estimates Correlations With the Reference Standard.
| Subset | HI
|
SHI
|
||
|---|---|---|---|---|
| r | P | r | P | |
| Overall (n = 50) | 0.38 | 0.007 | 0.62 | <0.001 |
| Anterior (n=28) | 0.41 | 0.033 | 0.49 | 0.008 |
| Posterior (n=22) | 0.45 | 0.034 | 0.79 | <0.001 |
| Preligation (n = 27) | 0.21 | 0.285 | 0.66 | <0.001 |
| Postligation (n=23) | 0.63 | 0.001 | 0.70 | <0.001 |
| Preligation anterior (n=14) | 0.27 | 0.344 | 0.44 | 0.12 |
| Preligation posterior (n=13) | 0.24 | 0.437 | 0.79 | <0.001 |
| Postligation anterior (n= 14) | 0.58 | 0.03 | 0.71 | 0.004 |
| Postligation posterior (n=9) | 0.58 | 0.101 | 0.47 | 0.197 |
3D indicates 3-dimensional; HI, harmonic imaging; SHI, subharmonic imaging.
Figure 7.
Overall (a) harmonic (b) subharmonic perfusion estimates versus microsphere perfusion (in mL/min/g)
Overall quasi-2D perfusion estimates did not show any significant correlations (HI: r = −0.05, P=0.824 and SHI: r=0.14, P=0.5) with the microsphere perfusion results. Correlation analysis for the subset of location and perfusion states did not show any significant correlation with the reference standard (see Table 2) except for SHI post-ligation in the posterior location (r=0.90, P=0.04) albeit based on just 5 data points.
TABLE 2.
Regression Results From the Overall and Regional Subsets of the Quasi-2D HI and Quasi-2D SHI Perfusion Estimates Correlations With the Reference Standard.
| Subset | HI
|
SHI
|
||
|---|---|---|---|---|
| r | P | r | P | |
| Overall (n=24) | −0.05 | 0.824 | 0.14 | 0.5 |
| Anterior (n=13) | −0.12 | 0.709 | −0.22 | 0.459 |
| Posterior (n = 11) | −0.15 | 0.616 | 0.61 | 0.035 |
| Preligation (n=13) | −0.02 | 0.951 | 0.01 | 0.963 |
| Postligation(n=11) | −0.15 | 0.633 | 0.22 | 0.484 |
| Preligation anterior (n=7) | −0.24 | 0.603 | −0.22 | 0.634 |
| Preligation posterior (n=6) | 0.02 | 0.965 | −0.24 | 0.602 |
| Postligation anterior (n=6) | 0.26 | 0.617 | 0.31 | 0.498 |
| Postligation posterior (n=5) | −0.82 | 0.023 | 0.90 | 0.042 |
2D indicates 2-dimensional; HI, harmonic imaging; SHI, subharmonic imaging.
Discussion
Perfusion estimates based on the initial slope of the UCA time-intensity curve from volumetric data obtained using HI and SHI have been evaluated in vivo. Overall perfusion estimates showed significant correlation (3D HI: r=0.38; P=0.007 and 3D SHI: r=0.62; P<0.001) with absolute perfusion measurements obtained using the reference standard (isotope labeled microspheres) and with each other (r=0.73; P<0.001). However, 3D SHI resulted in better correlation with reference standard as compared to 3D HI in all subsets of location and perfusion state except for one case (post-ligation posterior). Analysis of perfusion estimates by subsets of location and perfusion state showed the best correlations with the reference standard in post-ligation for 3D HI (r=0.66, P=0.001), posterior and pre-ligation posterior for 3D SHI (r=0.79, P<0.001). This is an improvement over the 2D SHI perfusion estimation study, which only favored high perfusion rates in the anterior of the kidneys (r=0.73) 25.
Quasi-2D estimates were obtained by selecting the midline plane of the volumetric data and these did not exhibit agreement with the reference standard (HI: r = −0.05, P=0.82 and SHI: r=0.14, P=0.50). The 2D data was extracted from a single plane of an entire 3D volume and correlated to an approximation of the perfusion (average of medial and lateral perfusion used for correlation). Ideally, imaging performed using a 2D probe along the medial and lateral sections of the kidney would provide better perfusion estimates to compare with the 3D estimates. A previous study by our group to estimate perfusion in vivo using 2D SHI (in the medial and lateral plane) produced a good overall correlation (r=0.57) with the reference standard (also microsphere based perfusion values) and maximum correlation (r=0.73) in the pre-ligation anterior subset25.
The importance of volumetric imaging for quantitative perfusion measurements was highlighted in a study that compared the errors in 2D perfusion estimates with changes in transducer positioning41. The repeatability of 2D and 3D perfusion estimates was evaluated and showed that 3D imaging was able to produce a standard deviation of less than 3% of the mean as compared to 10% (as high as 22%) for 2D. In a similar study, millimeter-sized deviations in transducer position produced errors between 6.4 to 40.3% among perfusion estimators used for generating quantitative maps of tumor vascularity42.
A study by Paltiel et al43, evaluated the ability to quantify testicular parenchymal perfusion in an in vivo model of unilateral testicular torsion using volumetric contrast-enhanced ultrasound. Their perfusion estimates showed excellent correlation (up to r=0.90) with absolute perfusion rates (microspheres used for reference standard)43. However, for their study a mechanical arm was used to hold the probe in position during contrast agent infusion (as compared to a bolus injection for this study). Furthermore, the entire testis was selected as an ROI (an unfeasible approach in larger organs such as the kidney) for volumetric analysis reducing the error caused by subjective selection of a smaller ROI. Other groups have attempted to quantify blood flow in mL/min rather than in mL/min/g44, 45. To the best of our knowledge, this is the first attempt to enable quantification of absolute perfusion via perfusion estimates determined using contrast-enhanced 3D nonlinear ultrasound imaging.
Although perfusion estimates have shown significant correlations with the reference standard, it is important to acknowledge the limitations of our study. There were problems associated with acoustic shadowing artifacts in the posterior region of the kidney. No motion compensation (other than a basic smoothing filter) was applied to reduce breathing induced motion artifacts. Finally, the tissue samples extracted for determining perfusion were about 1x1x1 cm3 in size, making it difficult to accurately select a corresponding ROI in the volumetric data (which induces subjective error) to produce perfusion estimates. Future studies will involve applying motion compensation, developing methods to automate selection of ROI and possible human studies.
Conclusions
Quantitative perfusion estimation using contrast-enhanced 3D nonlinear ultrasound imaging is shown to be feasible in vivo. Specifically, 3D SHI perfusion estimates exhibit good correlation with the reference standard (r=0.62) as compared to HI (r=0.38). This is an improvement over a previous 2D SHI perfusion estimation study (r=0.57) by our group and highlights the feasibility of 3D SHI and importance of volumetric imaging for making accurate perfusion measurements.
Acknowledgments
Sources of support:
National Institute of Health Grant CA140338, US Army Medical Research Material Command Grant W81XWH-11-1-0639 (JRE)
References
- 1.Goldberg BB, Raichen JS, Flemming F. Ultrasound Contrast Agents: Basic Principles And Clinical Applications. Informa Healthcare. 2001 [Google Scholar]
- 2.Klibanov AL, Rasche PT, Hughes MS, et al. Detection of individual microbubbles of ultrasound contrast agents: imaging of free-floating and targeted bubbles. Invest Radiol. 2004;39:187–195. doi: 10.1097/01.rli.0000115926.96796.75. [DOI] [PubMed] [Google Scholar]
- 3.Sboros V, Tang M. The assessment of microvascular flow and tissue perfusion using ultrasound imaging. Proceedings of the Institution of Mechanical Engineers, Part H: Journal of Engineering in Medicine. 2010;224:273–290. doi: 10.1243/09544119JEIM621. [DOI] [PubMed] [Google Scholar]
- 4.Kogan P, Johnson KA, Feingold S, et al. Validation of Dynamic Contrast-Enhanced Ultrasound in Rodent Kidneys as an Absolute Quantitative Method for Measuring Blood Perfusion. Ultrasound Med Biol. 2011;37:900–908. doi: 10.1016/j.ultrasmedbio.2011.03.011. [DOI] [PMC free article] [PubMed] [Google Scholar]
- 5.Hoeffel C, Mulé S, Huwart L, et al. Renal Blood Flow Quantification in Pigs Using Contrast-Enhanced Ultrasound: An Ex Vivo Study. Ultraschall Med. 2010;31:363–369. doi: 10.1055/s-0029-1245238. [DOI] [PubMed] [Google Scholar]
- 6.Bhayana D, Kim TK, Jang HJ, et al. Hypervascular liver masses on contrast-enhanced ultrasound: the importance of washout. Am J Roentgenol. 2010;194:977–983. doi: 10.2214/AJR.09.3375. [DOI] [PubMed] [Google Scholar]
- 7.Gauthier TP, Wasan HS, Muhammad A, et al. Assessment of global liver blood flow with quantitative dynamic contrast-enhanced ultrasound. J Ultrasound Med. 2011;30:379–385. doi: 10.7863/jum.2011.30.3.379. [DOI] [PubMed] [Google Scholar]
- 8.Goetti R, Reiner CS, Knuth A, et al. Quantitative perfusion analysis of malignant liver tumors: dynamic computed tomography and contrast-enhanced ultrasound. Invest Radiol. 2012;47:18–24. doi: 10.1097/RLI.0b013e318229ff0d. [DOI] [PubMed] [Google Scholar]
- 9.Lassau N, Chami L, Benatsou B, et al. Dynamic contrast-enhanced ultrasonography (DCE-US) with quantification of tumor perfusion: a new diagnostic tool to evaluate the early effects of antiangiogenic treatment. European Radiology Supplements. 2007;17:89–98. doi: 10.1007/s10406-007-0233-6. [DOI] [PubMed] [Google Scholar]
- 10.Lassau N, Chapotot L, Benatsou B, et al. Standardization of Dynamic Contrast-Enhanced Ultrasound for the Evaluation of Antiangiogenic Therapies: The French Multicenter Support for Innovative and Expensive Techniques Study. Invest Radiol. 2012;47:711–716. doi: 10.1097/RLI.0b013e31826dc255. [DOI] [PubMed] [Google Scholar]
- 11.McCarville MB, Streck CJ, Dickson PV, et al. Angiogenesis Inhibitors in a Murine Neuroblastoma Model: Quantitative Assessment of Intratumoral Blood Flow with Contrast-enhanced Gray-Scale US. Radiology. 2006;240:73–81. doi: 10.1148/radiol.2401050709. [DOI] [PubMed] [Google Scholar]
- 12.Meyer-Wiethe K, Cangür H, Schindler A, et al. Ultrasound perfusion imaging: determination of thresholds for the identification of critically disturbed perfusion in acute ischemic stroke--a pilot study. Ultrasound Med Biol. 2007;33:851–856. doi: 10.1016/j.ultrasmedbio.2006.12.006. [DOI] [PubMed] [Google Scholar]
- 13.Rissanen TT, Korpisalo P, Karvinen H, et al. High-resolution ultrasound perfusion imaging of therapeutic angiogenesis. JACC: Cardiovascular Imaging. 2008;1:83–91. doi: 10.1016/j.jcmg.2007.10.009. [DOI] [PubMed] [Google Scholar]
- 14.Schrope BA, Newhouse VL. Second harmonic ultrasonic blood perfusion measurement. Ultrasound Med Biol. 1993;19:567–579. doi: 10.1016/0301-5629(93)90080-8. [DOI] [PubMed] [Google Scholar]
- 15.Wiesmann M, Meyer K, Albers T, et al. Parametric perfusion imaging with contrast-enhanced ultrasound in acute ischemic stroke. Stroke. 2004;35:508–513. doi: 10.1161/01.STR.0000114877.58809.3D. [DOI] [PubMed] [Google Scholar]
- 16.Eller A, Flynn H. Generation of Subharmonics of Order One-Half by Bubbles in a Sound Field. The Journal of the Acoustical Society of America. 1969;46:722. [Google Scholar]
- 17.Schrope B, Newhouse V, Uhlendorf V. Simulated capillary blood flow measurement using a nonlinear ultrasonic contrast agent. Ultrason Imaging. 1992;14:134–158. doi: 10.1177/016173469201400204. [DOI] [PubMed] [Google Scholar]
- 18.De Jong N, Cornet R, Lancee C. Higher harmonics of vibrating gas-filled microspheres. Part one: simulations. Ultrasonics. 1994;32:447–453. [Google Scholar]
- 19.De Jong N, Cornet R, Lancee C. Higher harmonics of vibrating gas-filled microspheres. Part two: measurements. Ultrasonics. 1994;32:455–459. [Google Scholar]
- 20.Forsberg F, Goldberg BB, Liu JB, et al. On the feasibility of real-time, in vivo harmonic imaging with proteinaceous microspheres. J Ultrasound Med. 1996;15:853–860. doi: 10.7863/jum.1996.15.12.853. [DOI] [PubMed] [Google Scholar]
- 21.Krishnan S, O’Donnell M. Transmit aperture processing for nonlinear contrast agent imaging. Ultrason Imaging. 1996;18:77–105. doi: 10.1177/016173469601800201. [DOI] [PubMed] [Google Scholar]
- 22.Simpson DH, Chin CT, Burns PN. Pulse inversion Doppler: a new method for detecting nonlinear echoes from microbubble contrast agents. Ultrasonics, IEEE Transactions on Ferroelectrics and Frequency Control. 1999;46:372–382. doi: 10.1109/58.753026. [DOI] [PubMed] [Google Scholar]
- 23.Chang PH, Shun K, Wu SJ, et al. Second harmonic imaging and harmonic Doppler measurements with Albunex. Ultrasonics, IEEE Transactions on Ferroelectrics and Frequency Control. 1995;42:1020–1027. [Google Scholar]
- 24.Shi WT, Forsberg F, Hall AL, et al. Subharmonic imaging with microbubble contrast agents: initial results. Ultrason Imaging. 1999;21:79–94. doi: 10.1177/016173469902100201. [DOI] [PubMed] [Google Scholar]
- 25.Forsberg F, Liu JB, Shi WT, et al. In vivo perfusion estimation using subharmonic contrast microbubble signals. J Ultrasound Med. 2006;25:15–21. doi: 10.7863/jum.2006.25.1.15. [DOI] [PubMed] [Google Scholar]
- 26.Forsberg F, Piccoli CW, Merton DA, et al. Breast Lesions: Imaging with Contrast-enhanced Subharmonic US—Initial Experience. Radiology. 2007;244:718–726. doi: 10.1148/radiol.2443061588. [DOI] [PubMed] [Google Scholar]
- 27.Forsberg F, Shi W, Goldberg B. Subharmonic imaging of contrast agents. Ultrasonics. 2000;38:93–98. doi: 10.1016/s0041-624x(99)00148-1. [DOI] [PubMed] [Google Scholar]
- 28.Chomas J, Dayton P, May D, et al. Nondestructive subharmonic imaging. Ultrasonics, IEEE Transactions on Ferroelectrics and Frequency Control. 2002;49:883–892. doi: 10.1109/tuffc.2002.1020158. [DOI] [PubMed] [Google Scholar]
- 29.Goertz DE, Frijlink ME, Tempel D, et al. Subharmonic contrast intravascular ultrasound for vasa vasorum imaging. Ultrasound Med Biol. 2007;33:1859–1872. doi: 10.1016/j.ultrasmedbio.2007.05.023. [DOI] [PubMed] [Google Scholar]
- 30.Needles A, Goertz D, Karshafian R, et al. High-frequency subharmonic pulsed-wave Doppler and color flow imaging of microbubble contrast agents. Ultrasound Med Biol. 2008;34:1139–1151. doi: 10.1016/j.ultrasmedbio.2007.12.011. [DOI] [PubMed] [Google Scholar]
- 31.Faez T, Emmer M, Docter M, et al. Characterizing the subharmonic response of phospholipid-coated microbubbles for carotid imaging. Ultrasound Med Biol. 2011;33:958–970. doi: 10.1016/j.ultrasmedbio.2011.02.017. [DOI] [PubMed] [Google Scholar]
- 32.Eisenbrey JR, Sridharan A, Machado P, et al. Three-Dimensional Subharmonic Ultrasound Imaging In Vitro and In Vivo. Acad Radiol. 2012;19:732–739. doi: 10.1016/j.acra.2012.02.015. [DOI] [PMC free article] [PubMed] [Google Scholar]
- 33.Eisenbrey JR, Dave JK, Merton DA, et al. Parametric imaging using subharmonic signals from ultrasound contrast agents in patients with breast lesions. J Ultrasound Med. 2011;30:85–92. doi: 10.7863/jum.2011.30.1.85. [DOI] [PMC free article] [PubMed] [Google Scholar]
- 34.Wilson SR, Jang HJ, Kim TK, et al. Diagnosis of Focal Liver Masses on Ultrasonography Comparison of Unenhanced and Contrast-Enhanced Scans. J Ultrasound Med. 2007;26:775–787. doi: 10.7863/jum.2007.26.6.775. [DOI] [PubMed] [Google Scholar]
- 35.Reinhardt CP, Dalhberg S, Tries MA, et al. Stable labeled microspheres to measure perfusion: validation of a neutron activation assay technique. American Journal of Physiology-Heart and Circulatory Physiology. 2001;280:H108–H116. doi: 10.1152/ajpheart.2001.280.1.H108. [DOI] [PubMed] [Google Scholar]
- 36.Heydorn K. Neutron activation analysis for clinical trace element research. I and II. CRC Press, Inc; 1984. [Google Scholar]
- 37.Medwin H. Counting bubbles acoustically: a review. Ultrasonics. 1977;15:7–13. [Google Scholar]
- 38.Rubin J, Bude R, Fowlkes J, et al. Normalizing fractional moving blood volume estimates with power Doppler US: defining a stable intravascular point with the cumulative power distribution function. Radiology. 1997;205:757–765. doi: 10.1148/radiology.205.3.9393532. [DOI] [PubMed] [Google Scholar]
- 39.Rubin JM, Adler RS, Fowlkes JB, et al. Fractional moving blood volume: estimation with power Doppler US. Radiology. 1995;197:183–190. doi: 10.1148/radiology.197.1.7568820. [DOI] [PubMed] [Google Scholar]
- 40.Carson P, Li X, Pallister J, et al. Approximate quantification of detected fractional blood volume and perfusion from 3-D color flow and Doppler power signal imaging. IEEE Proceedings, Ultrasonics Symposium. 1993;2:1023–1026. [Google Scholar]
- 41.Feingold S, Gessner R, Guracar IM, et al. Quantitative volumetric perfusion mapping of the microvasculature using contrast ultrasound. Invest Radiol. 2010;45:669–674. doi: 10.1097/RLI.0b013e3181ef0a78. [DOI] [PMC free article] [PubMed] [Google Scholar]
- 42.Hoyt K, Sorace A, Saini R. Quantitative Mapping of Tumor Vascularity Using Volumetric Contrast-Enhanced Ultrasound. Invest Radiol. 2012;47:167–174. doi: 10.1097/RLI.0b013e318234e6bc. [DOI] [PMC free article] [PubMed] [Google Scholar]
- 43.Paltiel H, Padua H, Gargollo P, et al. Contrast-enhanced, real-time volumetric ultrasound imaging of tissue perfusion: preliminary results in a rabbit model of testicular torsion. Phys Med Biol. 2011;56:2183–2197. doi: 10.1088/0031-9155/56/7/018. [DOI] [PMC free article] [PubMed] [Google Scholar]
- 44.Wei K, Jayaweera AR, Firoozan S, et al. Quantification of myocardial blood flow with ultrasound-induced destruction of microbubbles administered as a constant venous infusion. Circulation. 1998;97:473–483. doi: 10.1161/01.cir.97.5.473. [DOI] [PubMed] [Google Scholar]
- 45.French BA, Li Y, Klibanov AL, et al. 3D perfusion mapping in post-infarct mice using myocardial contrast echocardiography. Ultrasound Med Biol. 2006;32:805–815. doi: 10.1016/j.ultrasmedbio.2006.03.002. [DOI] [PubMed] [Google Scholar]


