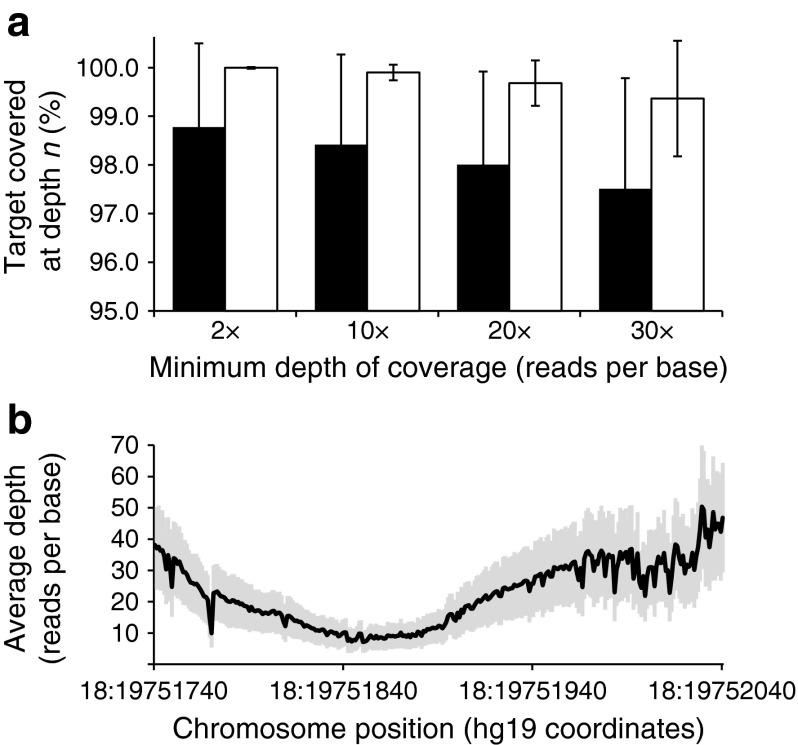
Fig. 1.
Depth of coverage for targeted genes. (a) The percentage of targeted bases sequenced at a minimum depth of 2, 10, 20 and 30 reads per base for regions of interest for all 28 MODY/neonatal diabetes genes and the m.3243 base (black bars) and for the 20 genes routinely tested by Sanger sequencing in our laboratory (white bars). Data are mean values for the cohort of 114 samples; error bars show 1 SD from the mean. (b) Region of low coverage (<30 reads per base) within GATA6 exon 2. The graph shows the average depth of coverage (black line) in the region chr18:19,751,740–19,752,040 (hg19 coordinates); grey shading indicates 1 SD from the mean. Average coverage depth over the entire GATA6 exon 2 region of interest (chr18:19,751,056–19,752,250) was 126

