Abstract
The MgaSpn transcriptional regulator contributes to the virulence of Streptococcus pneumoniae. It is thought to be a member of the Mga/AtxA family of global regulators. MgaSpn was shown to activate in vivo the P1623B promoter, which is divergent from the promoter (Pmga) of its own gene. This activation required a 70-bp region (PB activation region) located between both promoters. In this work, we purified an untagged form of the MgaSpn protein, which formed dimers in solution. By gel retardation and footprinting assays, we analysed the binding of MgaSpn to linear double-stranded DNAs. MgaSpn interacted with the PB activation region when it was placed at internal position on the DNA. However, when it was positioned at one DNA end, MgaSpn recognized preferentially the Pmga promoter placed at internal position. In both cases, and on binding to the primary site, MgaSpn spread along the adjacent DNA regions generating multimeric protein–DNA complexes. When both MgaSpn-binding sites were located at internal positions on longer DNAs, electron microscopy experiments demonstrated that the PB activation region was the preferred target. DNA molecules totally or partially covered by MgaSpn were also visualized. Our results suggest that MgaSpn might recognize particular DNA conformations to achieve DNA-binding specificity.
INTRODUCTION
The Gram-positive (G+) bacterium Streptococcus pneumoniae (the pneumococcus) remains a main cause of morbidity and mortality worldwide. Its natural niche is the nasopharynx of healthy individuals. However, when the immune system weakens, S. pneumoniae can cause serious diseases, such as pneumonia, meningitis and septicemia (1,2). Global transcriptional regulators that respond to specific environmental signals are crucial in bacterial pathogenesis. In S. pneumoniae, several two-component signal transduction systems have been implicated in virulence, although the contribution of some of them differed depending on the strain and/or the infection model used (3). Moreover, signature-tagged mutagenesis in the pneumococcal TIGR4 strain (a serotype 4 clinical isolate) revealed that other putative transcriptional regulators might control the expression of specific virulence genes (4). It was the case of the sp1800 gene product, which was shown to play a significant role in both nasopharyngeal colonization and development of pneumonia in murine infection models. Also, it was shown to act as a repressor of the rlrA pathogenicity islet (5). The mgaSpn gene of the pneumococcal R6 strain, which derives from the D39 clinical isolate (serotype 2), is equivalent to the sp1800 gene of TIGR4. Our previous work identified the promoter of the mgaSpn gene (Pmga) and showed that transcription of the neighbouring spr1623-spr1626 operon is under the control of two promoter sequences, P1623A and P1623B. These promoters are divergent from the Pmga promoter (6). Furthermore, we demonstrated that MgaSpn (493 amino acids) activates the P1623B promoter in vivo. This activation required a 70-bp region (here named PB activation region) located between the P1623B and Pmga divergent promoters. Using a His-tagged MgaSpn protein, we found that such a region includes an MgaSpn-binding site (6).
The MgaSpn regulatory protein is highly conserved in the pneumococcal strains whose genomes have been totally or partially sequenced (6). MgaSpn is thought to be a member of the Mga/AtxA family of global response regulators. It exhibits homology to the Mga (530 residues; 42.6% similarity and 21.4% identity) and AtxA (475 residues; 39.9% similarity and 20.7% identity) regulators of the G+ pathogens S. pyogenes and Bacillus anthracis, respectively. Moreover, although structural data are not available for any of these transcriptional regulators, they appear to have a similar organization of known or predicted functional domains (7,8). In S. pyogenes, the Mga response regulator controls the expression of ∼10% of the genome (9). In vitro studies using a His-tagged Mga protein showed that it binds to regions located upstream of the target promoters (7,10). Such binding sites exhibit low sequence identity, although an initial consensus Mga-binding sequence was proposed (11). More recently, it has been reported that the His-tagged Mga protein is able to form oligomers in solution, and that this ability correlates with transcriptional activation (12). Regarding the B. anthracis AtxA virulence regulator, studies on its interaction with DNA are not available. AtxA is known to control the expression of more than a 100 genes, including the anthrax toxin genes (13). Sequence similarities in the promoter regions of AtxA-regulated genes are not apparent, but in silico and in vitro analyses revealed that the anthrax toxin promoter regions are characterized by intrinsic curvature (14). Moreover, it has been published that AtxA exists in a homo-oligomeric state, and that B. anthracis cultures grown in elevated CO2/bicarbonate show an increase in both AtxA dimerization and AtxA activity (15).
In this work, we purified an untagged form of the MgaSpn regulatory protein. To our knowledge, it is the first example within the Mga/AtxA family of global regulators. Gel filtration chromatography indicated that the untagged MgaSpn protein formed dimers in solution. The interaction of MgaSpn with linear double-stranded DNAs was analysed by gel retardation, footprinting and electron microscopy techniques. On DNAs containing the PB activation region at different positions, MgaSpn recognized preferentially a site, either the PB activation region or the Pmga promoter. On binding to its primary site, multiple MgaSpn units bound orderly along the DNA molecule generating multimeric complexes. Our results suggest that local DNA conformations might contribute to the DNA-binding specificity of MgaSpn.
MATERIALS AND METHODS
Bacterial strains and plasmids
Streptococcus pneumoniae R6 (16) was used to isolate genomic DNA. Pneumococcal growth conditions were reported previously (17). Escherichia coli BL21 (DE3) (a gift of F. W. Studier) was used for the overproduction of MgaSpn. This strain harbours a single copy of the T7 RNA polymerase gene under the control of the inducible lacUV5 promoter (18). The mgaSpn gene was cloned into the E. coli expression vector pET24b (Novagen), generating its derivative pET24b-mgaSpn.
Polymerase chain reaction conditions
The Phusion High-Fidelity DNA polymerase (Finnzymes) and the Phusion HF buffer were used. Reaction mixtures (50 µl) contained 10–30 ng of template DNA, 20 pmol of each primer, 200 μM each deoxynucleoside triphosphate and 1 unit of DNA polymerase. Polymerase chain reaction (PCR) conditions were reported previously (17). PCR products were cleaned up with the QIAquick PCR purification kit (Qiagen).
PCR amplification of DNA regions
Oligonucleotides used for PCR amplification are listed in Table 1. Genomic DNAs from S. pneumoniae and Enterococcus faecalis were prepared as previously described (17). From the pneumococcal R6 genome, several regions were amplified by PCR: (i) a 222-bp DNA region (coordinates 1 598 298–1 598 519) using the 1622H and 1622I primers; (ii) a 224-bp region (coordinates 1 598 229–1 598 452) using the 1622C and 1622D primers; (iii) a 282-bp DNA region (coordinates 1 597 232–1 597 513) using the 1622A and 1622E primers; (iv) a 640-bp DNA region (coordinates 1 598 010–1 598 649) using the 1622B and EM1 primers; (v) a 1418-bp region (coordinates 1 597 232–1 598 649) using the 1622B and 1622A primers; (vi) a 1458-bp DNA region (coordinates 1 598 188–1 599 645) using the 1622F and EM5 primers and (vii) a 322-bp region [non-curved DNA (NC DNA) fragment, coordinates 1 598 010–1 598 331] using the 26A and EM1 primers. Using the pUC19 plasmid DNA (19) as template, a 253-bp region was amplified with the pUC-A and pUC-Rev primers. From the E. faecalis V583 chromosomal DNA, a 321-bp region [curved DNA (C DNA) fragment, coordinates 94 488–94 808] was amplified with the 0091G2 and 0092A2 primers.
Table 1.
Oligonucleotides used in this work
| Name | Sequence (5′ to 3′) |
|---|---|
| 1622A | AGTTCCTGATTGTATTCCCT |
| 1622B | CACAACACTGCCTACCCTCC |
| 1622C | GATTCTGTATTCACGCCCTC |
| 1622D | TTCTAATTGCCTATGACTTTTTTTAG |
| 1622E | TAGATGAAGAAGTTGTTTGCC |
| 1622F | CGATGAAACCAACGTTTATGTTC |
| 1622H | CGGATTAAACCTCTTGCAATTATACC |
| 1622I | CAAATTCTTTAATTGTTGCTATTA |
| EM1 | AGTTGAATGTTTAAAGAAATGATGG |
| EM5 | CAATACAAATATTGTTTTGAAGAAGCC |
| 26A | TTCTTTGTGGTATAATTGCAAGAGGT |
| pUC-A | GGCTGCGCAACTGTTGGGAAGGGC |
| pUC-Rev | TTGTGAGCGGATAACAATTTC |
| 0091G2 | GGCTATTTTGATGCACATATCTG |
| 0092A2 | CCCGCCTTCCTTCCCTTGCTC |
| 1622Nde | GAGAGAAAGATACATATGAGAGATTTA |
| 1622Xho | GGTACAGTTCAAACTCGAGATAGCGT |
Radioactive labelling of DNA fragments
Oligonucleotides were radioactively labelled at the 5′ end using [γ-32P]ATP (PerkinElmer) and T4 polynucleotide kinase (T4 PNK; New England Biolabs). Reactions (25 µl) contained 25 pmol of oligonucleotide, 2.5 µl of 10× kinase buffer (provided by the supplier), 40–50 pmol of [γ-32P]ATP (3000 Ci/mmol; 10 μCi/μl) and 10 units of T4 PNK. After incubation at 37°C for 30 min, additional T4 PNK (10 units) was added (37°C, 30 min). Then, reactions were incubated at 65°C for 20 min. Non-incorporated nucleotide was removed using Illustra MicroSpinTM G-25 columns (GE Healthcare). The 5′-labelled oligonucleotides were used for PCR amplification to obtain double-stranded DNA fragments labelled at either the coding or the non-coding strand.
Overproduction and purification of MgaSpn
A 1540-bp region containing the mgaSpn gene was amplified by PCR using genomic DNA from S. pneumoniae R6 as template and the 1622Nde and 1622Xho primers, which include a single restriction site for NdeI and XhoI, respectively. The amplified DNA was digested with both enzymes, and the 1512-bp digestion product was cloned into the pET24b expression vector (Novagen). E. coli BL21 (DE3) cells harbouring the pET24b-mgaSpn plasmid were grown at 37°C in tryptone-yeast extract medium containing kanamycin (30 μg/ml) to an optical density at 600 nm (OD600) of 0.45. Expression of the mgaSpn gene was induced with 1 mM isopropyl-β-D-thiogalactopyranoside. After 25 min, cells were incubated with rifampicin (200 μg/ml) for 60 min. Cells were harvested by centrifugation, washed twice with buffer VL [50 mM Tris–HCl (pH 7.6), 5% glycerol, 1 mM DTT, 1 mM EDTA] containing 0.4 M NaCl and stored at −80°C. The cell pellet was concentrated (40×) in buffer VL containing 0.4 M NaCl and a protease inhibitor cocktail (Roche). Cells were disrupted by passage through a pre-chilled French pressure cell, and the whole-cell extract was centrifuged to remove cell debris. The clarified extract was mixed with 0.2% polyethyleneimine (PEI), kept on ice for 30 min and centrifuged at 9000 rpm in an Eppendorf F-34-6-38 rotor for 20 min at 4°C. Under these conditions, MgaSpn was recovered in the pellet, which was then washed twice with buffer VL containing 0.4 M NaCl. MgaSpn was eluted with buffer VL containing 0.7 M NaCl. Proteins in the supernatant were precipitated with 70% saturated ammonium sulphate (60 min on ice). After centrifugation (9000 rpm for 20 min at 4°C), the precipitate was dissolved in buffer VL containing 0.4 M NaCl and dialyzed against buffer VL containing 0.1 M NaCl. The protein preparation was loaded onto a heparin affinity column (Bio-Rad) equilibrated with the same buffer. After washing the column with buffer VL containing 0.3 M NaCl, MgaSpn was eluted using a 0.3–0.8 M NaCl gradient. Fractions containing MgaSpn were identified by Coomassie-stained SDS–polyacrylamide (10%) gels, pooled and dialyzed against buffer VL containing 0.1 M NaCl. The protein preparation was concentrated by filtering through a 3-kDa cutoff membrane (Macrosep; Pall). Protein concentration was determined using a NanoDrop ND-1000 Spectrophotometer (Bio-Rad).
Gel filtration chromatography
The MgaSpn sample (1 ml, 25 µM) was injected into a HiLoad Superdex 200 gel-filtration column (120 ml; 16 × 600 mm) using a ÅKTA HPLC system (Amersham Biosciences). Buffer VL containing either 100 or 250 mM NaCl was used to equilibrate the column and as running buffer. All chromatographic runs were performed at 4°C with a flow rate of 0.5 ml/min. The column was calibrated by loading several standard proteins (0.3–5 mg/ml) of known Stokes radius (molecular size): ferritin (61 Å), alcohol dehydrogenase (45 Å), ovalbumin (30.5 Å) and carbonic anhydrase (20.1 Å). Elution positions were monitored at 280 nm. Fractions (2 ml) containing protein were analysed by SDS–polyacrylamide (10%) gel electrophoresis. For each protein, the elution volume (Ve) was measured, and the Kav value was calculated as (Ve-Vo)/(Vt-Vo), where Vo is the void volume (determined by elution of blue dextran), and Vt is the total volume of the packed bed. Data were plotted according to Siegel and Monty (20). The Stokes radius of MgaSpn was determined from the calibration curve once its Kav value was calculated.
Electrophoretic mobility shift assays
Preliminary experiments were done to determine the time required for equilibrium to be reached. In such assays, MgaSpn (25–50 nM) was mixed with the 32P-labelled 222-bp DNA (1 nM) in the absence of competitor DNA. After different incubation times (1–9 min), reaction mixtures were loaded onto running gels (200 V). When the last sample entered the gel, the voltage was reduced to 100 V. Reaction mixtures reached the equilibrium fast (1 min). In general, binding reactions (10–20 µl) contained 30–40 mM Tris–HCl (pH 7.6), 1–1.4 mM DTT, 0.2–0.4 mM EDTA, 1–2% glycerol, 50 mM NaCl, 10 mM MgCl2, 500 µg/ml bovine serum albumin (BSA), 0.1–2 nM of 32P-labelled DNA, 2 µg/ml of non-labelled competitor calf thymus DNA and varying concentrations of MgaSpn. When indicated, non-labelled C DNA (30 nM) or non-labelled NC DNA (30 nM) were used as competitor DNAs. 32P-labelled DNA and competitor DNA were added simultaneously to the reaction. Reactions were incubated at room temperature for 20 min. Free and bound DNA forms were separated by electrophoresis on native polyacrylamide (5%) gels (Mini-PROTEAN system, Bio-Rad) using 1× Tris-borate-EDTA buffer (pH 8.3). Gels were pre-electrophoresed (20 min) and run at 100 V and room temperature. Labelled DNA was visualized by autoradiography and quantified using a Fujifilm Image Analyzer FLA-3000 and the Quantity One software (Bio-Rad).
DNase I footprinting assays
Binding reactions (10–50 µl) contained 30 mM Tris–HCl (pH 7.6), 1% glycerol, 1.2 mM DTT, 0.2 mM EDTA, 50 mM NaCl, 1 mM CaCl2, 10 mM MgCl2, 500 µg/ml BSA, 2–4 nM of 32P-labelled DNA and different concentrations of MgaSpn. After 20 min at room temperature, 0.04 units of DNase I (Roche Applied Science) was added. Reaction mixtures were incubated for 5 min at the same temperature. In reactions of 50 µl, DNase I digestion was stopped by adding 25 µl of Stop DNase I solution (2 M ammonium acetate, 0.8 mM sodium acetate, 0.15 M EDTA). DNA was precipitated with ethanol, dried and dissolved in 5 µl of loading buffer (80% formamide, 1 mM EDTA, 10 mM NaOH, 0.1% bromophenol blue and 0.1% xylene cyanol). In reactions of 10 µl, DNase I digestion was stopped by adding 1 µl of 250 mM EDTA. Then, 4 µl of loading buffer was added. After heating at 95°C for 5 min, samples were loaded onto 8 M urea–6% polyacrylamide gels. Dideoxy-mediated chain termination sequencing reactions were run in the same gel. Labelled products were visualized using a Fujifilm Image Analyzer FLA-3000 or by autoradiography. The intensity of the bands was quantified using the Quantity One software (Bio-Rad).
Hydroxyl radical footprinting assays
To generate the hydroxyl radicals, equal volumes of 6% H2O2, 20 mM sodium ascorbate and a Fe2+-EDTA solution [equal volumes of 4 mM ammonium iron (II) sulphate hexahydrate freshly prepared and 8 mM EDTA] were mixed immediately before being used (‘Three reagents’). Binding reactions (50 µl) contained 30 mM Tris–HCl (pH 7.6), 50 mM NaCl, 10 mM MgCl2, 1.2 mM DTT, 0.2 mM EDTA, 0.02% glycerol, 500 µg/ml BSA, 32P-labelled DNA (4–8 nM) and MgaSpn (320–640 nM). After 20 min at room temperature, 20 ng of calf thymus DNA was added to favour the accumulation of the MgaSpn-DNA C1 complex. Reactions were incubated for 5 min at the same temperature. Hydroxyl radical cleavage was done at room temperature (5 min) by adding 9 µl of the ‘Three reagents’. Reactions were stopped by the addition of 9.5 mM thiourea. Protein–DNA complexes were separated from free DNA by native PAGE (5%) and visualized by autoradiography. Free and bound DNAs were eluted from the gel at 42°C overnight in buffer EB [20 mM Tris–HCl (pH 8), 2 mM EDTA, 200 mM NaCl]. After ethanol precipitation, samples were analysed as indicated (see DNase I footprinting assays). Maxam and Gilbert (G + A) sequencing reactions of the same DNA fragment were run in the same gel.
Electron microscopy
Binding reactions (40–50 µl) contained 30 mM Tris–HCl (pH 7.6), 1 mM DTT, 0.2 mM EDTA, 1% glycerol, 50–100 mM NaCl, 10 mM MgCl2, DNA (0.5–1 nM) and MgaSpn (2–40 nM). Reactions were incubated at room temperature for 20 min. Complexes were adsorbed onto freshly cleaved mica, positively stained with 2% uranyl acetate, rotary shadowed with Pt/Ir and covered with a carbon film as described previously (21). Micrographs of the carbon film replica were taken using a Philips CM100 (FEI Company, Hillsboro, Oregon) electron microscope at 100 kV and a coupled Fastscan CCD camera. The contour lengths of the DNA regions between the protein-binding site and the DNA ends were measured on projections of 35-mm negatives using a digitizer (LM4; Brühl, Nüremberg, Germany).
In silico prediction of intrinsic DNA curvature
The bendability/curvature propensity plots were calculated with the bend.it server (http://hydra.icgeb.trieste.it/dna/bend_it.html) (22). The intrinsic curvature was calculated as degrees per helical turn (10.5°/helical turn = 1°/basepair). The curvature propensity plot was calculated using the consensus scale algorithm (DNase I + nucleosome positioning data) with a windows size of 20 bp.
RESULTS
MgaSpn forms dimers in solution
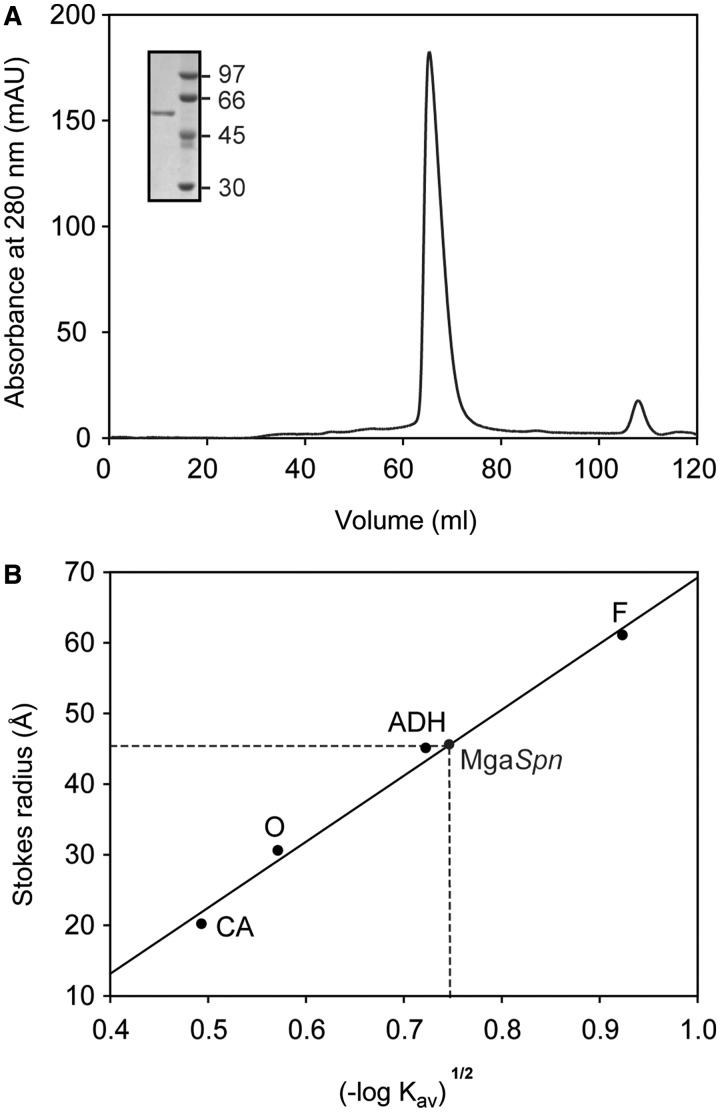
In this work, we purified an untagged form of the MgaSpn regulatory protein (493 amino acids). The procedure involved essentially three steps: (i) precipitation of DNA and MgaSpn with PEI at a low ionic strength; (ii) elution of MgaSpn from the PEI pellet with higher ionic strength; and (iii) chromatography on heparin columns. The yield of pure protein was 4–5 mg per liter of cell culture. Gel electrophoresis analysis under denaturing conditions showed that the protein preparation was >95% pure. MgaSpn migrated between 45 and 66 kDa reference bands (Figure 1A), which agreed with the molecular weight of the MgaSpn monomer calculated from the predicted amino acid sequence (58 723.2 Da). To determine the molecular size (Stokes radius) of the untagged MgaSpn protein, gel filtration chromatography was performed using a running buffer that contained 250 mM of NaCl. The elution profile is shown in Figure 1A. At a loading concentration of 25 µM, most of the MgaSpn protein eluted as a symmetrical peak. The elution volume of MgaSpn was measured and its corresponding Kav value was calculated. A calibration curve was obtained by loading several standard proteins of known Stokes radius (Figure 1B). The Stokes radius of MgaSpn determined from the calibration curve was 46 Å, close to the value of the alcohol dehydrogenase standard protein, whose molecular weight is 150 kDa. The same result was obtained when the running buffer contained 100 mM of NaCl. Thus, under our experimental conditions, the untagged MgaSpn protein appeared to be a dimer.
Figure 1.
MgaSpn exists as a dimer in solution. (A) Elution profile of MgaSpn on a HiLoad Superdex 200 gel-filtration column. Inset shows analysis of the eluted protein by SDS–PAGE (10%). The molecular weight (in kDa) of proteins used as markers (GE Healthcare) is indicated on the right of the gel. (B) Stokes radius of MgaSpn. The column was calibrated by loading several standard proteins of known Stokes radius: ferritin (F), alcohol dehydrogenase (ADH), ovalbumin (O) and carbonic anhydrase (CA).
Formation of multimeric MgaSpn–DNA complexes
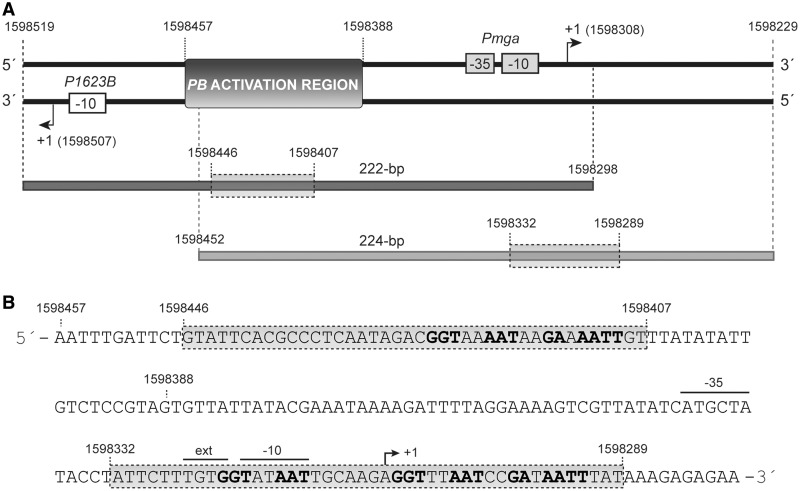
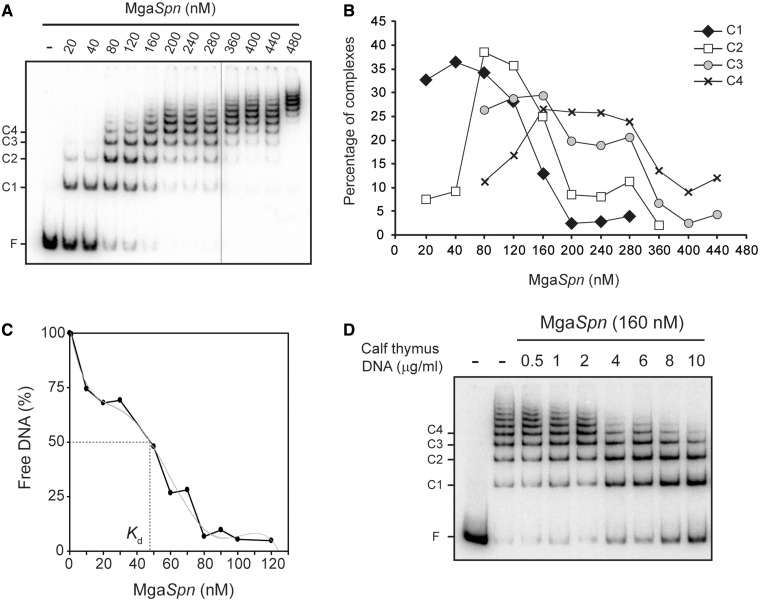
To investigate the DNA-binding properties of the untagged MgaSpn protein, we performed electrophoretic mobility shift assay (EMSA) using different linear double-stranded DNAs. In a first approach, we used a radioactively labelled 222-bp DNA fragment (coordinates 1 598 298–1 598 519 of the R6 genome) (Figure 2A) that contained the P1623B and Pmga divergent promoters, as well as the region shown to be required for MgaSpn-mediated activation of the P1623B promoter (here referred as PB activation region; coordinates 1 598 388–1 598 457) (6). The labelled 222-bp DNA (2 nM) was incubated with increasing concentrations of MgaSpn in the presence of non-labelled competitor calf thymus DNA (2 µg/ml). The electrophoretic mobility of the 222-bp DNA was monitored by autoradiography (Figure 3A). At 20 nM of MgaSpn, free DNA and two protein–DNA complexes (C1 and C2) were visualized. As the protein concentration was increased, higher-order complexes appeared sequentially, whereas complexes moving faster disappeared gradually. Moreover, protein–DNA complexes moving slower than complex C1 were detected before total disappearance of unbound DNA. The pattern of complexes suggested that multiple protein units bound orderly on the same DNA molecule. Quantification of the bands allowed us to estimate the percentage of the C1, C2, C3 and C4 protein–DNA complexes at particular protein concentrations. The percentage of each complex was plotted against MgaSpn concentration (Figure 3B), and the curves suggested a non-cooperative-binding of several MgaSpn units to the DNA molecule. We also examined the effect of NaCl concentration (20–300 mM) on the binding reaction (50 nM MgaSpn, 10 nM non-labelled 222-bp DNA). Under such a range of salt, similar amounts of the C1, C2 and C3 complexes were formed (not shown).
Figure 2.
Relevant features of the 222 and 224-bp DNA fragments. (A) Region spanning coordinates 1 598 229 and 1 598 519 of the pneumococcal R6 genome. This region includes the P1623B and Pmga divergent promoters (6). The transcription start site (+1) for each promoter is indicated with an arrow. The location of the PB activation region is shown. Coordinates of the 222 and 224-bp DNA fragments are indicated. The shadowed box on each DNA fragment denotes the primary MgaSpn-binding site defined by hydroxyl radical footprinting assays in this work. (B) Nucleotide sequence of the region spanning coordinates 1 598 279 and 1 598 457. It includes the two primary binding sites of MgaSpn (shadowed boxes). Both primary sites share two sequence elements: GGT(A/T)(A/T)AAT and GA(A/T)AATT.
Figure 3.
Formation of multimeric MgaSpn-DNA complexes. (A) EMSA of MgaSpn-DNA complexes. The 32P-labelled 222-bp DNA fragment (2 nM) was incubated with increasing concentrations of MgaSpn in the presence of non-labelled competitor calf thymus DNA (2 µg/ml). Reactions were loaded onto a native gel (5% polyacrylamide). All the lanes displayed came from the same gel. Bands corresponding to free DNA (F) and to several MgaSpn–DNA complexes (C1, C2, C3, C4) are indicated. (B) The autoradiograph shown in A was scanned, and the percentage of the indicated complexes was plotted against the concentration of MgaSpn. (C) Affinity of MgaSpn for the 222-bp DNA. The labelled 222-bp DNA (0.1 nM) was incubated with different concentrations of MgaSpn (1–130 nM) in the absence of competitor DNA. Free DNA and bound DNA were separated by native gel electrophoresis. The percentage of free DNA was plotted against MgaSpn concentration. (D) Dissociation of higher-order MgaSpn-DNA complexes. The indicated amount of non-labelled calf thymus DNA was added to pre-formed MgaSpn-DNA complexes (160 nM MgaSpn, 2 nM labelled 222-bp DNA).
By EMSA, we estimated the affinity of MgaSpn for the 222-bp DNA. In this assay, the concentration of 32P-labelled 222-bp DNA was 0.1 nM, and the MgaSpn concentration varied from 1 to 130 nM. The protein concentration required to bind half the DNA was determined by measuring the decrease in free DNA rather than the increase in complexes (Figure 3C), which gives an indication of the approximate magnitude of the dissociation constant, Kd (23). Such a concentration was ∼50 nM. However, this value underestimates the affinity of MgaSpn for its first binding site on the 222-bp DNA, as, on binding to this site, additional protein units bind sequentially to the same DNA molecule.
We also performed dissociation experiments using non-labelled competitor calf thymus DNA (Figure 3D). Essentially, MgaSpn (160 nM) was incubated with the labelled 222-bp DNA (2 nM) for 20 min at room temperature (equilibrium conditions). Then, different amounts of non-labelled competitor DNA were added to the reaction mixtures, which were incubated for 5 min at the same temperature. As the amount of competitor DNA was increased, higher-order complexes disappeared gradually, and complexes moving faster appeared. Therefore, the protein units dissociated sequentially from the higher-order complexes.
Next, we carried out EMSA using other linear double-stranded DNAs: (i) a 253-bp DNA from plasmid pUC19 (19); (ii) a 282-bp DNA from the coding region of the mgaSpn gene (coordinates 1 597 232–1 597 513 of R6); and (iii) a 224-bp DNA (coordinates 1 598 229–1 598 452) containing the PB activation region and the Pmga promoter (Figure 2A). In all the cases, MgaSpn generated a pattern of complexes similar to that shown in Figure 3A. Thus, MgaSpn appeared to bind DNA with high affinity, but with low sequence specificity.
Binding of MgaSpn to the PB activation region
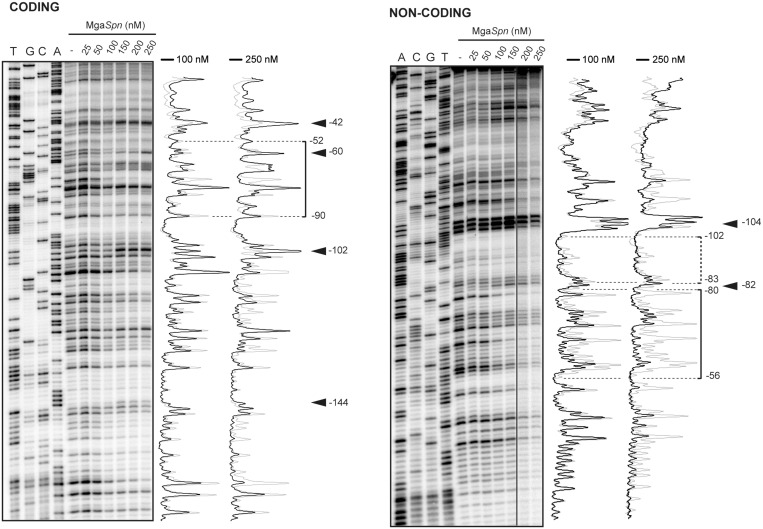
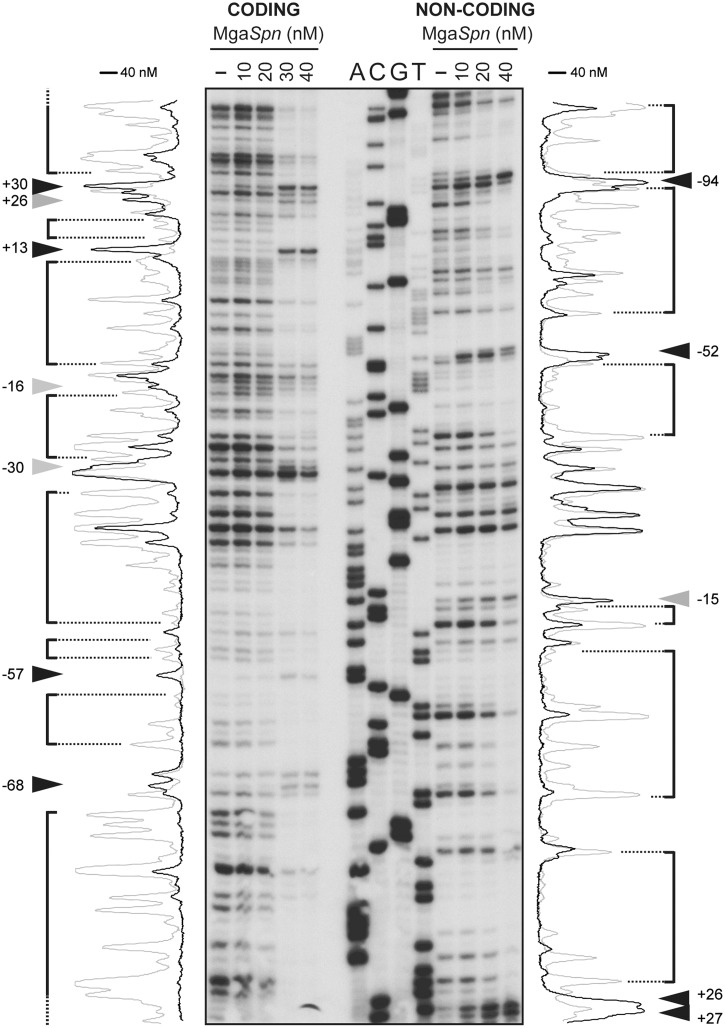
Binding of MgaSpn to the 222-bp DNA fragment (see Figure 2A) was further analysed by DNase I footprinting assays (Figure 4). On such DNA, the PB activation region is located at internal position (at a distance of 62 and 90 bp from each DNA end, respectively) (Figure 2A). The 222-bp DNA was labelled either at the 5′-end of the non-coding strand or at the 5′-end of the coding strand relative to the P1623B promoter. Labelled DNA (4 nM) was incubated with increasing concentrations of MgaSpn (Figure 4). On the non-coding strand and at 100 nM of protein, the region spanning the −56 and −80 positions relative to the transcription start site of the P1623B promoter was protected against DNase I digestion. Diminished cleavages were also observed from −83 to −102. Moreover, the −82 and −104 positions were slightly more sensitive to DNase I cleavage. This result indicated that MgaSpn recognized preferentially a site (primary binding site) on the 222-bp DNA fragment. This primary site was located between the positions −56 and −102 relative to the P1623B transcription start site and, therefore, within the PB activation region (Figure 2A). Similar results were reported previously for a His-tagged MgaSpn protein (6). However, when protein concentration was increased to 250 nM, MgaSpn-mediated protections were observed not only at the primary binding site but also at the adjacent regions. On the coding strand and at 250 nM of MgaSpn, protected regions and hypersensitive sites (−144, −102, −60 and −42) were observed along the DNA fragment. Hence, MgaSpn did not bind randomly to the 222-bp DNA. It was able to bind preferentially to the PB activation region (primary site) and subsequently to spread along the adjacent DNA regions, which was consistent with the pattern of protein–DNA complexes observed by EMSA (Figure 3A).
Figure 4.
DNase I footprints of complexes formed by MgaSpn on the 222-bp DNA fragment. Coding and non-coding strands relative to the P1623B promoter were 32P-labelled at the 5′end. Dideoxy-mediated chain termination sequencing reactions were run in the same gel (lanes A, C, G, T). All the lanes displayed came from the same gel. Densitometer scans corresponding to DNA without protein (grey line) and DNA with the indicated concentration of protein (black line) are shown. In this assay, the concentration of DNA was 4 nM. The regions protected at 100 nM of MgaSpn are indicated with brackets. Arrowheads indicate positions that are slightly more sensitive to DNase I cleavage. The indicated positions are relative to the transcription start site of the P1623B promoter.
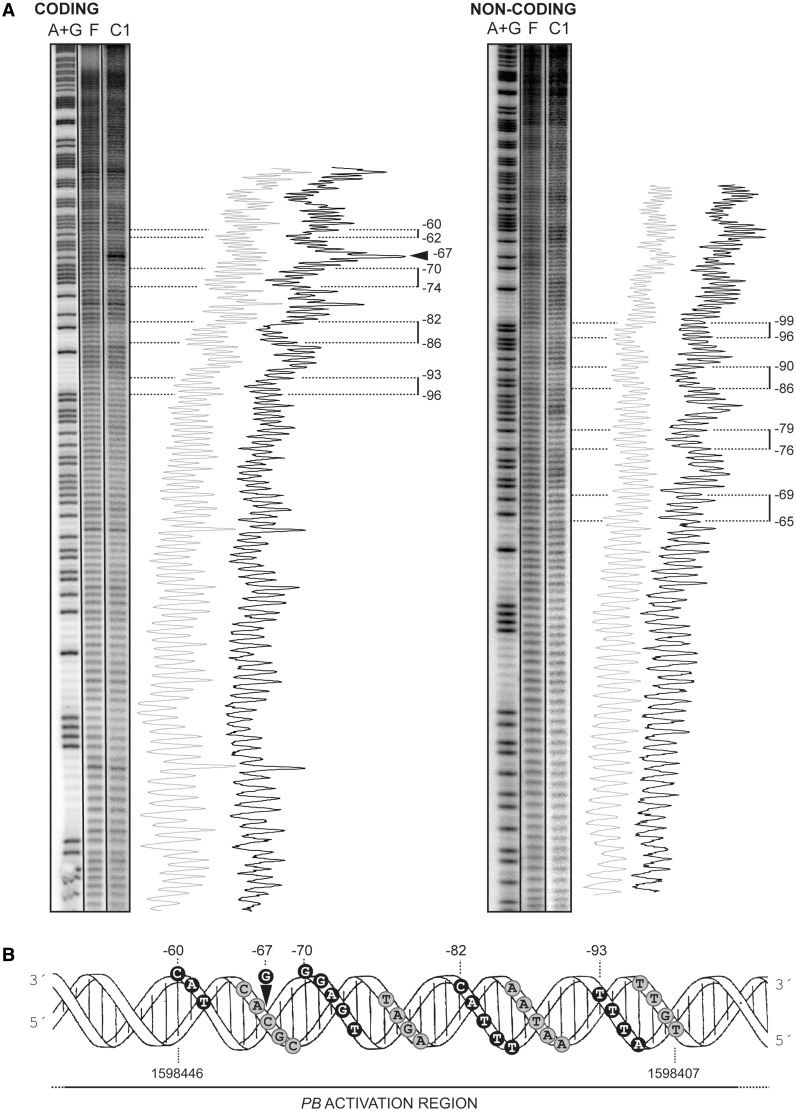
To get information on how MgaSpn bound to the primary site of the 222-bp DNA fragment, we carried out hydroxyl radical footprinting assays. After treatment with the hydroxyl radical cleavage reagent, the MgaSpn–DNA complex C1 was separated from the unbound DNA by electrophoresis on a native polyacrylamide gel (see Figure 3A). DNA from complex C1 and unbound DNA were eluted from the gel and electrophoresed on a sequencing gel (Figure 5A). On the coding strand, regions of decreased cutting were observed between the −60 and −96 positions relative to the transcription start site of the P1623B promoter. In the case of the non-coding strand, the decrease in hydroxyl radical cleavage occurred at regions located between positions −65 and −99. Specifically, MgaSpn protected four regions on each DNA strand. Each protected region covered 3–5 nt, and the individual protected regions were separated by 6–8 nt. Representation of the protected regions on a B-DNA double helix showed that MgaSpn interacted with one face of the DNA double helix (coordinates 1 598 407–1 598 446) (Figure 5B). Moreover, these results confirmed that MgaSpn recognized preferentially the PB activation region on the 222-bp DNA (see Figure 2).
Figure 5.
MgaSpn binds preferentially to the PB activation region on the 222-bp DNA. (A) Hydroxyl radical cleavage pattern of the 222-bp DNA without protein (F) and with MgaSpn bound to its primary site (complex C1). Coding and non-coding strands relative to the P1623B promoter were 32P-labelled at the 5′end. Lanes A + G are products from Maxam-Gilbert adenine- and guanine-specific sequencing reactions performed on the respective labelled strands. All the lanes displayed came from the same gel. Lane C1 corresponds to a longer exposure time. Densitometer scans from lanes F (grey line) and C1 (black line) are shown. Numbers indicate positions relative to the transcription start site of the P1623B promoter. Regions protected by MgaSpn are indicated with brackets. The arrowhead indicates a position (−67) more sensitive to hydroxyl radical cleavage. (B) B-form DNA of the PB activation region showing MgaSpn contacts as deduced from hydroxyl radical. Black and grey circles indicate protein contacts on the coding and non-coding strand, respectively.
Binding of MgaSpn to the Pmga promoter region
We also analysed the interaction of MgaSpn with a 224-bp DNA fragment that carried the PB activation region positioned at one end of the DNA molecule (see Figure 2A). Such a DNA included the Pmga promoter but lacked the P1623B promoter. DNase I footprinting assays performed with the 224-bp DNA (2 nM) are shown in Figure 6. On the coding strand and at 40 nM of MgaSpn, sites more sensitive to DNase I cleavage were observed along the DNA fragment (positions −68, −57, −30, −16, +13, +26 and +30 relative to the transcription start site of the Pmga promoter). These sites were regularly spaced ∼10–13 and 26–27 nt. On the non-coding strand and at 40 nM of MgaSpn, the hypersensitive sites (positions +26, −15, −52 and −94) were spaced 36–41 nt. On both strands, the hypersensitive sites were flanking regions protected against DNase I digestion, and a few unprotected sites were also observed. The pattern of protections and hypersensitive sites ruled out that MgaSpn bound randomly to the 224-bp DNA. Such a pattern indicated a regular positioning of MgaSpn along the DNA molecule, which was consistent with the idea of binding to a preferential site (see below hydroxyl radical cleavage of the C1 complex) and then spreading (ordered positioning) along the adjacent DNA regions.
Figure 6.
DNase I footprints of complexes formed by MgaSpn on the 224-bp DNA fragment. Coding and non-coding strands relative to the Pmga promoter were 32P-labelled at the 5′end. Dideoxy-mediated chain termination sequencing reactions were run in the same gel (A, C, G, T). Densitometer scans corresponding to free DNA (grey line) and bound DNA (40 nM of MgaSpn; black line) are shown. In this assay, the concentration of DNA was 2 nM. Numbers indicate positions relative to the transcription start site of the Pmga promoter. Hypersensitive sites (arrowheads) flanking protected regions (brackets) are indicated.
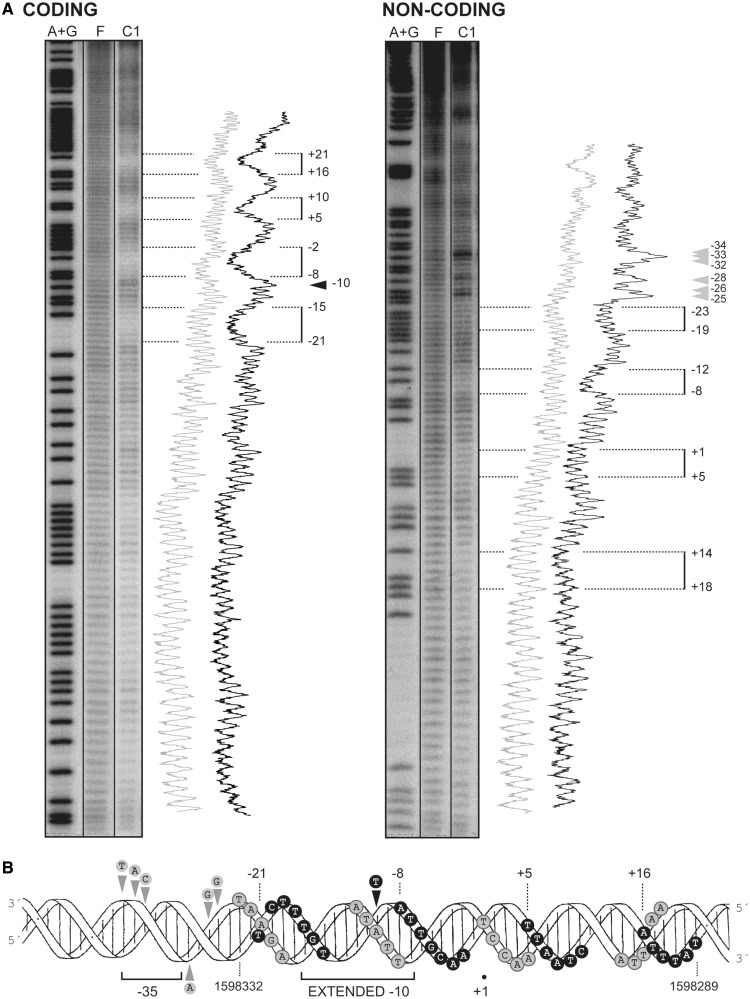
EMSA revealed that MgaSpn interacted with the 224-bp DNA fragment generating a pattern of complexes similar to that shown in Figure 3A. To identify the primary site recognized by MgaSpn on the 224-bp DNA, protein–DNA complexes were formed under conditions that favoured the formation of the C1 complex. After hydroxyl radical cleavage, complex C1 was separated from unbound DNA by native gel electrophoresis. The hydroxyl radical footprint pattern of MgaSpn bound to its primary site is shown in Figure 7A. On the coding strand, MgaSpn protected four regions within the sequence spanning the −21 and +21 positions relative to the Pmga transcription start site. Each protected region covered 6–7 nt, and they were separated by 5–6 nt. On the non-coding strand, MgaSpn protected four regions of 5 nt within the sequence spanning the +18 and −23 positions. The protected regions were separated by 6–8 nt. Several sites more sensitive to hydroxyl radical cleavage were observed between the −25 and −34 positions. Therefore, the primary site recognized by MgaSpn on the 224-bp DNA was the Pmga promoter region (Figure 7B). Specifically, it bound to sequences located between the −23 and +21 positions (coordinates 1 598 332 and 1 598 289) and appeared to induce a conformational change at the −35 hexamer (see also Figure 2). These results demonstrated that MgaSpn did not recognize the PB activation region as primary site when it was positioned at one end of the DNA molecule.
Figure 7.
MgaSpn binds preferentially to the Pmga promoter region on the 224-bp DNA. (A) Hydroxyl radical cleavage pattern of the 224-bp DNA without protein (F) and with MgaSpn bound to its primary site (complex C1). Coding and non-coding strands relative to the Pmga promoter were 32P-labelled at the 5′end. Lanes A + G are products from Maxam-Gilbert adenine- and guanine-specific sequencing reactions performed on the respective labelled strands. All the lanes displayed came from the same gel. Lane C1 corresponds to a longer exposure time. Densitometer scans from lanes F (grey line) and C1 (black line) are shown. Numbers indicate positions relative to the transcription start site of the Pmga promoter. Regions protected by MgaSpn are indicated with brackets. Arrowheads indicate positions more sensitive to hydroxyl radical cleavage. (B) B-form DNA of the Pmga promoter region showing MgaSpn contacts as deduced from hydroxyl radical. Black and grey circles indicate protein contacts on the coding and non-coding strand, respectively.
MgaSpn binds to the PB activation region rather than to the Pmga promoter on long linear DNAs
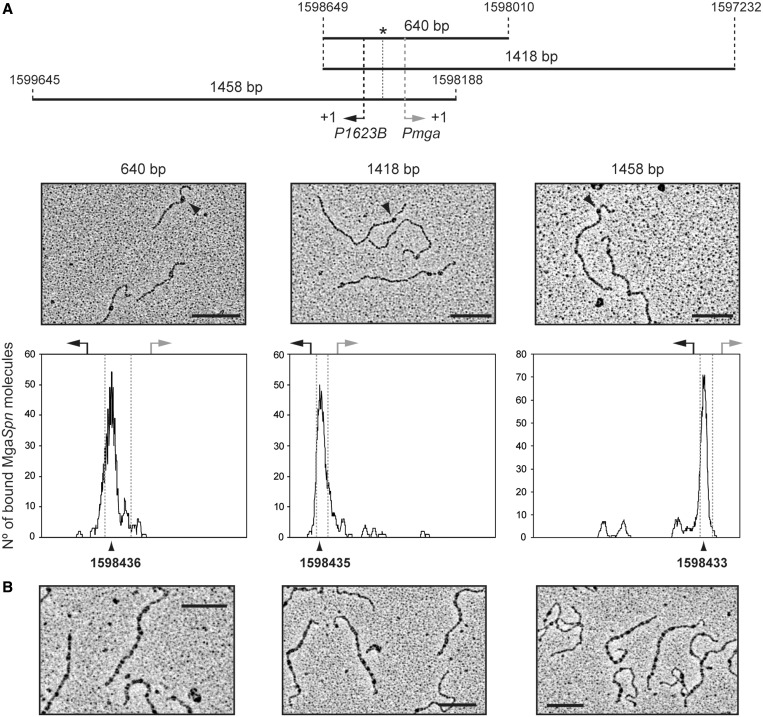
Footprinting assays using the 222 and 224-bp DNAs revealed that the PB activation region had to be located at internal position (222-bp DNA) to be recognized by MgaSpn as primary binding site. When it was positioned at one end of the DNA molecule (224-bp DNA), the primary binding site of MgaSpn was the Pmga promoter region (see Figure 2). Binding of MgaSpn to longer DNA molecules (640, 1418 and 1458 bp) was further analysed by electron microscopy (Figure 8). On such DNAs, the PB activation region and the Pmga promoter were located at internal positions. First, the experiments were performed at low protein/DNA ratios to favour the formation of C1 complexes (an MgaSpn unit bound to the DNA molecule). Electron micrographs of such complexes are shown in Figure 8A. To determine the MgaSpn-binding site, the contour lengths of the DNA regions between complexes and DNA ends were measured, and the position of the MgaSpn protein was determined. Figure 8A shows the distribution of the MgaSpn positions on each DNA fragment. On the 640-bp DNA (coordinates 1 598 010–1 598 649), of 171 complexes examined, the majority (80%) showed a protein unit bound to sequences located at a maximum distance of 213 bp from one DNA end. Thus, MgaSpn bound preferentially either around coordinate 1 598 223 (MgaSpn coding region) or ∼1 598 436 (PB activation region). On the 1418-bp DNA (coordinates 1 597 232–1 598 649), 62% of 156 complexes examined showed MgaSpn binding in a peak ∼214 bp from one DNA end. This result positioned MgaSpn around coordinate 1 597 446 (MgaSpn coding region) or 1 598 435 (PB activation region). On the 1458-bp DNA (coordinates 1 598 188–1 599 645), 63% of 182 complexes showed MgaSpn binding in a peak ∼245 bp from one DNA end. Therefore, MgaSpn bound either around coordinate 1 598 433 (PB activation region) or 1 599 400 (downstream of the P1623B promoter). Collectively taken, the aforementioned results demonstrated that MgaSpn bound to the PB activation region rather than to the Pmga promoter when both sites were located at internal positions on the same DNA molecule. Electron microscopy experiments at high protein/DNA ratios were also carried out. Under such conditions, DNA molecules totally or partially covered by MgaSpn were visualized (Figure 8B). Measurement of the DNA molecules, either naked or covered with protein, showed that their length did not vary on protein binding. Hence, the electron microscopy results supported that MgaSpn was able to bind preferentially to a particular site and then to spread along the DNA.
Figure 8.
Electron microscopy analysis of MgaSpn-DNA complexes. (A) MgaSpn was incubated with different DNA fragments (640, 1418 and 1458 bp) at low protein/DNA ratios to favour the formation of C1 complexes (MgaSpn bound to its primary site). The position of the PB activation region is indicated with an asterisk. Electron micrographs of the protein–DNA complexes are shown, and representative MgaSpn–DNA complexes are indicated with a black arrow. The distribution of the MgaSpn positions on the three DNA fragments is shown. Position of the transcription start site of the P1623B (black arrow) and Pmga (grey arrow) promoters is indicated. (B) MgaSpn was incubated with the 1418-bp DNA fragment at high protein/DNA ratios. Electron micrographs of DNA molecules covered by MgaSpn are shown. Scale bar, 500 bp.
Local DNA conformations might contribute to the DNA-binding specificity of MgaSpn
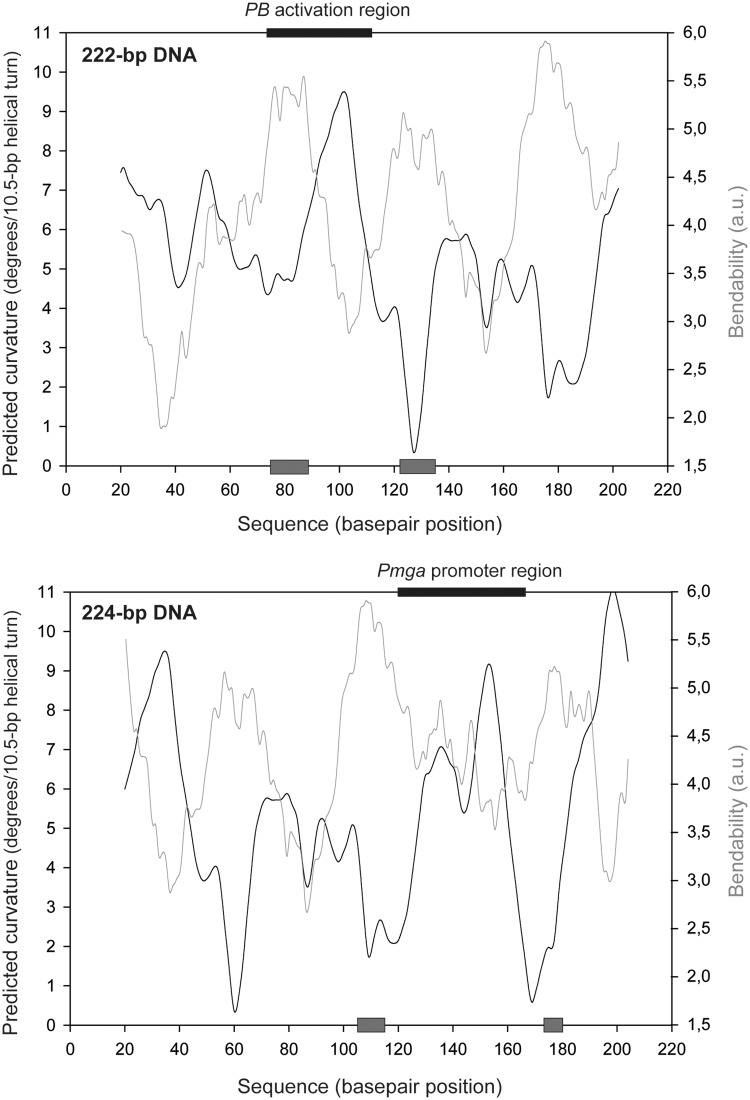
The two sites recognized preferentially by MgaSpn (PB activation region and Pmga promoter) share a low sequence identity: the GGT(A/T)(A/T)AAT and GA(A/T)AATT sequence elements shown in Figure 2B. Curiously, despite this identity, when both sites were located at internal positions on long linear DNA molecules, MgaSpn bound preferentially to the PB activation region rather than to the Pmga promoter (Figure 8). Furthermore, when the PB activation region was placed at one DNA end, MgaSpn recognized preferentially the Pmga promoter (Figure 7). To further examine the features of the two primary binding sites of MgaSpn, we calculated the bendability/curvature propensity plots of the 222 and 224-bp DNA fragments using the bend.it program (22). In the case of the 222-bp DNA (Figures 2 and 9), the profile contains one peak of potential curvature at position 102, which is within the PB activation region (positions 73–112). The magnitude of curvature propensity (9.5) is within the range calculated for experimentally tested curved motifs (24). Moreover, two regions of conspicuous bendability (positions 74–88 and 122–134) are flanking such a peak of potential curvature. Regarding the 224-bp DNA fragment (Figures 2 and 9), the Pmga promoter region (positions 120–163) contains one peak of potential curvature (position 153; magnitude 9.1), which is also flanked by regions of bendability (positions 105–114 and 174–180). Thus, the two sites recognized preferentially by MgaSpn contain a potential intrinsic curvature.
Figure 9.
Bendability/curvature propensity plots of the 222 and 224-bp DNA fragments according to the bend.it program (22). The primary binding sites of MgaSpn are indicated (black boxes). Grey boxes indicate regions of bendability.
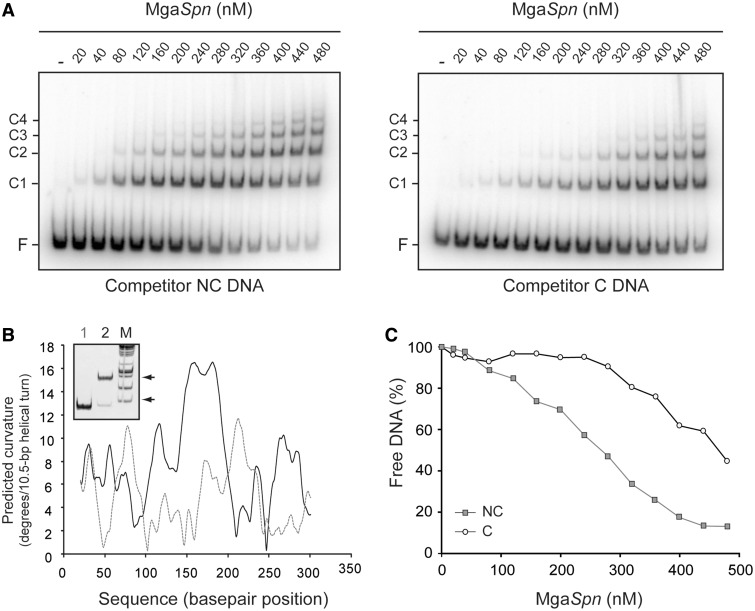
Next, we examined the binding of MgaSpn to the C DNA and NC DNA fragments. The C DNA fragment (321 bp; 72.3% of A + T content) was from the E. faecalis V583 genome, whereas the NC DNA fragment (322 bp; 71.1% of A + T content) was from the S. pneumoniae R6 genome. The latter fragment carried the sequence spanning the −22 and +299 positions relative to the Pmga transcription start site. According to predictions of intrinsic DNA curvature using the bend.it server (22), the C DNA fragment contains two peaks of potential curvatures within the region spanning the positions 150 and 200. The magnitude (>12) of such inherent, sequence-dependent curvatures is higher than the magnitude of the curvatures predicted in the NC DNA fragment (Figure 10B). In addition, unlike the NC DNA fragment, the C DNA fragment showed an anomalously slow electrophoretic mobility on native polyacrylamide gels (Figure 10B, lane 2), which is a characteristic of curved DNA fragments (25). By EMSA, we estimated the affinity of MgaSpn for both DNAs. Binding reactions contained 0.1 nM of 32P-labelled DNA and various concentrations of MgaSpn (1–130 nM). On both DNAs, MgaSpn generated multiple protein–DNA complexes (not shown). Therefore, the half-maximal binding point was determined by measuring the decrease in free DNA. The apparent Kd was ∼12 nM for the C DNA and ∼95 nM for the NC DNA, indicating that MgaSpn had a higher affinity for the naturally occurring curved DNA. These data were in agreement with the results of the competitive gel retardation assays shown in Figure 10A. The 32P-labelled 222-bp DNA fragment (Figure 2A) was incubated with increasing concentrations of MgaSpn in the presence of non-labelled competitor DNA, either NC DNA or C DNA. As shown in Figure 10C, at any protein concentration, the percentage of 222-bp DNA that remained unbound was higher using the curved DNA as competitor. In conjunction, the aforementioned results suggested that MgaSpn might recognize particular conformations of its target DNAs.
Figure 10.
Binding of MgaSpn to a naturally occurring curved DNA. (A) Competitive EMSA. The 32P-labelled 222-bp DNA fragment (2 nM) was incubated with the indicated concentration of MgaSpn in the presence of non-labelled competitor DNA (30 nM), either NC DNA (left) or C DNA (right). Bands corresponding to free DNA (F) and to several MgaSpn–DNA complexes (C1, C2, C3, C4) are indicated. (B) Curvature-propensity plot of the NC DNA (grey line) and C DNA (black line). Inset shows the electrophoretic mobility of the NC DNA (lane 1) and C DNA (lane 2) on a native polyacrylamide (5%) gel. Lane M, DNA fragments used as molecular weight markers (HyperLadder I, Bioline). Arrows indicate the position of the 400 and 800-bp fragments. (C) The autoradiographs shown in A were scanned, and the percentage of free DNA was plotted against the concentration of MgaSpn. NC DNA (grey squares) and C DNA (white circles) were used as competitors.
Minimum DNA size required for MgaSpn binding
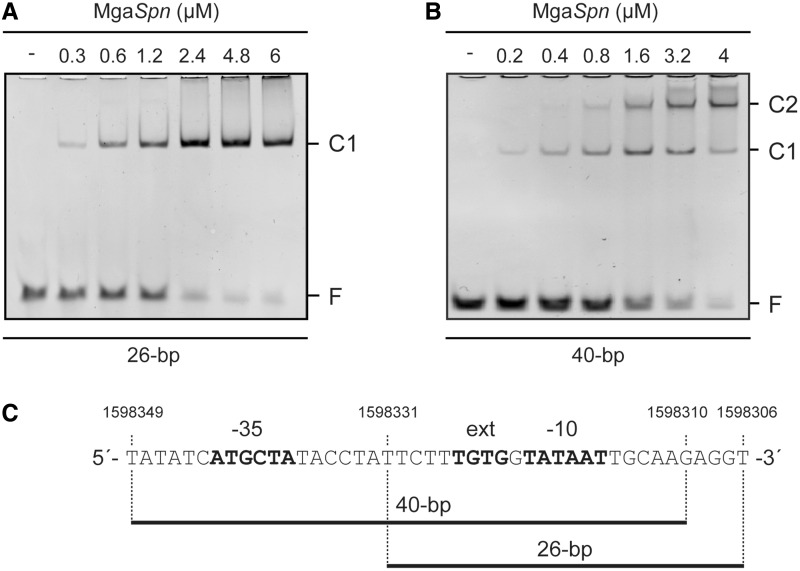
By EMSA, we analysed the binding of MgaSpn to DNA fragments of 40 and 26 bp. The 40-bp fragment contained the −35 and −10 hexamers of the Pmga promoter, whereas the 26-bp fragment contained only the −10 hexamer (Figure 11). The non-labelled DNA fragments were incubated with increasing concentrations of MgaSpn. Two complexes were detected with the 40-bp DNA but only one complex with the 26-bp DNA. Similar results were obtained with DNA fragments that had the same size but different sequence (not shown). Moreover, no complexes were formed when a 20-bp DNA fragment was used. Therefore, we conclude that the minimum DNA size required for MgaSpn binding is between 26 and 20 bp.
Figure 11.
Binding of MgaSpn to non-labelled DNA fragments of 26 bp (A) and 40 bp (B). The indicated concentration of MgaSpn was mixed with 300 nM of the 26-bp DNA or with 200 nM of the 40-bp DNA. Binding reactions were analysed by native gel electrophoresis. Bands corresponding to free DNA (F) and to protein–DNA complexes (C1 and C2) are indicated. (C) The nucleotide sequence of the oligonucleotides used to generate the 26 and 40-bp DNA fragments is indicated. The main elements of the Pmga promoter are shown in bold. Equimolecular amounts of complementary oligonucleotides were annealed in buffer containing 2 mM Tris–HCl (pH 8), 0.2 mM EDTA and 50 mM NaCl. Reaction mixtures (150 µl) were incubated at 95°C for 10 min and then cooled down slowly to 37°C. Reactions were kept at 37°C for 10 min and then on ice for 10 min.
Hydroxyl radical cleavage of the MgaSpn-DNA complex C1 showed that MgaSpn protected 40 bp on the 222-bp DNA fragment (Figure 5). Similar results were obtained with the 224-bp DNA (a 44-bp primary site was defined; Figure 7). As binding of MgaSpn to a 40-bp DNA fragment generates two protein–DNA complexes and the minimum DNA size required for MgaSpn binding is between 26 and 20 bp, we propose that two MgaSpn units bound to the 222-bp DNA could constitute the C1 complex. Sequential binding of additional MgaSpn units to complex C1 could explain the formation of the additional complexes (C2–C10) detected by gel retardation assays (Figure 3A).
DISCUSSION
Signature-tagged mutagenesis in the pneumococcal TIGR4 strain led to the identification of several genes associated with virulence (4). One of them was the sp1800 gene, which is equivalent to the mgaSpn gene of the pneumococcal R6 strain (6). The MgaSpn protein is thought to be a member of the Mga/AtxA family of global response regulators (7,8). According to the SABLE server for sequence-based prediction of secondary structures (26), the MgaSpn regulatory protein has a high content of α-helices (60.7%). Furthermore, the Pfam database (27) revealed that MgaSpn has two putative DNA-binding domains within the N-terminal region, the so-called HTH_Mga (residues 6–65) and Mga (residues 71–158) domains, respectively. Both helix-turn-helix domains are also present in the Mga (7) and AtxA (8) global response regulators. In Mga, such domains were shown to be required for DNA binding and transcriptional activation (28,29).
Our previous work showed that MgaSpn is able to act as a transcriptional activator (6). It activated the P1623B promoter in vivo and, therefore, the expression of the spr1623-spr1626 operon. This activation required a 70-bp region (here named PB activation region) located between the P1623B and Pmga divergent promoters. In this article, we purified an untagged form of the MgaSpn protein and analysed its DNA-binding properties using linear double-stranded DNAs. By gel retardation assays, MgaSpn was shown to bind to any tested DNA. However, DNase I and hydroxyl radical footprinting experiments performed with DNAs (222 and 224 bp) that carried the PB activation region at different locations demonstrated that MgaSpn did not bind randomly at all. MgaSpn recognized the PB activation region as its primary binding site (40 bp; positions −60 to −99 of the P1623B promoter) when it was located at internal position on the DNA molecule (222-bp DNA), but not when it was placed at one DNA end (224-bp DNA). In the latter case, MgaSpn bound preferentially to the Pmga promoter region (44 bp; positions −23 to +21) located at internal position. The two primary binding sites of MgaSpn have a low sequence identity. They share the GGT(A/T)(A/T)AAT and GA(A/T)AATT sequence elements (see Figure 2B). Despite this identity, when both primary binding sites were located at internal positions on longer linear DNA molecules (640–1458 bp), electron microscopy experiments showed that the PB activation region was the preferred target of MgaSpn. This study suggested that local DNA conformations might contribute to the DNA-binding specificity of MgaSpn. According to the bend.it program (22), the two sites recognized preferentially by MgaSpn contain a potential intrinsic curvature flanked by regions of bendability. Moreover, MgaSpn showed a high affinity for a naturally occurring curved DNA. Regarding the Mga global transcriptional regulator of S. pyogenes, several binding sites have been identified. Based on the number of binding sites and their position with respect to the start of transcription, three categories of Mga-regulated promoters were proposed (7,10,30). Sequence alignments of all established Mga-binding regions revealed that they exhibit only 13.4% identity with no discernible symmetry (10). To determine the core nucleotides involved in functional Mga–DNA interactions, Hause and McIver (10) carried out a mutational analysis in some target promoters and established that Mga binds to DNA in a promoter-specific manner. In the case of the B. anthracis global virulence regulator AtxA, sequence similarities in its target promoters are not apparent. Moreover, by in silico and in vitro studies, Hadjifrangiskou and Koehler (14) found that the promoter regions of the three anthrax toxin genes are intrinsically curved. Therefore, a general feature of the Mga/AtxA family of regulators might be their ability to bind to DNA with little or no sequence specificity, as it is the case of many bacterial nucleoid-associated proteins that are able to influence transcription in either a positive or negative manner (31,32). Two main categories of protein–DNA interactions have been proposed: those when the protein recognizes the unique chemical signatures of the DNA bases (base readout) and those when the protein recognizes a sequence-dependent DNA shape (shape readout) (33). In addition, it has been argued that any one DNA-binding protein is likely to use a combination of readout mechanisms to achieve DNA-binding specificity (33). We suggest that a preference for particular DNA structures might contribute to the capacity of the Mga/AtxA family of regulators to control the expression of a wide range of genes.
Another interesting finding of our current study is the ability of the untagged MgaSpn protein to generate multimeric protein–DNA complexes. Gel retardation assays with the 222 and 224-bp DNAs showed that, before disappearance of the unbound DNA, additional protein units bound sequentially to the MgaSpn–DNA complex C1 generating higher-order complexes. On such DNAs, MgaSpn was able to bind to a particular site (PB activation region or Pmga promoter) and then to spread along the adjacent DNA regions, as demonstrated by DNase I and hydroxyl radical experiments. Sequence-dependent DNA structures are thought to be critical components in the assembly of higher-order protein–DNA complexes (33,34). We analysed the nucleotide sequence of the regions (stretches of 50 bp) flanking the primary binding sites of MgaSpn. Compared with the global A + T content (60.3%) of the pneumococcal R6 genome, such adjacent regions display a high A + T content (74–88%), which might facilitate MgaSpn spreading owing to the potential bendability of the DNA in these regions. The H-NS nucleoid-associated protein from enteric bacteria appears to regulate gene expression through a variety of mechanisms (35). As pointed out by Dillon and Dorman (32), one feature of the nucleoid-associated proteins that makes them excellent regulators of gene expression at the global level is their promiscuity in their interactions with DNA. Initially, H-NS was shown to bind preferentially to DNA containing curved regions. Later on, Lang et al. (36) identified high-affinity DNA-binding sites for H-NS in AT-rich regions of the chromosomal DNA. They proposed that H-NS binds initially to high-affinity sites (nucleation sites) and then spreads along the AT-rich DNA regions. In this model, H-NS spreading from specific sites would enable the silencing of extensive regions of the bacterial chromosome. More recently, Shin et al. (37) investigated the H-NS-mediated repression of the LEE5 promoter. Their results supported a new mechanism by which DNA-bound proteins communicate with each other. Basically, H-NS binds to a cluster of A tracks located upstream of the LEE5 promoter (position −114) and then spreads (presumably through oligomerization) to a site at the promoter where H-NS makes specific contacts with the RNA polymerase. Thus, in this model, H-NS spreading on DNA would facilitate encounters between distant regulatory elements.
At present, formation of multimeric protein–DNA complexes has not been shown for other regulators of the Mga/AtxA family. However, in the case of the S. pyogenes Mga regulator, a correlation between the capacity of the protein to oligomerize in solution (without DNA) and its ability to activate transcription has been reported. Also, DNA binding was found to be necessary but insufficient for fully transcriptional activation (12). Under our experimental conditions, the untagged MgaSpn protein formed dimers in solution (100 and 250 mM NaCl) but was able to generate multimeric protein–DNA complexes (20–300 mM NaCl) in the presence of linear double-stranded DNAs. Concerning the B. anthracis AtxA regulator, several strains producing native and functional epitope-tagged AtxA proteins were used to examine protein–protein interactions. Co-affinity purification, non-denaturing PAGE and cross-linking experiments revealed that AtxA exists in a homo-oligomeric state (15).
In conclusion, we have purified an untagged form of the MgaSpn regulatory protein and studied its interaction with linear double-stranded DNAs. On DNA fragments that carried the PB activation region at different positions, MgaSpn recognized a specific site, either the PB activation region or the Pmga promoter. Moreover, on binding to the primary site, MgaSpn was able to spread along the adjacent DNA regions generating multimeric protein–DNA complexes.
FUNDING
[BFU2009-11868 to A.B.] and [CSD2008-00013-INTERMODS to M.E.] from the Spanish Ministry of Economy and Competitiveness, and [PIE-201320E028 to A.B.] from the Spanish National Research Council. Funding for open access charge: Spanish Ministry of Economy and Competitiveness [BFU2009-11868].
Conflict of interest statement. None declared.
ACKNOWLEDGEMENTS
The authors thank Lorena Rodríguez for her excellent technical assistance.
REFERENCES
- 1.Kadioglu A, Weiser JN, Paton JC, Andrew PW. The role of Streptococcus pneumoniae virulence factors in host respiratory colonization and disease. Nat. Rev. Microbiol. 2008;6:288–301. doi: 10.1038/nrmicro1871. [DOI] [PubMed] [Google Scholar]
- 2.van der Poll T, Opal SM. Pathogenesis, treatment, and prevention of pneumococcal pneumonia. Lancet. 2009;374:1543–1556. doi: 10.1016/S0140-6736(09)61114-4. [DOI] [PubMed] [Google Scholar]
- 3.Paterson GK, Blue CE, Mitchell TJ. Role of two-component systems in the virulence of Streptococcus pneumoniae. J. Med. Microbiol. 2006;55:355–363. doi: 10.1099/jmm.0.46423-0. [DOI] [PubMed] [Google Scholar]
- 4.Hava DL, Camilli A. Large-scale identification of serotype 4 Streptococcus pneumoniae virulence factors. Mol. Microbiol. 2002;45:1389–1406. [PMC free article] [PubMed] [Google Scholar]
- 5.Hemsley C, Joyce E, Hava DL, Kawale A, Camilli A. MgrA, an orthologue of Mga, acts as a transcriptional repressor of the genes within the rlrA pathogenicity islet in Streptococcus pneumoniae. J. Bacteriol. 2003;185:6640–6647. doi: 10.1128/JB.185.22.6640-6647.2003. [DOI] [PMC free article] [PubMed] [Google Scholar]
- 6.Solano-Collado V, Espinosa M, Bravo A. Activator role of the pneumococcal Mga-like virulence transcriptional regulator. J. Bacteriol. 2012;194:4197–4207. doi: 10.1128/JB.00536-12. [DOI] [PMC free article] [PubMed] [Google Scholar]
- 7.Hondorp ER, McIver KS. The Mga virulence regulon: infection where the grass is greener. Mol. Microbiol. 2007;66:1056–1065. doi: 10.1111/j.1365-2958.2007.06006.x. [DOI] [PubMed] [Google Scholar]
- 8.Tsvetanova B, Wilson AC, Bongiorni C, Chiang C, Hoch JA, Perego M. Opposing effects of histidine phosphorylation regulate the AtxA virulence transcription factor in Bacillus anthracis. Mol. Microbiol. 2007;63:644–655. doi: 10.1111/j.1365-2958.2006.05543.x. [DOI] [PubMed] [Google Scholar]
- 9.Ribardo DA, McIver KS. Defining the Mga regulon: comparative transcriptome analysis reveals both direct and indirect regulation by Mga in the group A Streptococcus. Mol. Microbiol. 2006;62:491–508. doi: 10.1111/j.1365-2958.2006.05381.x. [DOI] [PubMed] [Google Scholar]
- 10.Hause LL, McIver KS. Nucleotides critical for the interaction of the Streptococcus pyogenes Mga virulence regulator with Mga-regulated promoter sequences. J. Bacteriol. 2012;194:4904–4919. doi: 10.1128/JB.00809-12. [DOI] [PMC free article] [PubMed] [Google Scholar]
- 11.McIver KS, Heath AS, Green BD, Scott JR. Specific binding of the activator Mga to promoter sequences of the emm and scpA genes in the group A Streptococcus. J. Bacteriol. 1995;177:6619–6624. doi: 10.1128/jb.177.22.6619-6624.1995. [DOI] [PMC free article] [PubMed] [Google Scholar]
- 12.Hondorp ER, Hou SC, Hempstead AD, Hause LL, Beckett DM, McIver KS. Characterization of the group A Streptococcus Mga virulence regulator reveals a role for the C-terminal region in oligomerization and transcriptional activation. Mol. Microbiol. 2012;83:953–967. doi: 10.1111/j.1365-2958.2012.07980.x. [DOI] [PMC free article] [PubMed] [Google Scholar]
- 13.Fouet A. AtxA, a Bacillus anthracis global virulence regulator. Res. Microbiol. 2010;161:735–742. doi: 10.1016/j.resmic.2010.09.006. [DOI] [PubMed] [Google Scholar]
- 14.Hadjifrangiskou M, Koehler TM. Intrinsic curvature associated with the coordinately regulated anthrax toxin gene promoters. Microbiology. 2008;154:2501–2512. doi: 10.1099/mic.0.2007/016162-0. [DOI] [PMC free article] [PubMed] [Google Scholar]
- 15.Hammerstrom TG, Roh JH, Nikonowicz EP, Koehler TM. Bacillus anthracis virulence regulator AtxA: oligomeric state, function and CO2 -signalling. Mol. Microbiol. 2011;82:634–647. doi: 10.1111/j.1365-2958.2011.07843.x. [DOI] [PMC free article] [PubMed] [Google Scholar]
- 16.Hoskins J, Alborn WE, Jr, Arnold J, Blaszczak LC, Burgett S, DeHoff BS, Estrem ST, Fritz L, Fu DJ, Fuller W, et al. Genome of the bacterium Streptococcus pneumoniae strain R6. J. Bacteriol. 2001;183:5709–5717. doi: 10.1128/JB.183.19.5709-5717.2001. [DOI] [PMC free article] [PubMed] [Google Scholar]
- 17.Ruiz-Cruz S, Solano-Collado V, Espinosa M, Bravo A. Novel plasmid-based genetic tools for the study of promoters and terminators in Streptococcus pneumoniae and Enterococcus faecalis. J. Microbiol. Methods. 2010;83:156–163. doi: 10.1016/j.mimet.2010.08.004. [DOI] [PubMed] [Google Scholar]
- 18.Studier FW, Rosenberg AH, Dunn JJ, Dubendorff JW. Use of T7 RNA polymerase to direct expression of cloned genes. Methods Enzymol. 1990;185:60–89. doi: 10.1016/0076-6879(90)85008-c. [DOI] [PubMed] [Google Scholar]
- 19.Yanisch-Perron C, Vieira J, Messing J. Improved M13 phage cloning vectors and host strains: nucleotide sequences of the M13mp18 and pUC19 vectors. Gene. 1985;33:103–119. doi: 10.1016/0378-1119(85)90120-9. [DOI] [PubMed] [Google Scholar]
- 20.Siegel LM, Monty KJ. Determination of molecular weights and frictional ratios of proteins in impure systems by the use of gel filtration and density gradient centrifugation. Applications to crude preparations of sulfite and hydroxylamine reductases. Biochim. Biophys. Acta. 1966;112:346–362. doi: 10.1016/0926-6585(66)90333-5. [DOI] [PubMed] [Google Scholar]
- 21.Spiess E, Lurz R. Electron microscopic analysis of nucleic acids and nucleic acid-protein complexes. Methods Microbiol. 1988;20:293–323. [Google Scholar]
- 22.Vlahovicek K, Kaján L, Pongor S. DNA analysis servers: plot.it, bend.it, model.it and IS. Nucleic Acids Res. 2003;31:3686–3687. doi: 10.1093/nar/gkg559. [DOI] [PMC free article] [PubMed] [Google Scholar]
- 23.Carey J. Gel retardation at low pH resolves trp repressor-DNA complexes for quantitative study. Proc. Natl Acad. Sci. USA. 1988;85:975–979. doi: 10.1073/pnas.85.4.975. [DOI] [PMC free article] [PubMed] [Google Scholar]
- 24.Gabrielian A, Vlahovicek K, Pongor S. Distribution of sequence-dependent curvature in genomic DNA sequences. FEBS Lett. 1997;406:69–74. doi: 10.1016/s0014-5793(97)00236-6. [DOI] [PubMed] [Google Scholar]
- 25.Diekmann S. Temperature and salt dependence of the gel migration anomaly of curved DNA fragments. Nucleic Acids Res. 1987;15:247–265. doi: 10.1093/nar/15.1.247. [DOI] [PMC free article] [PubMed] [Google Scholar]
- 26.Adamczak R, Porollo A, Meller J. Combining prediction of secondary structure and solvent accessibility in proteins. Proteins. 2005;59:467–475. doi: 10.1002/prot.20441. [DOI] [PubMed] [Google Scholar]
- 27.Punta M, Coggill PC, Eberhardt RY, Mistry J, Tate J, Boursnell C, Pang N, Forslund K, Ceric G, Clements J, et al. The Pfam protein families database. Nucleic Acids Res. 2012;40:D290–D301. doi: 10.1093/nar/gkr1065. [DOI] [PMC free article] [PubMed] [Google Scholar]
- 28.McIver KS, Myles RL. Two DNA-binding domains of Mga are required for virulence gene activation in the group A streptococcus. Mol. Microbiol. 2002;43:1591–1601. doi: 10.1046/j.1365-2958.2002.02849.x. [DOI] [PubMed] [Google Scholar]
- 29.Vahling CM, McIver KS. Domains required for transcriptional activation show conservation in the Mga family of virulence gene regulators. J. Bacteriol. 2006;188:863–873. doi: 10.1128/JB.188.3.863-873.2006. [DOI] [PMC free article] [PubMed] [Google Scholar]
- 30.Almengor AC, McIver KS. Transcriptional activation of sclA by Mga requires a distal binding site in Streptococcus pyogenes. J. Bacteriol. 2004;186:7847–7857. doi: 10.1128/JB.186.23.7847-7857.2004. [DOI] [PMC free article] [PubMed] [Google Scholar]
- 31.Browning DF, Grainger DC, Busby SJW. Effects of nucleoid-associated proteins on bacterial chromosome structure and gene expression. Curr. Opin. Microbiol. 2010;13:773–780. doi: 10.1016/j.mib.2010.09.013. [DOI] [PubMed] [Google Scholar]
- 32.Dillon SC, Dorman CJ. Bacterial nucleoid-associated proteins, nucleoid structure and gene expression. Nat. Rev. Microbiol. 2010;8:185–195. doi: 10.1038/nrmicro2261. [DOI] [PubMed] [Google Scholar]
- 33.Rohs R, Jin X, West SM, Joshi R, Honig B, Mann RS. Origins of specificity in protein-DNA recognition. Annu. Rev. Biochem. 2010;79:233–269. doi: 10.1146/annurev-biochem-060408-091030. [DOI] [PMC free article] [PubMed] [Google Scholar]
- 34.Serrano M, Salas M, Hermoso JM. Multimeric complexes formed by DNA-binding proteins of low sequence specificity. Trends Biochem. Sci. 1993;18:202–206. doi: 10.1016/0968-0004(93)90187-r. [DOI] [PubMed] [Google Scholar]
- 35.Fang FC, Rimsky S. New insights into transcriptional regulation by H-NS. Curr. Opin. Microbiol. 2008;11:113–120. doi: 10.1016/j.mib.2008.02.011. [DOI] [PMC free article] [PubMed] [Google Scholar]
- 36.Lang B, Blot N, Bouffartigues E, Buckle M, Geertz M, Gualerzi CO, Mavathur R, Muskhelishvili G, Pon CL, Rimsky S, et al. High-affinity DNA binding sites for H-NS provide a molecular basis for selective silencing within proteobacterial genomes. Nucleic Acids Res. 2007;35:6330–6337. doi: 10.1093/nar/gkm712. [DOI] [PMC free article] [PubMed] [Google Scholar]
- 37.Shin M, Lagda AC, Lee JW, Bhat A, Rhee JH, Kim JS, Takeyasu K, Choy HE. Gene silencing by H-NS from distal DNA site. Mol. Microbiol. 2012;86:707–719. doi: 10.1111/mmi.12012. [DOI] [PubMed] [Google Scholar]


