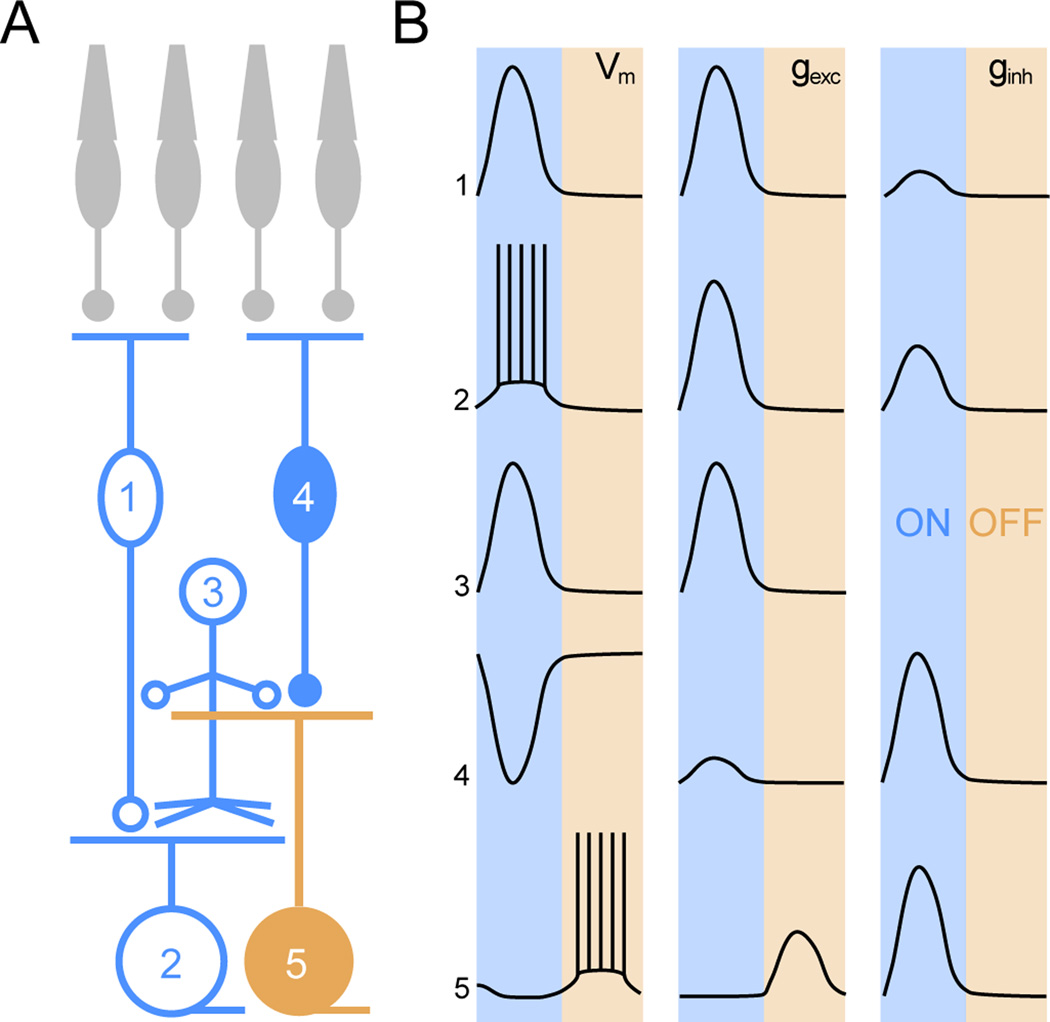
Figure 8. Schematic illustration of retinal circuit activation during stage III waves.
(A) Circuit diagram of the retina. Numbers denote: 1 - ON CBC, 2 - ON RGC, 3 - diffuse AC, 4 -OFF CBC, 5 - OFF RGC. Color cording indicates whether the respective neurons participate in the ON (blue) or OFF (orange) phase of stage III waves. (B) Activity patterns (VM) as well as excitatory (gexc) and inhibitory (ginh) synaptic conductances of the cells depicted in (A) are summarized. Shaded areas mark the ON and OFF phase of stage III waves. The relative amplitudes of gexc and ginh traces are representative of the relative size of these conductances in a given cell but not between different cells.

