

Abstract
Numerous quantitative PCR assays for microbial fecal source tracking (MST) have been developed and evaluated in recent years. Widespread application has been hindered by a lack of knowledge regarding the geographical stability and hence applicability of such methods beyond the regional level. This study assessed the performance of five previously reported quantitative PCR assays targeting human-, cattle-, or ruminant-associated Bacteroidetes populations on 280 human and animal fecal samples from 16 countries across six continents. The tested cattle-associated markers were shown to be ruminant-associated. The quantitative distributions of marker concentrations in target and nontarget samples proved to be essential for the assessment of assay performance and were used to establish a new metric for quantitative source-specificity. In general, this study demonstrates that stable target populations required for marker-based MST occur around the globe. Ruminant-associated marker concentrations were strongly correlated with total intestinal Bacteroidetes populations and with each other, indicating that the detected ruminant-associated populations seem to be part of the intestinal core microbiome of ruminants worldwide. Consequently tested ruminant-targeted assays appear to be suitable quantitative MST tools beyond the regional level while the targeted human-associated populations seem to be less prevalent and stable, suggesting potential for improvements in human-targeted methods.
Introduction
The presence of fecal pollution in environmental waters poses a potential threat to human health all around the globe. While traditional fecal indicator bacteria such as Escherichia coli are capable of detecting the presence of fecal contamination, they are unable to determine its origin. Understanding the sources of contamination is essential for facilitating remediation measures, resolving legal responsibility and characterizing potential public health risks via quantitative microbial risk assessment.1 This has led to the development of a plethora of microbial source tracking (MST) methods, many of which have been recently reviewed.2 During recent years library-independent MST methods such as those involving genetic markers targeting host-associated and abundant populations of fecal anaerobic bacteria, e.g. from the phylum Bacteroidetes, have become increasingly prominent.3,4 The anaerobic members from the phyla Bacteroidetes and Firmicutes numerically and funcionally dominate the intestinal microbiota of mammals,4 play an important role in host health and nutrition,5−7 and are therefore prime targets as indicators of state-of-the-art fecal pollution detection and characterization. In particular, quantitative PCR (qPCR) has emerged as the preferred molecular method of detection, as it offers the ability to determine the concentration of a particular target gene (i.e. marker) and not just presence or absence. To date qPCR assays have been developed for various fecal sources including humans, ruminants, cattle, swine, gulls, and others.3,4 In addition several markers for total fecal pollution have also been proposed.8−10 However, the widespread use of many qPCR assays has been limited, resulting in a paucity of data regarding the source-specificity and sensitivity of markers beyond the regional level.11−14
In this study the authors set out to assess the performance of a range of previously reported qPCR assays targeting host-associated genetic markers from the phylum Bacteroidetes on a transcontinental scale. More than 300 fecal samples were collected across six continents. The study concept called for 25% of the samples, each, to come from the target sources humans and ruminant animals and 50% to come from various nontarget sources. Assays were selected among the methods available at the beginning of the study in 2008 according to the following criteria: (i) that they targeted either human or ruminant/bovine sources, (ii) that they reported high levels of specificity in the original publications, and (iii) that they were previously evaluated probe-based 5′-nuclease assays. The selected assays were the human-targeted qPCR assays BacH15 and BacHum,10 the cattle-targeted qPCR assays BacCow10 and BoBac,9 and the ruminant-targeted assay BacR.16 All these assays amplify markers situated in the variable region 2 of the 16S rRNA gene of fecal Bacteroidetes and they had shown source-specificities higher than 90% in their original publication. The aim of the study was to determine (i) the prevalence and abundance of the markers in feces of the targeted source-group, (ii) the source-specificity of the assay against nontarget fecal sources, and (iii) the quantitative contribution of source-associated markers to the total intestinal Bacteroidetes community.
Materials and Methods
Collection and Processing of Fecal Samples
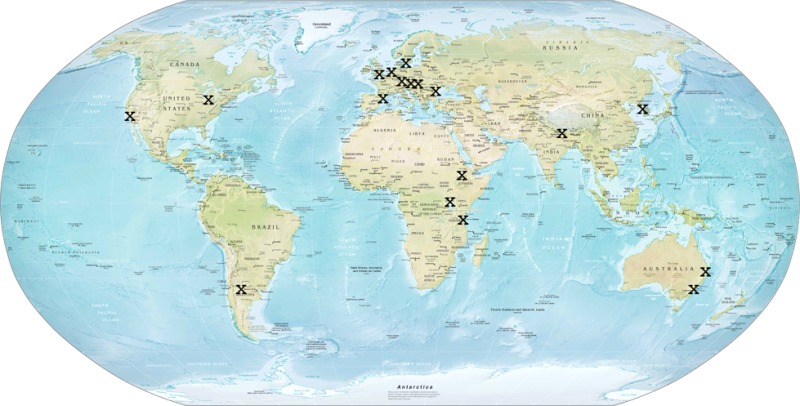
During the period 2007 to 2008 samples of fecal material from healthy human volunteers and nonhuman sources were collected by participating laboratories in 16 countries: Argentina, Australia, Austria, Ethiopia, Germany, Hungary, Korea, Nepal, Netherlands, Romania, Spain, Sweden, Tanzania, Uganda, United Kingdom, and the United States of America (for a map, see abstract art). Clearly defined sampling guidelines were circulated to all partners prior to sampling to ensure that only samples of known origin were included in the study and to avoid any contamination of samples. Sampling guidelines specifically called for sampling a broad variety of domesticated and wild host animals from various habitats. In total 320 freshly voided, individual fecal samples of known origin were collected during the study. Of these samples 22% were of human origin, 28% of ruminant origin, and 50% from other animal sources (e.g., wild birds, swine, horses, companion animals). All fecal samples were collected in sterile sampling vials and transported in the dark and on ice to the individual laboratories. Samples were stored at −20 °C within 6 h after sampling, and DNA extraction was performed within two months after sampling.
DNA Extraction
Fecal DNA was extracted using commercially available kits (MoBio Power Soil DNA Isolation Kit, the Qiagen Stool DNA Kit or the QIAmp Viral RNA Mini Kit), DNA was precipitated using isopropanol (0.6× volume), and DNA pellets were covered with 70% ethanol and shipped to the lead partner institution in Austria for further analysis. Blank extractions with no added fecal material were also performed in parallel. Upon arrival in Austria all extracted fecal DNA samples were purified using the Wizard DNA Cleanup Kit (Promega, Mannheim, Germany) to ensure comparable DNA purity and removal of PCR inhibitors. DNA concentration and quality were subsequently determined using a NanoDrop ND 1000 UV spectrophotometer (Thermo Fisher Scientific Inc., Vienna, Austria). DNA extracts with concentrations of >30 ng μL–1 were diluted 10-fold, in order to bring the DNA concentration in all extracts to between 3 and 30 ng μL–1 for further analysis. The majority of the DNA concentrations in the purified extracts were between 5 and 12 ng/μL (Figure S1). The final data set included samples of fecal DNA from the following sources: Homo sapiens (human, n = 61); ruminant animals (n = 79) comprised of Bos taurus (cattle, n = 47), Ovis aries (sheep, n = 16), Cervus elaphus (deer, n = 8), Capra hircus (goat, n = 6), Rupicapra rupicapra (chamois, n = 1), and Lama sp. (llama, n = 1); nonruminant animals (n = 140) covering Equus caballus (horse, n = 17), Macropus sp. (kangaroo, n = 4), Oryctolagus cuniculus (rabbit, n = 2), Lepus timidus (mountain hare, n = 1), Equus asinus (donkey, n = 2), Equus quagga (zebra, n = 1), Marmota marmota (groundhog, n = 1), Sus scrofa domesticus (swine, n = 21), Sus scrofa (wild boar, n = 8), Canis lupus familiaris (dog, n = 29), Felis catus (cat, n = 7), Canis latrans (coyote, n = 1), Didelphis sp. (opposum, n = 1), Lontra canadensis (river otter, n = 1), Gallus gallus (chicken, n = 19), Anas platyrhynchos (duck, n = 5), members of the subfamily Anserinae (geese, n = 3), members of the family Columbidae (pigeons, n = 3), members of the family Sturnidae (starlings, n = 2), Meleagris gallopavo (turkey, n = 2), Larus sp. (gull, n = 1) and other wild birds including parrot, coot, grebe, owl, and pelican (n = 9).
qPCR Assays
The DNA extracts were then tested for amplifiable fecal DNA and absence of PCR inhibition by applying the AllBac qPCR assay which detects the 16S rRNA genes of a broad spectrum of Bacteroidetes.9 In this study the AllBac qPCR assay was used to assess the quality of DNA extracts and to estimate total Bacteroidetes concentrations in the samples. PCR inhibition was assessed by determining the AllBac marker concentrations in the 1:4 and 1:16 sample dilutions. Extracts with matching concentrations in the two dilutions (2 cycles difference in threshold cycle value in qPCR) were judged free of PCR inhibitory substances in the 1:4 dilution. The human-targeted assays tested in this study were the BacH assay15 and the BacHum assay.10 The ruminant- or bovine-specific assays tested in this study were the BacCow assay,10 the BacR assay,16 and the BoBac assay9 (see Table S1 for further details). An effort was made to reproduce the composition of the published reaction mixtures and conditions as closely as possible. However, not all reaction components (e.g. polymerases) used in the original publications were commercially available at the time of this study and therefore all assays were run using the iQ Supermix (Biorad, Hercules, U.S.A.) on an iCycler iQ Real-Time Detection System (Biorad). All qPCR reactions were run in a total volume of 25 μL, with 2.5 μL of sample DNA dilution, 12.5 μL of Supermix, and 400 ng μL–1 bovine serum albumin, while the originally published primer, probe, and MgCl2 concentrations were maintained. All qPCR assays followed the published temperature program with 40 PCR cycles. The adapted assays were checked for stringency by annealing temperature gradient experiments, and the PCR efficiency under the applied conditions was verified. Quantification was based on appropriate plasmid standard dilutions.17 Plasmid DNA was prepared using either the respective specific PCR product amplified out of a fecal DNA with the respective primers or matching full-length 16S rRNA genes. Fragments were cloned into a pGEM-T vector (Promega, Mannheim, Germany) and transformed into E. coli strain JM109. After subsequent cultivation at 37 °C for 15 ± 1 h, plasmids were extracted using the Fast Plasmid MiniKit (Eppendorf, Hamburg, Germany) resulting in a pure plasmid solution. Plasmid DNA concentration was measured using a NanoDrop 1000 spectrophotometer (Thermo Fisher Scientific). The plasmid stock was diluted in an unspecific 500 ng/mL poly(dI-dC) background to avoid adsorption of plasmid DNA to reaction vials at low plasmid concentrations (Roche Diagnostics, Mannheim, Germany). A total of at least five 10-fold serial dilutions of plasmid standard (100 to 104 gene copies) were run on each well plate as well as several no-template and DNA extraction controls. All qPCR runs in this study had a PCR efficiency of between 92% and 105%, and the no-template controls were consistently negative.
All sample DNA extracts were diluted 4-fold and measured in duplicate with the tested source-associated assays. Results were reported as marker copy numbers per reaction volume in this dilution. Results <1 copy per reaction were set to 0. All the results in this study are reported directly as qPCR copy numbers in the 4-fold dilution, and analysis was focused on comparisons between distributions of concentrations in groups of samples.
Data Analysis
All the data analysis was done with either Microsoft Excel 2003 or Sigma Plot 11 (Systat Software Inc., Chicago, IL). All qPCR data were converted into a logarithmic format by adding 1 to each value and subsequent log10 transformation. The 25th/75th metric was calculated by subtracting the 75th percentile concentration in nontarget samples for a given assay from the 25th percentile concentration in target samples (25th/75th metric = 25th percentiletarget – 75th percentilenontarget). Spearman rank order correlation was used for calculation of correlation coefficients between parameters. For the correlation analysis between AllBac and the source-associated markers several samples with very low AllBac but high source-associated marker concentrations were tagged as outliers and removed from the analysis (n = 3 for BacH, BacCow, BacR, and BoBac, respectively).
Results
Sample Logistics and Processing
The participating laboratories in this study collected 320 fecal samples from mammal and bird species in 16 countries on six continents (see abstract art). While human and ruminant fecal sources were sampled in all participating countries, the selection of nontarget sources was based on prevalence and importance of such sources in watersheds from each respective country. This accounts for the varying representation of the different nontarget species from each country (as shown in Table S2). Extracted sample DNA was transferred to the lead partner institution in Austria (Vienna University of Technology), and the DNA was purified to ensure comparable DNA purity and remove possible PCR inhibitors. Figure S1 shows the distribution of DNA concentrations in the purified DNA extracts. The AllBac qPCR assay (9) was used to enumerate the total intestinal Bacteroidetes population and served as a control parameter for DNA quality and purity. In total, 280 samples contained the AllBac marker in matching quantities in the two tested extract dilutions (4-fold and 16-fold), providing evidence for the presence of Bacteroidetes 16S rRNA genes and the absence of PCR inhibition in those extract dilutions18,19 (Figure S2). The provenance of the samples included in further analysis is shown in Table S2. Following these preparatory steps the human-targeted qPCR assays BacH15 and BacHum,10 the cattle-targeted qPCR assays BacCow10 and BoBac,9 and the ruminant-targeted assay BacR16 were applied on the 4-fold dilution of these selected DNA extracts (Table 1). DNA extraction controls did not contain detectable levels of any of the source-associated markers. Due to the limited number of samples per region (approximately 20), the heterogeneous mix of available sources and the biogeographical diversity, the authors refrained from analyzing samples by sample provenance.
Table 1. Numbers of qPCR Positives with Tested Assays in Source Species or Source Groupsa.
| qPCR positive |
||||||
|---|---|---|---|---|---|---|
| source | no. samples | BacH | BacHum | BacCow | BacR | BoBac |
| human | 61 | 47 | 53 | 14 | 5 | 17 |
| ruminants | ||||||
| cattle | 47 | 30 | 13 | 45 | 45 | 40 |
| sheep | 16 | 5 | 8 | 14 | 14 | 11 |
| deer | 8 | 5 | 1 | 7 | 6 | 6 |
| goat | 6 | 3 | 0 | 5 | 4 | 6 |
| chamois | 1 | 1 | 0 | 1 | 1 | 1 |
| llama | 1 | 0 | 0 | 1 | 1 | 1 |
| total | 79 | 44 | 22 | 73 | 71 | 65 |
| nonruminant herbivores | ||||||
| horse | 17 | 5 | 8 | 14 | 4 | 5 |
| kangaroo | 4 | 2 | 2 | 4 | 0 | 0 |
| hare/rabbit | 3 | 1 | 3 | 0 | 0 | 1 |
| donkey | 2 | 1 | 0 | 0 | 0 | 0 |
| zebra | 1 | 0 | 0 | 0 | 0 | 0 |
| groundhog | 1 | 0 | 0 | 0 | 0 | 0 |
| total | 28 | 9 | 13 | 18 | 4 | 6 |
| omnivores | ||||||
| pig | 21 | 7 | 5 | 14 | 1 | 6 |
| wild boar | 8 | 2 | 1 | 5 | 1 | 1 |
| total | 29 | 9 | 6 | 19 | 2 | 7 |
| carnivores | ||||||
| dog | 29 | 15 | 15 | 11 | 10 | 22 |
| cat | 7 | 6 | 5 | 0 | 0 | 6 |
| coyote | 1 | 1 | 1 | 1 | 1 | 1 |
| opossum | 1 | 1 | 1 | 1 | 0 | 0 |
| otter | 1 | 0 | 0 | 1 | 1 | 0 |
| total | 39 | 23 | 22 | 14 | 12 | 29 |
| birds | ||||||
| chicken | 19 | 9 | 1 | 12 | 4 | 11 |
| duck | 5 | 0 | 3 | 1 | 0 | 3 |
| pigeon | 3 | 1 | 0 | 1 | 0 | 2 |
| goose | 3 | 1 | 1 | 2 | 2 | 3 |
| other birdsb | 14 | 7 | 3 | 5 | 3 | 5 |
| total | 44 | 18 | 8 | 21 | 9 | 24 |
| sensitivity (%)c | 280e | 77 | 87 | 92 | 90 | 82 |
| specificity (%)d | 280e | 53 | 68 | 57 | 84 | 59 |
Overall source sensitivities and source specificities appear at the bottom of the table.
Samples from parrot, coot, grebe, owl, pelican, turkey, starling, and gull (all n ≤ 2).
Source-sensitivity (%) = 100 × true-positives/(true-positives + false-negatives).
Source-specficity (%) = 100 × true-negatives/(true-negatives + false-positives).
Total number of samples.
Qualitative Aspects of Assay Sensitivity and Specificity
The qualitative source-sensitivity was defined as the percentage of target samples (i.e., human fecal samples for human-targeted assays) giving a positive detection by qPCR, regardless of the marker concentration (all signals ≥1 copy per reaction; true-positives). Qualitative source-specificity was defined as the percentage of nontarget samples not detected by qPCR (all signals <1 copy per reaction; true-negatives) (Table 1).
Qualitative source-sensitivities ranged from 77% for BacH to 92% for BacCow, with BacR and BacCow showing sensitivities ≥90% (Table 1). At this stage in the analysis the qualitative source-sensitivity results revealed that the previously published bovine-specific assays (BacCow, BoBac) tended to detect not only cattle but also samples from other ruminant animals. For this reason it was decided to treat BacCow and BoBac as ruminant-targeted assays rather than bovine-specific assays in all subsequent analyses.
The qualitative source-specificities of the human-targeted assays were 53% for BacH and 68% for BacHum (Table 1). The ruminant-targeted assays BacCow and BoBac showed qualitative specificities of 57% and 59%, respectively, while the specificity of the BacR assay was higher at 84%.
Detailed investigation of the results revealed that in the case of BacH a disproportionally high number of false-positives occurred with cattle feces (64% of the samples positive with BacH) and with carnivore samples (dog, cat, opossum, coyote, otter). BacHum also seemed to lack specificity against carnivores, while it was much more specific against bird fecal material than BacH. BacCow yielded high numbers of false-positives with horse, swine and poultry samples. BacR showed the highest qualitative specificities in most subgroups with some false-positives from dog samples. BoBac had the lowest levels of qualitative source-specificity of all assays in the subgroups of carnivores and birds.
Quantitative Aspects of Assay Specificity and Sensitivity
Although qualitative source-specificity and -sensitivity provide a general indication of assay performance based on the presence/absence of specific markers, they give no information concerning the relative abundance of those markers in such sources. This is important as differences in marker abundance with respect to the source have significant implications for suitability and applicability of qPCR assays for MST purposes. Fortunately, qPCR assays (as the name suggests) allow the quantitative distribution of the marker concentrations in target and nontarget samples to be determined, leading to a more accurate and in-depth assessment of assay performance (specificity and sensitivity).
The results of the quantitative analysis of source-sensitivity and -specificity revealed that marker concentrations in target samples exhibited relatively broad distributions (Figures 1 and S5). For example, the 10th and 90th percentiles of the ruminant-associated assays were separated by 5 to 6 orders of magnitude. The median values ranged from below log 2 marker copies per reaction (cp/rct) for BacH to almost log 4 cp/rct for BoBac. Among the human-targeted assays the BacH marker had a slightly lower median concentration and a broader quantitative distribution in human fecal extracts than BacHum. In comparison, the levels of ruminant-associated markers in target samples were higher and showed quite similar distributions (Figures 1 and S5).
Figure 1.

Concentrations of markers measured in target and nontarget fecal DNA extracts for each assay. Results were measured in the 1:4 dilution of the DNA samples and transformed into logarithmic format after addition of 1 to each value. Boxes, 25th and 75th percentile; lines within the boxes, median; whiskers, 10th and 90th percentile, respectively; n, number of samples in each category.
The marker concentrations in nontarget samples were much lower with very distinct distributions for the tested assays. The markers were not detectable in more than half of the nontarget samples for all assays tested in the study. The distribution of false-positive detections was found to be quite similar for BacH, BacHum, and BacCow with the respective 75th percentile concentrations between log 0.67 and log 1.07 cp/rct. As a metric for the quantitative disparity between the distributions of true-positives and false-positives, respectively, the distance between the 25th percentile in target samples and the 75th percentile concentration in nontarget samples was calculated. For BacH and BoBac this “25th/75th metric” was −0.6 and −0.2 log units, respectively, i.e. the 75th percentile of false-positives was higher than the 25th percentile of true-positives. For BacCow and BacHum the 25th/75th metrics were 0.4 and 0.7 log units, respectively; for BacR it was larger than 1.6 log units, giving BacR not only the highest qualitative specificity but also the clearest separation of false-positive and true-positive signals. Nevertheless all assays detected a certain number of samples with high-level false-positive signals (Figure 1). Differences in DNA concentrations in DNA extracts were very small (Figure S1) so normalization of marker concentrations by DNA load had little effect on the distributions as is evident in Figure S5 showing the same data as Figure 1 but normalized against DNA amount. In order to investigate whether the false-positives are attributable to specific source groups the quantitative data was separated by the source groups humans, ruminating mammals, nonruminating herbivorous mammals, omnivorous mammals, carnivorous mammals, and birds (Figures S3 and S8). It should be noted that not all of the nontarget sources were represented in the samples from each individual country of origin (Table S2). Similar to the results shown in Table 1 the BoBac assay showed distinct “blind spots” for excluding carnivore and bird feces, while the other assays showed no distinct vulnerability for samples from certain groups yielding false-positive results of similar concentrations across all source groups.
Quantitative Relation of MST Markers to Total Intestinal Bacteroidetes Population
Correlation analysis was used to investigate the quantitative relation of the host-associated Bacteroidetes populations to the total intestinal Bacteroidetes population as enumerated by the AllBac assay in the target fecal samples. This particular analysis only includes samples that were positive both with AllBac and each respective source-targeted assay. The concentrations of BacH and AllBac in human feces showed a moderate correlation (Spearman rank order correlation r = 0.52, p < 0.001, n = 44). The correlation between BacHum and AllBac levels showed a higher association (r = 0.66, p < 0.001, n = 53). All ruminant-targeted assays were more strongly correlated with AllBac in the ruminant samples (r = 0.81, for BacCow [n = 70]; r = 0.88 for BacR [n = 68]; r = 0.78 for BoBac [n = 62]; all p < 0.001). Interestingly, the concentrations of the ruminant-associated markers tended to rise almost linearly with the AllBac concentrations as demonstrated by the scatter plots and regressions in Figure 2c–e. In other words, the ruminant-associated populations made up a stable and high percentage of the total Bacteroidetes population in most of the ruminant fecal samples. In contrast, the human-associated markers showed a lower contribution to the total Bacteroidetes population and strong fluctuations in their relative abundance (Figure 2a,b).
Figure 2.

Quantitative relationship of AllBac concentration vs BacH (a), BacHum (b), BacCow (c), BacR (d), and BoBac (e) in target samples. The figure only includes samples yielding positive results with both assays compared in a plot; dashed lines denote the first median while solid lines are linear regression curves. Equations and coefficients of determination for regressions are given in the figure.
Quantitative Relations among Source-Associated Marker Concentrations
We also performed pairwise correlation analysis of the marker concentrations between the two human-targeted assays (BacH and BacHum) and between each of the three ruminant-targeted assays (BacCow, BacR, and BoBac). The marker concentrations measured in the human samples with BacH and BacHum showed only a weak correlation (r = 0.46, p < 0.001, n = 61). In sharp contrast, comparison of the results from ruminant-targeted assays in ruminant feces showed much stronger associations (r = 0.92 for BacCow vs BacR; r = 0.94 for BacCow vs BoBac; r = 0.92 for BacR vs BoBac; all p < 0.01 and n = 77). Figure S4a-d visualizes this relationship and also shows the distributions of false-positive signals derived from nontarget samples using the different assays. This projection greatly facilitates the comparison of the distribution of true-positive and false-positive signals in the plotted assays. For example it becomes even more evident that although BoBac might have similar numbers of false-positives as the BacCow assay (qualitative specificity) the concentrations of BoBac in false-positive nontarget samples are much higher than those of BacCow (quantitative specificity).
Discussion
Issues of Analytical Performance of qPCR Assays
The specific and reliable detection of a genetic marker in environmental samples poses a number of challenges. Careful assay design and PCR optimization are required in order to ensure the highest possible analytical specificity and sensitivity.18 This study dealt with the issue of analytical specificity and sensitivity by meticulously testing qPCR reaction conditions for all assays (e.g., PCR annealing temperature) in order to ensure optimal PCR efficiency, while maintaining stringency. To maintain high analytical specificity 5′-nuclease-probe based qPCR assays are generally preferred to SYBR-green based detection formats in marker-based MST applications3 which is the reason why only probe-based qPCR formats were used in the performance analyses in this study. In contrast to the analytical specificity and sensitivity, the diagnostic specificity and sensitivity of marker-based MST applications describe the ability to precisely detect a source of fecal pollution (e.g. the source-specificities reported herein) and was the main focus of this study.
Source-Sensitivity, -Specificity and Global Applicability
To our knowledge this is the first coordinated transcontinental investigation into the performance of MST qPCR assays and provides evidence that the tested host-associated genetic markers indeed seem to be ubiquitous in occurrence. What is more, the quantitative results demonstrated that the markers generally were more abundant in target-source fecal material than in nontarget material. However, the distance between the respective distributions as calculated by the 25th/75th metric varied significantly among the different assays (BacR > BacHum > BacCow > BoBac > BacH). The large differences observed highlight the necessity to pay attention to quantitative aspects of source-specificity when trying to assess the performance and applicability of such MST assays. Qualitative estimates of source-specificity based on mere presence/absence data are highly dependent on aspects such as the definition of assay limits of detection and approaches to data handling.1
Interestingly, the qualitative source-specificities determined in this study were found to be consistently lower than those reported in the original publications, conducted at a local or regional level.9,10,15,16 This discrepancy might be attributable to differences in DNA isolation procedure (yield and quality) and qPCR preparation (PCR chemistry, sample DNA load, etc.) as well as the lower numbers of samples used for initial evaluation but also to geographical patterns of marker occurrence in nontarget samples. The few published evaluation studies investigating source-specificities in other regions found similar percentages of false-positives in nontarget fecal samples as the current transcontinental study.11,12,14
It should be mentioned that this study was focused on defined fecal samples from humans, ruminants, and other animals as the primary sources of fecal pollution and therefore did not include secondary environmental compartments such as raw and treated wastewater.
It has been suggested that there is no fixed performance threshold that categorizes a particular assay as suitable/applicable for MST.19,20 Therefore, the requirements on assay performance are very much specific to each MST problem and the conditions present within a particular study area. In a recent study the authors showed that the applicability of specific methods is highly dependent on the presence and quantitative importance of the specific fecal source groups.21 Models incorporating the uncertainties arising from low source-specificity can be used to assess whether a reliable source identification, or even quantitative allocation, can been achieved.3,10,20−22
Characteristics of MST Target Populations across the Globe
Total intestinal Bacteroidetes marker concentrations were enumerated using the AllBac assay. This marker has been reported to target not only intestinal but also nonintestinal Bacteroidetes, casting doubt on its value for fecal indication.23,24 For the purposes of this investigation, however, the broad sensitivity and the consistently high concentrations of AllBac in various fecal sources make this marker a suitable choice as a measure for the total intestinal Bacteroidetes population in a sample setup consisting exclusively of fecal samples.9,23,25 Comparing source-associated marker concentrations to the total intestinal Bacteroidetes population as enumerated by AllBac provided some insight into population dynamics and the stability of the assays’ target populations at a worldwide level. For the vast majority of the ruminant samples, an increase in the host-associated marker concentrations using either of the three ruminant markers corresponded directly to an increase in concentrations of the AllBac marker. Keeping in mind the widespread origin of the investigated samples it is remarkable that the populations detected by the BacCow, BacR, and BoBac markers seem to form a stable and highly abundant subpopulation of the total intestinal Bacteroidetes population, as detected by AllBac in ruminant feces from around the globe. In contrast to the ruminant-targeted assays the populations detected using the human-associated markers (BacH and BacHum) appeared to be a less dominant and more variable subpopulation of the total intestinal Bacteroidetes population, as detected by AllBac in human fecal samples from around the globe (Figure 3).
Figure 3.

Percentages of the host-associated marker concentrations in relation to AllBac concentrations in the respective target samples. The y-axis is scaled logarithmically.
Interestingly, the strong correlations between the results from the different ruminant-targeted assays suggest that the three different assays actually detect the same core bacterial population albeit with strong differences in source-specificity against nonruminant samples. In general, a trade-off appears to exist between source-specificity and source-sensitivity with an increase in one leading to a decrease in the other parameter.11,26 For instance, when comparing BacR and BoBac in this study, BacR showed higher quantitative source-specificity while BoBac exhibited higher quantitative source-sensitivity (marker abundance in target samples). Several studies by Shanks et al. found evidence for a strong influence of different diets (e.g., forage vs processed feed) on bacterial population structure27 as well as on MST marker prevalence and abundance11 in feces of different cattle populations in the United States. They found the highest marker concentrations in feces from cows fed with forage. These results are consistent with the high prevalence of the ruminant-associated markers in feces from mostly wild or grazing ruminant animals sampled in the current study.
In contrast to the ruminant-targeted assays, the relatively weak correlation observed between the results of the two human-targeted assays in human samples suggested that BacH and BacHum target distinct human-associated clades of the phylum Bacteroidetes (Figure S4a-d). As such, the complementary nature of the target populations indicated that it might be worthwhile to combine the two assays in order to improve specificity to human fecal contamination. By combining these two assays in our data set and defining that only a positive result with both BacH and BacHum in a sample counts as a positive human-associated signal qualitative source-specificity would have been improved to 80%, while the combined source-sensitivity would only decrease slightly to 74%.
The results of this study are significant in that they suggest that the bacterial populations detected with the ruminant-targeted assays form a dominant and stable portion of the fecal Bacteroidetes communities in ruminant animals sampled all around the world for this study. This indicates strong host-adaptation of this particular population.27−30 The broad distribution of the targeted bacterial subpopulation in the current study might even represent obligatory symbionts in the ruminant digestive system making it an ideal MST target.1 On the other hand, the human associated Bacteroidetes populations present in human feces appear to fluctuate in terms of their abundance relative to total Bacteroidetes and their prevalence. These fluctuations may suggest a lower degree of host adaptation and a less close symbiosis of these bacteria with the human host. It was beyond the scope of this study to investigate the temporal stability of the abundance of the detected markers in human individuals and/or populations. However, one of the major contributing factors responsible for the higher variability in human-associated marker concentrations might be the highly diverse human diet.31,32 It has been shown that the diversity and composition of human intestinal microbiota differs strongly among human populations around the world and is not only influenced by host genotype and diet but also by cultural factors.33 Nevertheless, there might be bacterial clades34 and, alternatively, also viral targets35 in the human intestinal microbiome better suited as MST targets than the ones used in the human assays tested in this study.
High fluctuations of MST target populations (relative to the total intestinal Bacteroidetes population) in target samples can be a strong confounding factor when relating marker concentrations to proposed measures of total fecal pollution in MST applications. When calculating these relations care must be taken to actually investigate the dynamic range of the relative abundance of the used parameters in fecal samples. For instance Figure 3 shows the distribution of the ratio of source-associated marker concentrations to the total fecal marker (AllBac) concentrations, across all transcontinental study locations. What is apparent is that issues of abundance and distribution need to be addressed if the MST marker concentrations are to be related to traditional fecal indicator counts or DNA concentration in the extract. For these reasons the marker concentrations determined in this study were not related to any external parameters but rather reported as unprocessed results from qPCR. It should also be noted that, due to the different DNA extraction procedures used by the various participating laboratories, this study can not and does not report and discuss absolute quantities of the markers in the investigated fecal samples but rather the relative quantitative distributions. It should be noted that this conservative approach makes the interpretation relatively insensitive to effects such as differences in DNA concentrations among the samples and DNA degradation during storage (compare Figures 1 and S5, Figures 2 and S6, Figures S3 and S8, Figures S4 and S7, respectively).
Practical Implications
The findings of this study are significant as they suggest that the ruminant-targeted assays (BacR, BacCow) appear to be suitable for application as quantitative MST tools beyond the regional level. Unfortunately, the source-specificities associated with the human-targeted assays were relatively low with BacHum showing slightly higher specificity than BacH. Therefore, there is a strong need for improved human-targeted MST approaches and the inadequacies of tested assays serve to highlight the importance of this task.
This study set out to investigate one of the basic prerequisites for MST which is source-specificity and -sensitivity in fecal sources. It was beyond the scope of this study to broadly investigate the practical environmental applicability of the tested assays. Issues such as changes in populations structure during waste water disposal and treatment, environmental differential persistence of marker populations, interference by autochthonous communities, and the challenges of source apportionment have been and will be the subject of other investigations. However the assays tested in this study have all already been applied in environmental investigation of fecal pollution in water and have proved their usefulness on the local and regional level.3,21,36−39
Before application in a new study area, marker-based MST assays must be locally validated using a range of fecal samples to assess their diagnostic performance.19 The quantitative data provided by the qPCR detection technology proved to be extremely useful for thorough assessment of assay performance. Future developments of successful qPCR assays are likely to be highly dependent not only on the quality of sequence information from target and nontarget populations but also on state-of-the-art assay design and optimization.
The findings of this study are encouraging as it indicates that globally applicable methods for the molecular detection and characterization of a range of human and nonhuman sources of fecal pollution may well be possible.
Acknowledgments
This investigation was initiated in the course of meetings of the Specialist Group for Health-Related Water Microbiology of the International Water Association (IWA). Our special thanks go to Prof. Joan Rose, founder of the International Collaboratory for Sewage (http://www.cws.msu.edu/ic-sewage/) supporting the interaction between different research groups from different regions and continents. This study was financed by the Austrian Science Fund (FWF) Translational project TRP L414-B03 and the FWF project P22309 granted to Andreas Farnleitner and the FWF DKplus “Vienna Doctoral Programme on Water Resource Systems” (W1219-N22) granted to Günter Blöschl and Andreas Farnleitner. Further support came from the FWF project P22032 granted to Georg Reischer. Georg Reischer is a recipient of an APART Fellowship of the Austrian Academy of Sciences. This study is a joint publication of the Interuniversity Cooperation Center Water & Health (www.waterandhealth.at).
Supporting Information Available
Supporting Information contains Tables S1 and S2 and Figures S1, S2, S3, S4a–d, S5, S6a–e, S7a–d, and S8 as referenced in text. This material is available free of charge via the Internet at http://pubs.acs.org.
The authors declare no competing financial interest.
Supplementary Material
References
- Santo Domingo J. W.; Bambic D. G.; Edge T. A.; Wuertz S. Quo vadis source tracking? Towards a strategic framework for environmental monitoring of fecal pollution. Water Res. 2007, 41163539–3552. [DOI] [PubMed] [Google Scholar]
- Hagedorn C.; Harwood V. J.; Blanch A.. Microbial Source Tracking: Methods, Applications, and Case Studies; Springer: New York, 2011; p 642. [Google Scholar]
- Wuertz S.; Wang D.; Reischer G. H.; Farnleitner A. H., Library-Independent Source Tracking Methods. In Microbial Source Tracking: Methods, Applications, and Case Studies; Hagedorn C., Blanch A. R., Harwood V. J., Eds.; Springer: New York, 2011; pp 61–113. [Google Scholar]
- Roslev P.; Bukh A. S. State of the art molecular markers for fecal pollution source tracking in water. Appl. Microbiol. Biotechnol. 2011, 8951341–1355. [DOI] [PubMed] [Google Scholar]
- Ley R. E.; Backhed F.; Turnbaugh P.; Lozupone C. A.; Knight R. D.; Gordon J. I. Obesity alters gut microbial ecology. Proc. Natl. Acad. Sci. U.S.A. 2005, 1023111070–11075. [DOI] [PMC free article] [PubMed] [Google Scholar]
- Ley R. E.; Knight R.; Gordon J. I. The human microbiome: eliminating the biomedical/environmental dichotomy in microbial ecology. Environ. Microbiol. 2007, 913–4. [DOI] [PubMed] [Google Scholar]
- Dethlefsen L.; McFall-Ngai M.; Relman D. A. An ecological and evolutionary perspective on human-microbe mutualism and disease. Nature 2007, 4497164811–818. [DOI] [PMC free article] [PubMed] [Google Scholar]
- Dick L. K.; Field K. G. Rapid estimation of numbers of fecal Bacteroidetes by use of a quantitative PCR assay for 16S rRNA genes. Appl. Environ. Microbiol. 2004, 7095695–7. [DOI] [PMC free article] [PubMed] [Google Scholar]
- Layton A.; McKay L.; Williams D.; Garrett V.; Gentry R.; Sayler G. Development of Bacteroides 16S rRNA gene TaqMan-based real-time PCR assays for estimation of total, human, and bovine fecal pollution in water. Appl. Environ. Microbiol. 2006, 7264214–24. [DOI] [PMC free article] [PubMed] [Google Scholar]
- Kildare B. J.; Leutenegger C. M.; McSwain B. S.; Bambic D. G.; Rajal V. B.; Wuertz S. 16S rRNA-based assays for quantitative detection of universal, human-, cow-, and dog-specific fecal Bacteroidales: A Bayesian approach. Water Res. 2007, 41163701–3715. [DOI] [PubMed] [Google Scholar]
- Shanks O. C.; White K.; Kelty C. A.; Hayes S.; Sivaganesan M.; Jenkins M.; Varma M.; Haugland R. A. Performance assessment PCR-based assays targeting Bacteroidales genetic markers of bovine fecal pollution. Appl. Environ. Microbiol. 2010, 7651359–1366. [DOI] [PMC free article] [PubMed] [Google Scholar]
- Shanks O. C.; White K.; Kelty C. A.; Sivaganesan M.; Blannon J.; Meckes M.; Varma M.; Haugland R. A. Performance of PCR-based assays targeting Bacteroidales Genetic markers of human fecal pollution in sewage and fecal samples. Environ. Sci. Technol. 2010, 44166281–6288. [DOI] [PubMed] [Google Scholar]
- Lamendella R.; Domingo J. W. S.; Yannarell A. C.; Ghosh S.; Di Giovanni G.; Mackie R. I.; Oerther D. B. Evaluation of swine-specific PCR assays used for fecal source tracking and analysis of molecular diversity of swine-specific ″Bacteroidales″ populations. Appl. Environ. Microbiol. 2009, 75185787–5796. [DOI] [PMC free article] [PubMed] [Google Scholar]
- Ahmed W.; Goonetilleke A.; Powell D.; Gardner T. Evaluation of multiple sewage-associated Bacteroides PCR markers for sewage pollution tracking. Water Res. 2009, 43194872–4877. [DOI] [PubMed] [Google Scholar]
- Reischer G. H.; Kasper D. C.; Steinborn R.; Farnleitner A. H.; Mach R. L. A quantitative real-time PCR assay for the highly sensitive and specific detection of human faecal influence in spring water from a large alpine catchment area. Lett. Appl. Microbiol. 2007, 444351–356. [DOI] [PMC free article] [PubMed] [Google Scholar]
- Reischer G. H.; Kasper D. C.; Steinborn R.; Mach R. L.; Farnleitner A. H. Quantitative PCR method for sensitive detection of ruminant fecal pollution in freshwater and evaluation of this method in alpine karstic regions. Appl. Environ. Microbiol. 2006, 7285610–4. [DOI] [PMC free article] [PubMed] [Google Scholar]
- Reischer G. H.; Kasper D. C.; Steinborn R.; Farnleitner A. H.; Mach R. L. A quantitative real-time PCR assay for the highly sensitive and specific detection of human faecal influence in spring water from a large alpine catchment area. Lett. Appl. Microbiol. 2007, 444351–356. [DOI] [PMC free article] [PubMed] [Google Scholar]
- Bustin S. A.; Benes V.; Garson J. A.; Hellemans J.; Huggett J.; Kubista M.; Mueller R.; Nolan T.; Pfaffl M. W.; Shipley G. L.; Vandesompele J.; Wittwer C. T. The MIQE guidelines: Minimum Information for publication of quantitative real-time PCR experiments. Clin. Chem. 2009, 554611–622. [DOI] [PubMed] [Google Scholar]
- Harwood V. J.; Stoeckel D. M.. Performance Criteria. In Microbial Source Tracking: Methods, Applications, and Case Studies; Hagedorn C., Blanch A. R., Harwood V. J., Eds.; Springer: New York, 2011; pp 7–30. [Google Scholar]
- Belanche L. A.; Blanch A.. Statistical Approaches for Modeling in Microbial Source Tracking. In Microbial Source Tracking: Methods, Applications, and Case Studies; Hagedorn C., Blanch A. R., Harwood V. J., Eds.; Springer: New York, 2011; pp 207–227. [Google Scholar]
- Reischer G. H.; Kollanur D.; Vierheilig J.; Wehrspaun C.; Mach R. L.; Sommer R.; Stadler H.; Farnleitner A. H. Hypothesis-Driven approach for the identification of fecal pollution sources in water resources. Environ. Sci. Technol. 2011, 4594038–4045. [DOI] [PMC free article] [PubMed] [Google Scholar]
- Bloschl G.; Sivapalan M. Scale issues in hydrological modeling - a review. Hydrol. Processes 1995, 93–4251–290. [Google Scholar]
- Vierheilig J.; Farnleitner A. H.; Kollanur D.; Bloschl G.; Reischer G. H. High abundance of genetic Bacteroidetes markers for total fecal pollution in pristine alpine soils suggests lack in specificity for feces. J. Microbiol. Methods 2012, 883433–5. [DOI] [PMC free article] [PubMed] [Google Scholar]
- van der Wielen P. W. J. J.; Medema G. Unsuitability of quantitative Bacteroidales 16S rRNA gene assays for discerning fecal contamination of drinking water. Appl. Environ. Microbiol. 2010, 76144876–4881. [DOI] [PMC free article] [PubMed] [Google Scholar]
- Jeong J. Y.; Park H. D.; Lee K. H.; Hwang J. H.; Ka J. O. Quantitative analysis of human- and cow-specific 16S rRNA gene markers for assessment of fecal pollution in river waters by real-time PCR. J. Microbiol. Biotechnol. 2010, 202245–253. [PubMed] [Google Scholar]
- Shanks O. C.; Atikovic E.; Blackwood A. D.; Lu J. R.; Noble R. T.; Domingo J. S.; Seifring S.; Sivaganesan M.; Haugland R. A. Quantitative PCR for detection and enumeration of genetic markers of bovine fecal pollution. Appl. Environ. Microbiol. 2008, 743745–752. [DOI] [PMC free article] [PubMed] [Google Scholar]
- Shanks O. C.; Kelty C. A.; Archibeque S.; Jenkins M.; Newton R. J.; McLellan S. L.; Huse S. M.; Sogin M. L. Community structures of fecal bacteria in cattle from different animal feeding operations. Appl. Environ. Microbiol. 2011, 7792992–3001. [DOI] [PMC free article] [PubMed] [Google Scholar]
- Ley R. E.; Hamady M.; Lozupone C.; Turnbaugh P. J.; Ramey R. R.; Bircher J. S.; Schlegel M. L.; Tucker T. A.; Schrenzel M. D.; Knight R.; Gordon J. I. Evolution of mammals and their gut microbes. Science 2008, 32058831647–1651. [DOI] [PMC free article] [PubMed] [Google Scholar]
- Ley R. E.; Lozupone C. A.; Hamady M.; Knight R.; Gordon J. I. Worlds within worlds: evolution of the vertebrate gut microbiota. Nat. Rev. Microbiol. 2008, 610776–788. [DOI] [PMC free article] [PubMed] [Google Scholar]
- Dowd S. E.; Callaway T. R.; Wolcott R. D.; Sun Y.; McKeehan T.; Hagevoort R. G.; Edrington T. S.. Evaluation of the bacterial diversity in the feces of cattle using 16S rDNA bacterial tag-encoded FLX amplicon pyrosequencing (bTEFAP). BMC Microbiol. 2008, 8, (e125), -. [DOI] [PMC free article] [PubMed] [Google Scholar]
- Zimmer J.; Lange B.; Frick J. S.; Sauer H.; Zimmermann K.; Schwiertz A.; Rusch K.; Klosterhalfen S.; Enck P. A vegan or vegetarian diet substantially alters the human colonic faecal microbiota. Eur. J. Clin. Nutr. 2012, 66153–60. [DOI] [PubMed] [Google Scholar]
- Muegge B. D.; Kuczynski J.; Knights D.; Clemente J. C.; Gonzalez A.; Fontana L.; Henrissat B.; Knight R.; Gordon J. I. Diet drives convergence in gut microbiome functions across mammalian phylogeny and within humans. Science 2011, 3326032970–974. [DOI] [PMC free article] [PubMed] [Google Scholar]
- Yatsunenko T.; Rey F. E.; Manary M. J.; Trehan I.; Dominguez-Bello M. G.; Contreras M.; Magris M.; Hidalgo G.; Baldassano R. N.; Anokhin A. P.; Heath A. C.; Warner B.; Reeder J.; Kuczynski J.; Caporaso J. G.; Lozupone C. A.; Lauber C.; Clemente J. C.; Knights D.; Knight R.; Gordon J. I. Human gut microbiome viewed across age and geography. Nature 2012, 4867402222–227. [DOI] [PMC free article] [PubMed] [Google Scholar]
- Newton R. J.; VandeWalle J. L.; Borchardt M. A.; Gorelick M. H.; McLellan S. L. Lachnospiraceae and Bacteroidales alternative fecal indicators reveal chronic human sewage contamination in an urban harbor. Appl. Environ. Microbiol. 2011, 77196972–6981. [DOI] [PMC free article] [PubMed] [Google Scholar]
- McQuaig S. M.; Noble R. T.. Viruses as Tracers of Fecal Contamination. In Microbial Source Tracking: Methods, Applications, and Case Studies; Hagedorn C., Blanch A. R., Harwood V. J., Eds.; Springer: New York, 2011; pp 61–113. [Google Scholar]
- Farnleitner A. H.; Reischer G. H.; Stadler H.; Kollanur D.; Sommer R.; Zerobin W.; Barella M.; Truesdale J. A.; Casarez E. A.; Di Giovanni G. D.. Agricultural and Rural Watersheds. In Microbial Source Tracking: Methods, Applications, and Case Studies; Hagedorn C., Blanch A. R., Harwood V. J., Eds.; Springer: New York, 2011; pp 399–433. [Google Scholar]
- Bell A.; Layton A. C.; Mckay L.; Williams D.; Gentry R.; Sayler G. S. Factors influencing the persistence of fecal bacteroides in stream water. J. Environ. Qual. 2009, 3831224–1232. [DOI] [PubMed] [Google Scholar]
- Reischer G. H.; Haider J. M.; Sommer R.; Stadler H.; Keiblinger K. M.; Hornek R.; Zerobin W.; Mach R. L.; Farnleitner A. H. Quantitative microbial faecal source tracking with sampling guided by hydrological catchment dynamics. Environ. Microbiol. 2008, 10102598–2608. [DOI] [PMC free article] [PubMed] [Google Scholar]
- Reischer G. H.; Kavka G. G.; Kasper D. C.; Winter C.; Mach R. L.; Farnleitner A. H. Applicability of DNA based quantitative microbial source tracking (QMST) evaluated on a large scale in the Danube River and its important tributaries. Fundam. Appl. Limnol./Arch. Hydrobiol. Suppl. 2008, 1661–2117–125. [Google Scholar]
Associated Data
This section collects any data citations, data availability statements, or supplementary materials included in this article.