Abstract
Background:
The semi-quantitative analysis of the time–intensity curves in dynamic contrast-enhanced magnetic resonance imaging (DCE-MRI) has a limited specificity due to overlapping enhancement patterns after gadolinium administration. With the advances in technology and faster sequences, imaging of the entire breast can be done in a few seconds, which allows measuring the transit of contrast (transfer constant: Ktrans) through the vascular bed at capillary level that reflects quantitative measure of porosity/permeability of tumor vessels.
Aim:
Our study aims to evaluate the pharmacokinetic parameter Ktrans for enhancing breast lesions and correlate it with histopathology, and assess accuracy, sensitivity, and specificity of this parameter in discriminating benign and malignant breast lesions.
Materials and Methods:
One hundred and fifty-one women with 216 histologically proved enhancing breast lesions underwent high temporal resolution DCE-MRI for the early dynamic analysis for calculation of pharmacokinetic parameters (Ktrans) using standard two compartment model. The calculated values of Ktrans were correlated with histopathology to calculate the sensitivity, specificity, and accuracy.
Results:
Receiver operating characteristic (ROC) curve analysis revealed a mean Ktrans value of 0.56, which reliably distinguished benign and malignant breast lesions with a sensitivity of 91.1% and specificity of 90.3% with an overall accuracy of 89.3%. The area under curve (AUC) was 0.907.
Conclusion:
Ktrans is a reliable quantitative parameter for characterizing benign and malignant lesions in routine DCE-MRI of breasts.
Keywords: Breast lesions, dynamic contrast-enhanced magnetic resonance imaging, Ktrans
Introduction
Dynamic contrast-enhanced magnetic resonance imaging (DCE-MRI) is being increasingly used for evaluating the breasts because of its high sensitivity to detect breast cancer. DCE-MRI of the breast enables the depiction of the physiological and morphological characteristics of the enhancing breast lesions wherein by observing the uptake and washout of MRI contrast agents in a breast lesion, combined with the pattern of enhancement, the malignant and benign disease can be discriminated.[1] Nevertheless, the specificity of MRI remains equivocal[2] as both benign and malignant breast lesions enhance with overlapping enhancement patterns which is the major determinant in the characterization of breast lesions in routine DCE-MRI. Major area of clinical research aims at increasing the specificity of MRI for differentiating benign and malignant breast lesions.
Quantitative analysis of DCE-MRI is possible with the advances in technology and faster sequences, wherein high temporal resolution images of the entire breast can be taken in few seconds that allows measuring the transit of contrast (transfer constant: Ktrans) through the vascular bed at capillary level, a parameter that reflects quantitative measure of qualitative changes, i.e., increased porosity/permeability of tumor vessels, a surrogate of neoangiogenesis. Benign and malignant breast lesions differ in the characteristics of their microvessels, and hence the behaviors of Gd (Gadolinium) uptake in the lesion which can be measured with the pharmacokinetic parameters of vascular permeability.
The aim of this study was to evaluate the pharmacokinetic parameter, Ktrans, for enhancing breast lesions and correlate it with histopathology and assess accuracy, sensitivity, and specificity of this parameter in discriminating benign and malignant breast lesions.
Materials and Methods
Patient population
This was a prospective study approved by the institutional review board. Seven hundred and thirty-six women with suspected breast lesions were referred during the period of June 2010–December 2011 and 235 of them underwent both high temporal resolution and high spatial resolution DCE-MRI of the breasts. Of these, 151 women with 216 histologically proved enhancing breast lesions formed the material of this study.
MR imaging protocol
All patients underwent DCE-MRI using 1.5 T scanner (Avanto Siemens, Erlangen, Germany) with a double (4-channel) breast coil. Besides the routine high spatial resolution DCE-MRI of bilateral breasts (1 min temporal and 0.9 mm spatial resolution), non–fat-suppressed T1-weighted images (VIBE: Volume interpolated body examination) with high temporal resolution (4 sec) were used for the early dynamic analysis and pharmacokinetic study. Both breasts were imaged in an axial plane using VIBE (TE (time to echo) 1.54, TR (Repetition time) 3.53, FOV (field of view) 320, slices 24, image resolution 3.9 mm × 1.3 mm × 4.0 mm) with 2° and 15° flip angle for calculation of native T1, followed by post-contrast VIBE with 15° flip angle during an intravenous bolus of Gd-DTPA (diethylenetriamine pentaacetic acid) [0.1 mmol of gadodiamide (Omniscan)/kg of body weight] with the help of a pressure injector (Tyco, Mansfield, USA) at a rate of 2 ml/sec, followed by a 20-ml saline flush, and sequentially acquired for over 14 consecutive time points with a total acquisition time of 56 sec. The protocol of DCE-MRI is depicted in Figure 1. In this study, we have evaluated only the early dynamic data for calculation of the pharmacokinetic parameters and correlated with histopathology.
Figure 1.
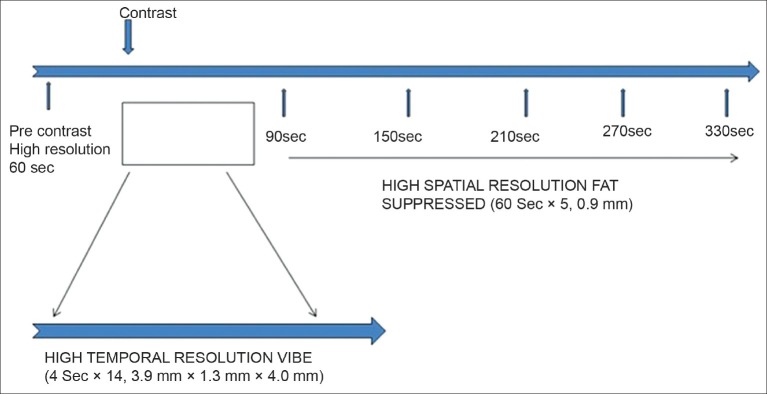
Diagrammatic representation of the DCE-MRI protocol (both high temporal and high spatial resolution)
Post-acquisition image processing
For evaluation of the pharmacokinetic parameters, the early dynamic data series comprising the high temporal resolution, non–fat-suppressed T1-weighted pre- and post-contrast VIBE series acquired at 15° flip angle and pre-contrast VIBE at 2° flip angle were separated and analysis was done with an in-house developed software. The high spatial resolution dynamic series was acquired for each patient, but was excluded from the evaluation. The first minute subtraction images from the high spatial resolution series were nevertheless used to identify all enhancing lesions to evaluate if any lesion was missed on the high temporal resolution series.
The prerequisites for pharmacokinetic evaluation were: Registration of serial pre- and post-contrast series prior to generating subtracted images for identifying any enhancing lesion, calculation of arterial input function, and calculating the native T1 needed for the evaluation of gadolinium concentration in plasma and tissues, respectively, for calculation of Ktrans.
We used 3D affine registration and deformable registration method[3] to correctly register each voxel in the pre- and post-contrast VIBE sequences and obtain subtracted images to identify the enhancing lesion. This was done to counter the motion artifact which may cause blurring in the image and subsequent noise in the time–intensity curve, leading to difficulty in tracking the true intensity behavior of each voxel with time, in the region of interest (ROI), after injecting contrast.
The time–intensity curve obtained from the discrete time–intensity points was smoothened to fit into a best fitted curve using “least square approximation method with spline functions”.[4]
To calculate the contrast concentration in the plasma, in our study, a model Arterial Input Function (AIF) was calculated with the ROI placed over the aorta from a sub-population of random 60 women who underwent DCE-MRI of breasts. The mean value was taken as constant to limit inconsistencies in the measured AIF of individual cases due to flow-related artifacts in the vessel.
Furthermore, the intrinsic T1 relaxation time (T10) of tissue before and after Gd contrast, which is a major determinant in the computation of contrast concentration in tissue (Cgd tissue), was normalized with the help of a prefilled phantom (with known contrast content and T1 relaxation time) imaged along with the patient during the study. Calculation of pharmacokinetic parameters like Ktrans, Kep, and Ve was done using the following formulae:
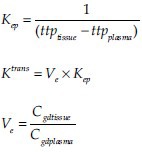
where Cgd tissue is the concentration of contrast in the tissue, Cgd plasma, the concentration of contrast in the plasma, ttptissue the time to reach the peak intensity value in the tissue, and ttpplasma is the time to reach the peak intensity in the plasma in the time-intensity graph for tissue and plasma, respectively.[5]
A parametric map of voxel-wise Ktrans values was generated as a color overlay.
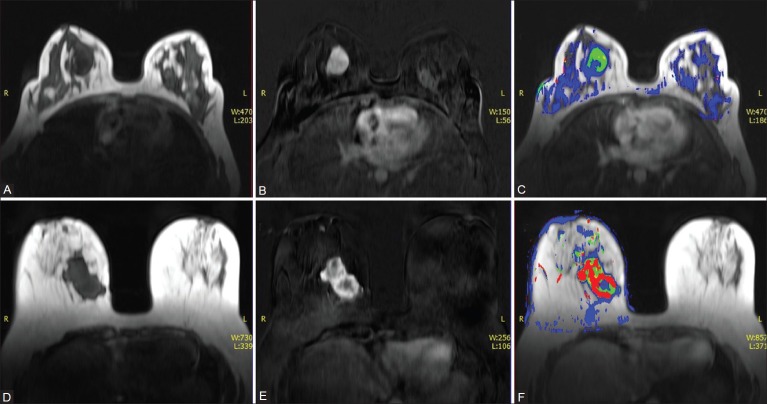
Figure 2 depicts the Ktrans parametric map for complete evaluation of a malignant and benign breast lesion.
Figure 2 (A-F).
A 36-year-old female with lump in right breast. Axial non–fat-suppressed pre-contrast VIBE image (A) and subtracted VIBE image (B) reveal an enhancing mass in the right breast. (C) Color overlay images for the Ktrans value of the right breast lesion reveal low values suggestive of a benign lesion. HPE: Fibroadenoma. Axial non–fat-suppressed pre-contrast VIBE image (D) and subtracted VIBE image (E) reveal an irregular enhancing mass in the right breast. (F) Color overlay images for the Ktrans value of the right breast lesion reveal high values suggestive of a malignant lesion. HPE: IDC
ROI was manually placed including the entire enhancing area within the lesion identified on the subtracted image from the high temporal resolution series which is presumably active and suspicious and copied on the parametric map to calculate the pharmacokinetic parameter. This was done to overcome the effects of tumor heterogeneity due to necrosis, bleed, and edema within the tissue of interest in the computation accuracy of pharmacokinetic parameters [Figure 3].
Figure 3 (A-D).
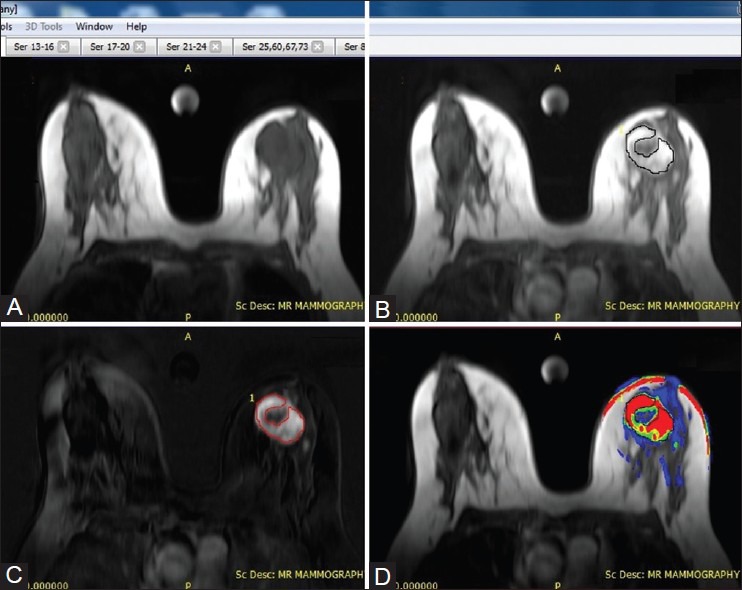
Methodology for placement of ROI on enhancing breast lesion. Pre-contrast axial non–fat-suppressed VIBE (A) image post-contrast axial non–fat-suppressed VIBE image (B), and subtracted VIBE image (C) delineating an enhancing lesion in the left breast (D) Color overlay image for the left breast lesion reveals high Ktrans value suggestive of malignancy. Manual ROI was placed on the subtracted VIBE image to include the entire enhancing component excluding the central non-enhancing area of necrosis and copied onto the color overlay image
The calculated Ktrans, Ve, and KeP values were correlated with the histopathology obtained by fine needle aspiration cytology (FNAC)/biopsy/surgery. Receiver operating characteristic (ROC) curve analysis was done using logistic regression analysis to calculate a cut-off value (threshold) for the Ktrans, Ve, and Kep, and was used in the calculation of area under curve (AUC). Sensitivity, specificity, accuracy, positive predictive value (PPV), and negative predictive value (NPV) of these pharmacokinetic parameters were obtained, and independent samples t-test was done for finding out the mean and 95% confidence interval (CI) for malignant and benign lesions.
Results
Demographic data
One hundred and fifty-one women with 216 lesions were enrolled in the study, with a mean age of 47 years (age range: 23-77 years). The age wise distribution is depicted in Table 1.
Table 1.
Age wise distribution of patients (n=151)

A total of 216 lesions were evaluated of which 93 were benign and 123 were malignant. One hundred and ninety-five were masses and 21 were non-mass enhancements. The results for the mean Ktrans values for benign and malignant lesions are summarized in Table 2.
Table 2.
Mean size and Ktrans values for mass and non-mass enhancements of malignant and benign lesions
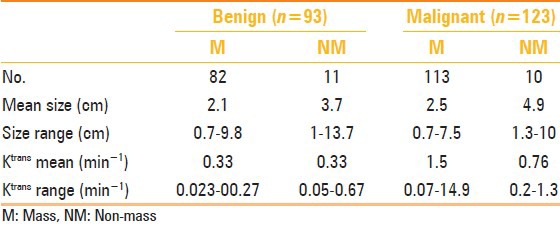
The average size of the malignant lesions was 2.7 cm (range: 0.5-10 cm, median: 2.5 cm). Six lesions were <1 cm. The mean Ktrans value for malignant lesions was 1.45, for the masses was 1.5 (range: 0.07-14.9), and for the non-mass enhancements was 0.76 (range: 0.2-1.3). With a cut-off value of 0.56/min for the Ktrans, there were 12 false-negative lesions of which 11 were masses with an average size of 1.3 cm (range: 0.7-3.2) and 1 was a non-mass lesion measuring 1.3 cm. Seven of these false-negative lesions were invasive ductal carcinomas, two were ductal carcinoma in situ (DCIS), two were invasive lobular carcinoma, and one was a mucinous carcinoma. All malignant lesions (n = 6) measuring <1 cm were false negative on Ktrans.
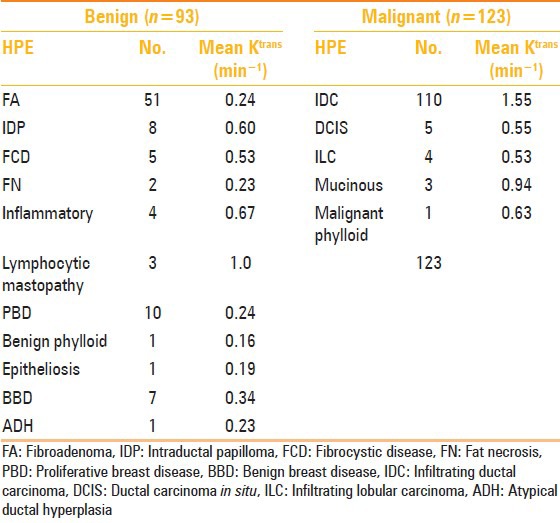
There were five lesions of DCIS with an average size of 4.6 cm (range: 0.7-10 cm, median: 3.9 cm) and a mean Ktrans value of 0.55 (range: 0.35-0.74). The two false-negative lesions with lower mean Ktrans value were <1 cm. There were four lesions of invasive lobular carcinoma with an average size of 1.8 cm (range: 1.3-3.2 cm) and a mean Ktrans value of 0.53 (range: 0.08-1.23). Three lesions were mucinous carcinoma with Ktrans values 0.15, 1.56, and 1.12, and a mean value of 0.94.
The average size of the benign lesions was 2.3 cm (range: 0.7-13.7 cm, median: 1.9 cm). Nine lesions were <1 cm. Eighty-two were masses with an average size of 2.1 cm (range: 0.7-9.8 cm, median 1.8 cm) and 11 were non-mass enhancements with an average size of 3.7 cm (range: 1.0-13.7 cm, median: 3 cm). The mean Ktrans value for benign masses and non-mass enhancements was 0.33 (range for masses was 0.023-2.7 and for the non-mass enhancements was 0.05-0.67). With a cut-off value of 0.56 for the Ktrans, there were 11 false-positive lesions of which 8 were masses with an average size of 2.2 cm (range: 0.8-3.6) and 3 were non-mass enhancements (1.8 cm, 3 cm, and 13.7 cm). Three of these false-positive lesions were fibrocystic disease, three were inflammatory, two were ductal papillomas, one was a benign breast disease, and two were lymphocytic mastopathy.
A single case of atypical ductal hyperplasia revealed a lower Ktrans value of 0.23.
The histopathologic type of the benign and malignant breast lesions and their mean Ktrans value are summarized in Table 3.
Table 3.
Histological composition of benign and malignant breast lesions and their mean Ktrans values
ROC curve analysis revealed a mean Ktrans value of 0.56, which reliably distinguished benign and malignant breast lesions with a sensitivity of 91.1% and specificity of 90.3% with an overall accuracy of 89.3%. The AUC was 0.907 [Figure 4].
Figure 4.
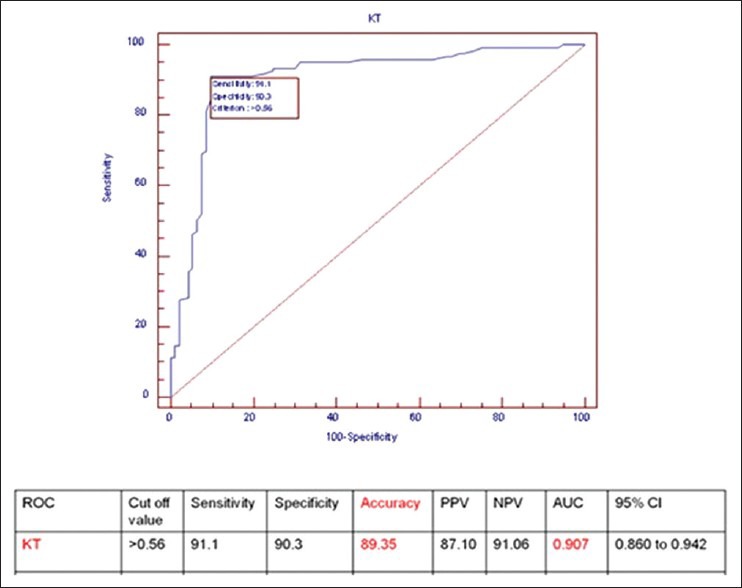
Results of statistical analysis and ROC curve for Ktrans with a cut-off value of 0.56/min (n = 216)
Separate ROC curve analysis was done for lesions > 1 cm (n = 201), taking a cut-off value of 0.56 for Ktrans, which revealed a sensitivity of 94.9% and specificity of 90.5% with an overall accuracy of 91.54% for distinguishing benign and malignant breast lesions. The AUC was 0.923 and the NPV improved from 91.06 to 94.87% [Figure 5].
Figure 5.
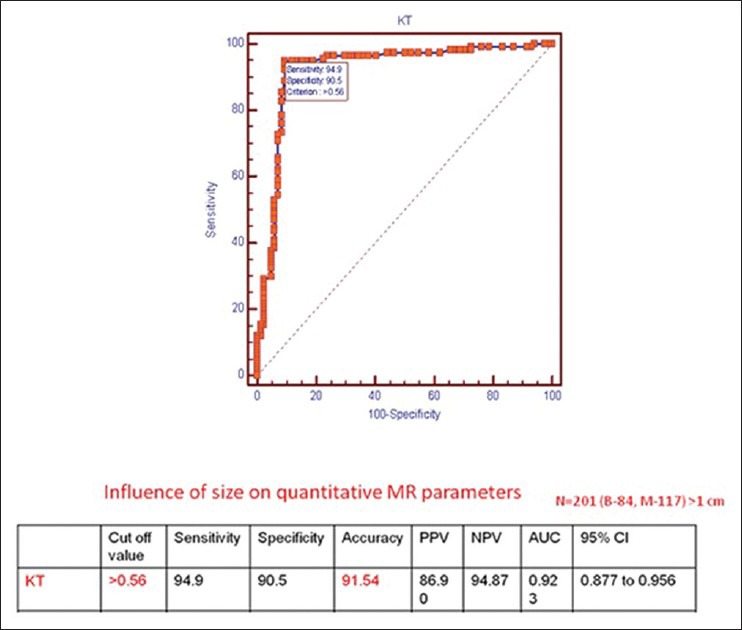
Results of statistical analysis and ROC curve for Ktrans for lesions >1 cm in size with a cut-off value of 0.56/min (n = 201)
The t-test showed the distribution of mean Ktrans value in benign (0.3346) and malignant (1.4574) lesions, with range of values (0.2641-0.4074) for benign and (1.0894-1.8294) for malignant lying within 95% CI, respectively, as depicted in Table 4.
Table 4.
t test for benign and malignant breast lesions

With a threshold value of 0.2 for Ve, an accuracy 81.48% and AUC of 0.893 were obtained. Results of Ktrans, Ve, and Kep are depicted in Table 5.
Table 5.
Results of the statistical analysis for the pharmacokinetic parameters

Discussion
The semi-quantitative analysis of the time–intensity curves in DCE-MRI of the breast routinely used for clinical evaluation of enhancing breast lesions has a limited specificity in various published data series and false positivity demanding unnecessary interventions and simultaneously raising anxiety in the women. Quantitative analysis of DCE-MRI using a pharmacokinetic model and the role of various parameters (Ktrans, Kep, and Ve) is the area of ongoing research which endeavors to modulate ways so that the dilemma of differentiating benign and malignant lesions can be tackled in a noninvasive manner. The pharmacokinetic analysis of DCE-MRI in the assessment of the microcirulatory properties of breast cancer has been reported.[6,7]
The pharmacokinetic modeling technique used in our study was that of standard two compartmental model (SM) comprising plasma and the extravascular extracellular space as proposed by Tofts.[5] The coefficient of transendothelial transport of Gd from vascular compartment to tissue interstitium is referred to as Ktrans (min−1) and is an indicator of both flow and permeability properties of the tissue with a high Ktrans value reflecting both high perfusion and high permeability. Similarly, the reverse transport of Gd back into the vascular space (washout) is Kep (rate constant) and Ve is the extracellular extravascular volume (interstitial space, leakage space). The Ktrans and Kep, therefore, represent the process of Gd-DTPA transfer across the capillary wall, and hence is a surrogate of capillary permeability.
The physiological basis of this model in breast cancer is “neoangiogenesis” wherein myriads of tiny leaky vessels develop around the tumor tissue to supply the increased demand of blood and nutrients to sustain its aggressive growth. Benign and malignant breast lesions differ in the characteristics of their microvessels, and hence in the behavior of Gd within the lesion which can be measured with the pharmacokinetic parameters of vascular permeability. Rapid sequential imaging of the breast with high temporal resolution after gadolinium administration renders gadolinium concentration curves in the tissue over a period of time, which are used to calculate the pharmacokinetic parameters.
Sardenelli et al.[8] in their study of 63 breast lesions have concluded that the first minute of gadolinium enhancement allows a more prominent differentiation between benign and malignant breast lesions than following it up to 8 min.
Furman et al.[9] in their study of 141 lesions have found Ktrans to be the best distinguishing parameter and have concluded that the quantitative evaluation of the perfusion parameters should be able to improve the breast cancer diagnosis on MRI. However, their results were derived from high spatial and low temporal resolution images of 2 min.
In a study conducted by Veltman et al.[10] involving the evaluation of the pharmacokinetic parameters (Ktrans, Ve, and Kep) derived from fast dynamic imaging for characterizing 102 benign and malignant breast lesions, the authors have found an AUC of 0.82 for Ktrans and 0.83 for combined pharmacokinetic parameters. However, they have concluded that combining the slow dynamic analysis (according to BIRADS classification of the lesion) and fast dynamic analysis (pharmacokinetic analysis) significantly improved the diagnostic performance of breast MRI. In our series, we have acquired the high temporal resolution data over a period of 56 sec (~1 min) unlike 90 sec as reported in the study by Veltman et al.[10] and also we have not included the routine high spatial resolution series in the analysis.
We have found that with a threshold mean Ktrans value of 0.56, a reliable differentiation of benign and malignant lesions could be achieved with an accuracy of 89.3% and an AUC of 0.907.
In our study, we have also tried to improve the accuracy of the calculation of the pharmacokinetic parameters by adopting certain methods like image registration to minimize the effects of motion on the voxel tracking on the temporal data series.
In literature, “hot spot” and “whole tumor” methods for ROI placement have been described. Liney et al.[11] have stressed on the importance of consistent ROI placement for evaluations. Theoretically, whole tumor ROI may have effects of the intralesional necrosis and hemorrhage in rim enhancing lesions and hot spot method may not include the entire enhancing area in calculation. Veltmen et al.10 have used the hot spot method for placing the ROI wherein the areas having the maximum Ktrans, Kep, and Ve values were identified from the parametric map images. We have tried to reduce the effects of partial volume due to intralesional necrosis and hemorrhage on the calculation by placing the ROI on the entire enhancing area only, identified in the subtracted VIBE images, and copying the ROI on the parametric image for calculation of mean Ktrans. We presume that this method of ROI placement should yield better results.
We have also calculated a normalized corrected intrinsic T1 value using a phantom as described in the “Materials and Methods” section to minimize the effects of the machine parameters which may affect computation of pharmacokinetic parameters.
ROC curve analysis for lesions >1 cm in size revealed an improved accuracy of 91.54% as compared to 89.3%. Gibbs et al.12 have reported diagnostic accuracy of 74% (0.74 ± 0.08) for exchange rate constant in the evaluation of subcentimeter size breast lesions in 43 women. There were in 15 subcentimeter lesions (6 malignant and 9 benign) identified on high temporal resolution series in our study, and we did not find any consistency in the results. Moreover, 12 subcentimeter lesions which were identified on the subtracted image of high spatial resolution series were not identified on the high temporal resolution series. Hence, the reliability for detection as well as characterization of subcentimeter lesions in early dynamic analysis with inherent poor spatial resolution remains questionable. Further studies are needed before the high spatial resolution images could be entirely excluded from the protocol for purpose of breast cancer screening.
Conclusion
Our study concludes that early dynamic study can be included in routine DCE-MRI protocol to derive a reliable quantitative parameter (transfer constant, Ktrans) for better characterization of benign and malignant breast lesions.
Acknowledgment
The study was funded by Department of Science and Technology, Government of India, No. IDP/MED/01/2009 (General) dated 22.01.2010. We thank Mr. Pradeep Negi for his help in data compilation in the study.
Footnotes
Source of Support: Nil
Conflict of Interest: None declared.
References
- 1.Schnall MD, Blume J, Bluemke DA, DeAngelis GA, DeBruhl N, Harms S, et al. Diagnostic architectural and dynamic features at breast MR imaging: Multicenter study. Radiology. 2006;238:42–53. doi: 10.1148/radiol.2381042117. [DOI] [PubMed] [Google Scholar]
- 2.Boetes C, Barentsz JO, Mus RD, Van Der Sluis RF, van Erning LJ, Hendriks JH, et al. MR characterization of suspicious breast lesions with a gadolinium enhanced TurboFLASH subtraction technique. Radiology. 1994;193:777–81. doi: 10.1148/radiology.193.3.7972823. [DOI] [PubMed] [Google Scholar]
- 3.Rueckert D, Sonoda LI, Hayes C, Hill DL, Leach MO, Hawkes DJ. Non-rigid registration using free-form deformations: Application to breast MR images. Med Imaging IEEE Trans. 1999;18:712–21. doi: 10.1109/42.796284. [DOI] [PubMed] [Google Scholar]
- 4.Thijsse BJ, Hollanders MA, Hendriksed J. A practical algorithm for least-squares spline approximation of data containing noise. Computers Physics. 1998;12:4. [Google Scholar]
- 5.Tofts PS, Brix G, Buckley DL, Evelhoch JL, Henderson E, Knopp MV, et al. Estimating kinetic parameters from dynamic contrast-enhanced T(1)-weighted MRI of a diffusable tracer: Standardized quantities and symbols. J Magn Reson Imaging. 1999;10:223–32. doi: 10.1002/(sici)1522-2586(199909)10:3<223::aid-jmri2>3.0.co;2-s. [DOI] [PubMed] [Google Scholar]
- 6.Hoffmann U, Brix G, Knopp MV, Hess T, Lorenz WJ. Pharmacokinetic mapping of the breast: A new method for dynamic MR mammography. Magn Reson Med. 1995;33:506–14. doi: 10.1002/mrm.1910330408. [DOI] [PubMed] [Google Scholar]
- 7.Port RE, Knopp MV, Hoffmann U, Milker-Zabel S, Brix G. Multicompartment analysis of gadolinium chelate kinetics: Blood-tissue exchange in mammary tumors as monitored by dynamic MR imaging. J Magn Reson Imaging. 1999;10:233–41. doi: 10.1002/(sici)1522-2586(199909)10:3<233::aid-jmri3>3.0.co;2-m. [DOI] [PubMed] [Google Scholar]
- 8.Sardanelli F, Rescinito G, Giordano GD, Calabrese M, Parodi RC. MR dynamic enhancement of breast lesions: High temporal resolution during the first-minute versus eight-minute study. J Comput Assist Tomogr. 2000;24:724–31. doi: 10.1097/00004728-200009000-00011. [DOI] [PubMed] [Google Scholar]
- 9.Furman-Haran E, Schechtman E, Kelcz F, Kirshenbaum K, Degani H. Magnetic resonance imaging reveals functional diversity of the vasculature in benign and malignant breast lesions. Cancer. 2005;104:708–18. doi: 10.1002/cncr.21225. [DOI] [PubMed] [Google Scholar]
- 10.Veltman J, Stoutjesdijk M, Mcann R, Huisman HJ, Barentsz JO, Blickman JG, et al. Contrast-enhanced magnetic resonance imaging of the breast: The value of pharmacokinetic parameters derived from fast dynamic imaging during initial enhancement in classifying lesions. Eur Radiol. 2008;18:1123–33. doi: 10.1007/s00330-008-0870-8. [DOI] [PMC free article] [PubMed] [Google Scholar]
- 11.Liney GP, Gibbs P, Hayes C, Leach MO, Turnbull LW. Dynamic contrast enhanced MRI in the differentiation of breast tumors: User-defined versus semiautomated region-of-interest analysis. J Magn Reson Imaging. 1999;10:945–9. doi: 10.1002/(sici)1522-2586(199912)10:6<945::aid-jmri6>3.0.co;2-i. [DOI] [PubMed] [Google Scholar]
- 12.Gibbs P, Liney GP, Lowry M, Kneeshaw PJ, Turnbull LW. Differentiation of benign and malignant sub-1 cm breast lesions using dynamic contrast enhanced MRI. Breast. 2004;13:115–21. doi: 10.1016/j.breast.2003.10.002. [DOI] [PubMed] [Google Scholar]


