Abstract
This article reviews the computed tomography and magnetic resonance imaging (MRI) features of renal tuberculosis (TB), including TB in transplant recipients and immunocompromised patients. Multi detector computed tomography (MDCT) forms the mainstay of cross-sectional imaging in renal TB. It can easily identify calcification, renal scars, mass lesions, and urothelial thickening. The combination of uneven caliectasis, with urothelial thickening and lack of pelvic dilatation, can also be demonstrated on MDCT. MRI is a sensitive modality for demonstration of features of renal TB, including tissue edema, asymmetric perinephric fat stranding, and thickening of Gerota's fascia, all of which may be clues to focal pyelonephritis of tuberculous origin. Diffusion-weighted MR imaging with apparent diffusion coefficient (ADC) values may help in differentiating hydronephrosis from pyonephrosis. ADC values also have the potential to serve as a sensitive non-invasive biomarker of renal fibrosis. Immunocompromised patients are at increased risk of renal TB. In transplant patients, renal TB, including tuberculous interstitial nephritis, is an important cause of graft dysfunction. Renal TB in patients with HIV more often shows greater parenchymal affection, with poorly formed granulomas and relatively less frequent findings of caseation and stenosis. Atypical mycobacterial infections are also more common in immunocompromised patients.
Keywords: Diffusion-weighted imaging, lobar caseation, magnetic resonance, multidetector computed tomography, renal TB
Introduction
Tuberculosis (TB) remains a worldwide scourge, with significant mortality and morbidity, both in the developing and developed nations. The epidemiology of TB, both pulmonary and extrapulmonary (especially genitourinary TB [GUTB]), has been covered in part I of this article, with a detailed description of the spread and pathophysiology of primary and reactivated TB. The plain film, intravenous urograms (IVU), and sonographic (USG) features have also been dealt with in the previous section. This part of the review focuses on the computed tomography (CT) and MRI features of renal TB, which are elaborated upon in detail. Included in this review is the CT appearance of lobar caseation, which is a good pointer to renal TB. The application of multi detector computed tomography (MDCT) in the assessment of renal TB is also elaborated upon. Standard MRI findings and the newer sequences in MRI are also reviewed. Finally, this review touches upon the future advances in imaging that may help in the management of patients affected with renal TB and also highlights the imaging features of TB in renal transplant recipients and other immunocompromised patients.
CT urography (CTU) performed on high-end MDCT scanners may detect early changes, which were earlier usually noted on the IVU and hence, familiarity with IVU changes remains relevant. To date, there have been few reports on the MRI features of GUTB; however, the contribution of MRI is likely to increase with the increasing use of diffusion-weighted imaging (DWI) in abdominal applications. Spectroscopy can also be expected to contribute significantly.
Computed Tomography
CT is useful both in the diagnosis of renal TB and in assessing its severity in terms of loss of renal function and involvement of other organs in the abdomen.[1] Currently available MDCT scanners offer much better CT urograms than did earlier scanners. Hence, the urographic findings mentioned in part I retain their relevance in spite of the decline in the number of urography studies being performed. Barring very early changes, most findings on an IVU should be detectable on CTU carried out on current high-end MDCT scanners. CT, in general, shows more details of pathologic anatomy due to the availability of axial images for review and is superior to retrograde pyelography (RGP), IVU, and USG in detecting multiple small urothelial lesions.[2] However, until such time as it is proven to be superior to IVU in assessing early renal TB changes, the IVU shall reign supreme. RGP is reserved for patients with renal failure, drug allergy, or patients with metal implants that might cause artifacts. In the future, dual-, tri-, and quad-energy CT can be expected to add a new dimension to imaging, with spectral details from the same contributing significantly.[3]
CT does not require bowel preparation. It directly visualizes the renal parenchyma, irrespective of renal function and, in addition, assesses extrarenal spread of the disease. The CT nephrogram is not as dependant on renal function as is an IVU nephrogram. CT is also useful in identifying renal scars, mass lesions, and urothelial thickening, all of which are common findings in renal TB. CT can also substitute for RGP in cases where the ureteric orifice cannot be identified or cannot be cannulated due to a tight stricture.
The densely calcified kidney, which would be sub-optimally seen on USG due to shadowing [Figure 28c from part 1 of this review article], would not pose a problem on CT, which can clearly visualize the non-calcified portions of the kidney.[4] CT can detect calcification with greater accuracy, precision, and sensitivity[5] and is the most sensitive modality for identifying renal calcifications, which occur in over 50% of cases of GUTB.[6] CT is also the best modality for demonstrating the extent, nature, and distribution of calcification within the abnormal kidney.[7]
MDCT with contrast administration also allows dynamic assessment of the kidney in different phases of excretion and can define the extent of the disease and identify significant obstruction as well as other complications.[8]
The disadvantages of CT include its inability to identify very early changes of TB such as small parenchymal granulomas (3 mm in size), minimal urothelial thickening, and subtle papillary necrosis. However, newer high-end scanners, if used meticulously, may be able to identify small granulomas. The need for use of contrast and radiation issues, especially in young patients, are other limitations of CT studies which are not encountered on US imaging.
CT features of renal TB are varied and depend upon the stage of the disease. They result from a combination of papillary necrosis and parenchymal destruction. Typically, the papillae are involved first and this is followed by cortical damage. Communication with the collecting system results in thickening, ulceration, and fibrosis – often with stricture formation[9,10,11] and consequent obstruction. The most valuable feature of renal TB is the multiplicity of abnormal findings.[6,11,12,13] A lobar pattern of caseation, arising from the assimilation of the calyces into the caseous parenchyma of each destroyed lobe, is virtually diagnostic of renal TB.
Renal parenchymal changes
Early changes in renal TB include granulomas of ≤3 mm in size and papillary necrosis. These can be appreciated on the current high-end MDCT scanners. Both corticomedullary and nephrographic phases must be scrutinized carefully. A TB granuloma is seen as a solid mass with little or minimal enhancement after contrast administration[14] and is usually accompanied by collecting system changes [Figures 1A, 2 and 3B]. MRI may be useful in further characterizing the mass when enhancement cannot be definitively proven at CT.[15] In rare cases, there may be single or multiple parenchymal nodules, without collecting system involvement.[16] Lu et al., in a study of 50 kidneys affected by TB, found an incidence of 12%.[1] The majority reveal evidence of peripheral enhancement.[17] The nodules are variable-sized, well-defined parenchymal lesions on cross-sectional images and may mimic renal neoplasms, which may lead to unnecessary surgery; these are therefore labeled as the ‘pseudo-tumoral’ type.[16,18,19] The lesions can occasionally grow to a very large size.[20] Larger granulomas may form masses of mixed density due to the presence of areas of calcification.
Figure 1 (A-C).
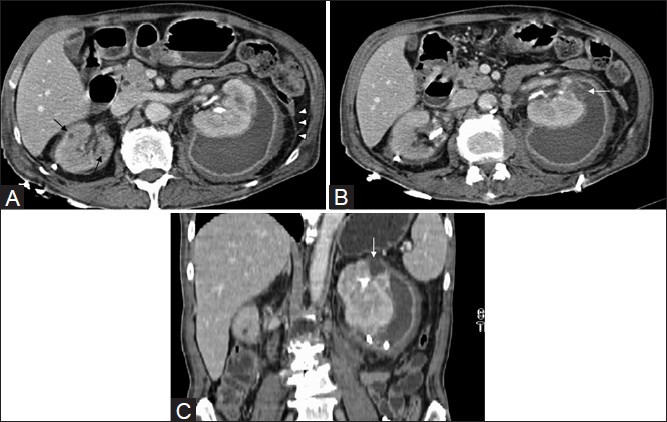
Axial CT revealing tiny granulomas (arrows) in both kidneys, better appreciated on the (R). A left renal abscess with perinephric extension. Note bilateral fascial thickening (arrowheads), additional (B) axial and (C) coronal CT images revealing site of rupture into the perinephric space (arrows). Drainage catheters are noted bilaterally
Figure 2.
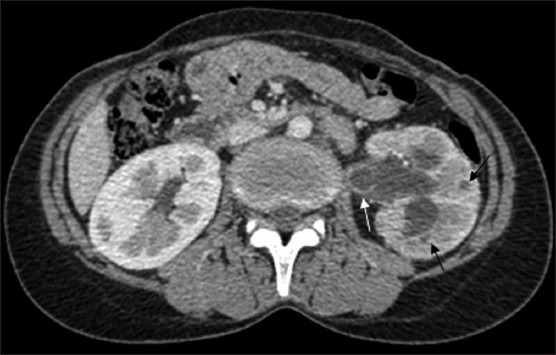
CT revealing parenchymal granulomas (black arrows) in the (L) kidney with uneven caliectasis and ureterectasis accompanied by urothelial thickening (white arrow). Note the hypoperfused renal parenchyma and complete loss of corticomedullary differentiation in the (L) kidney
Figure 3 (A, B).
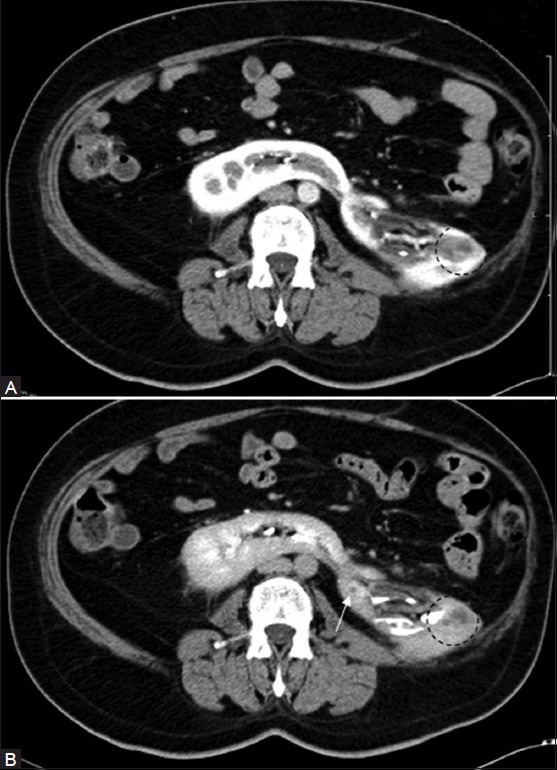
(A) Nephrographic and (B) pyelographic phase of CT: Showing a peripherally enhancing granuloma (arrow) in a horseshoe kidney. Diffuse inflammation mimicking a lobar nephronia-like appearance is also noted, with perinephric extension (circled area). Note loss of corticomedullary differentiation in (A) in the left third of this kidney (Figure courtesy Alok Singhai, DNB)
Rarely, renal TB can take the form of a well-circumscribed cystic mass with enhancing septations.[21] In a series of 50 patients by Lu et al. the commonest finding (68%) was of one or more cavities adjacent to a calyx, with thinning of the adjacent cortex[1] [Figure 4A and B]. Coalesced cortical granulomas containing caseous or calcified material can be easily identified on CT.[22] Caseation is frequently noted and is a good pointer to TB.
Figure 4 (A, B).
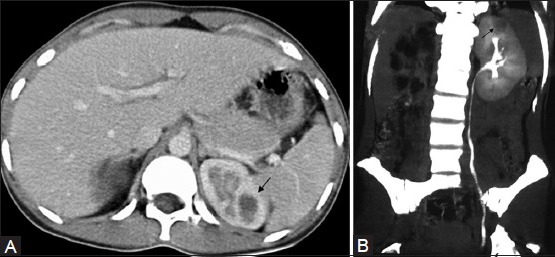
CT revealing caseous TB cavity (arrow) in the upper pole of the (L) kidney: (A) axial and (B) coronal sections (MIP image). Note non-functioning hydronephrotic (R) kidney, with a scarred renal pelvis, in (B), which is a delayed scan
Localized tissue edema and vasoconstriction caused by active inflammation result in focal hypoperfusion as seen on contrast-enhanced CT (CECT). This finding is similar to that seen in acute pyelonephritis caused by other organisms.[23,24]
Frank abscesses may form, which can grow to large sizes, especially if secondary infection sets in. These abscesses may rupture and spread into the perirenal space and beyond [Figure 1]. Tubercular renal abscesses are seen as hypodense areas of 10-40 HU with mild peripheral enhancement [Figure 5]. Cavitation within the renal parenchyma may be seen as irregular pools of contrast material if a calyceal communication exists[25] [Figure 6]. Focal, segmental, and polar involvement can be demonstrated. Inflammatory granulomatous and caseating masses show enhancement.[26] Focal or diffuse cortical scarring and non-function are other findings of advanced disease.[27]
Figure 5 (A, B).
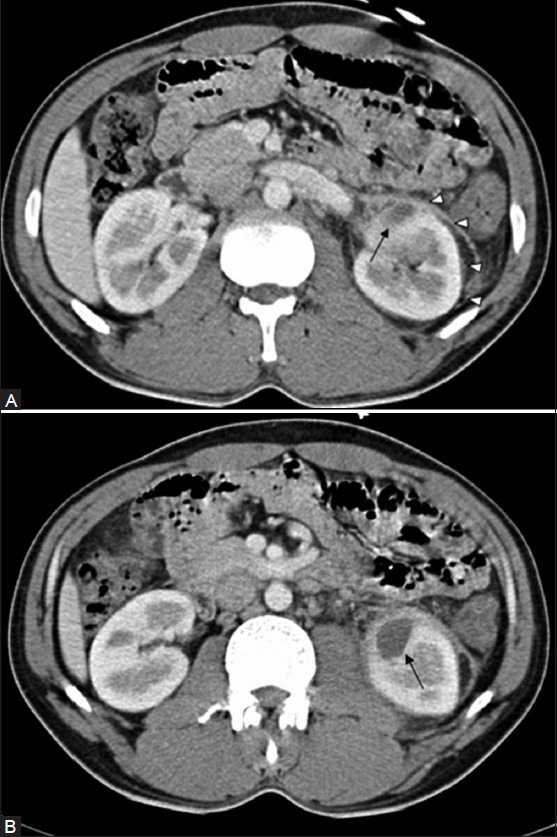
CT revealing Left TB renal abscess (arrow) with minimal perinephric spread (arrowheads) in (A). The left psoas muscle is involved, better appreciated in (B), Retroperitoneal fascial thickening, fat stranding, and small left paraaortic lymph nodes are also noted with a loss of corticomedullary differentiation of the affected area in the (L) kidney
Figure 6.
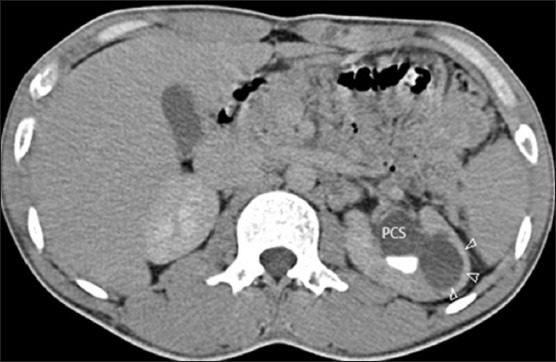
CT revealing a cavity (white arrowheads)communicating with a dilated pelvi calyceal system (PCS)
In patients in whom symptoms of infection are not very clear, focal pyelonephritis may mimic the appearance of a solid renal neoplasm and occasionally a lobar nephronia-like picture may be noted [Figure 3]. A chronic renal abscess may have the appearance of a well-circumscribed multi-septated cystic renal mass[21] or a cystic renal neoplasm.[15] It has been mentioned that in some cases of focal TB pyelonephritis, a poorly defined interface between the infection and the renal parenchyma, edema of the surrounding renal parenchyma, or asymmetric perinephric stranding may be a hint to the diagnosis.[15] Increased perirenal stranding, thickening of Gerota's fascia [Figures 1A, 5A and B], and a remote history of fever may also serve as pointers to the lesion being an abscess.[15] These are good clues; however, edema of the surrounding renal parenchyma may be minimal or absent in renal parenchymal TB. In both instances, if fine needle aspiration cytology (FNAC) is performed to exclude a malignancy, the aspirate should also be sent for mycobacterial culture and antibiotic sensitivity, polymerase chain reaction (PCR) being a good option to fast-track the diagnosis.
Healing leads to fibrosis and calcification. Fibrosis in the parenchyma can lead to the formation of deep scars [Figure 7]. These may be seen located overlying a deformed calyx or may be independent of the calyces. Parenchymal scarring is well visualized on CT.[22] Another common CT finding includes either global or focal cortical thinning[22] [Figure 7]. Fine calcifications are best seen on CT and may be good clues to the presence of TB [Figure 8A]b. Calcification is detectable in a large number of cases (40-70%)[28] and varies in appearance depending upon the stage and severity of the disease – from punctate, to amorphous, to thin rims surrounding low-attenuation areas of focal cortical inflammation [Figure 8B and C]; to diffuse uniformly radio-dense areas, replacing part or all of the renal parenchyma, in late-stage disease.[29] The lobar pattern of calcification, which is pathognomonic for TB, is well appreciated on axial CT images, especially when the calcification occupies just a lobe or two, or even a part of the same lobe [Figure 8D and E]. This can also be appreciated on USG, but has to be carefully looked for.
Figure 7 (A-C).
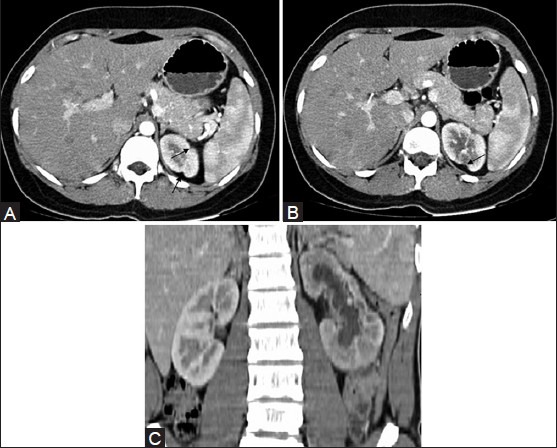
CT revealing (A) focal renal cortical scarring (arrows) and (B) focal cortical thinning (C) diffuse cortical scarring of the (L) renal cortex. Renal pelvic scarring and resultant caliectasis are also noted
Figure 8 (A-E).
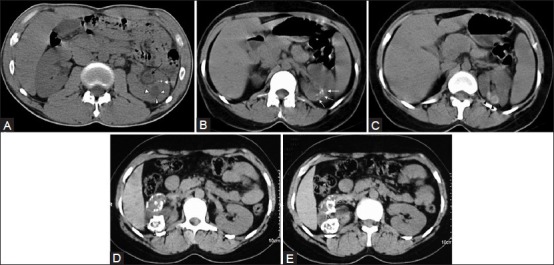
(A) Non-contrast CT image showing fine cortical calcification in the (L) kidney (white arrow). The same patient as in Figure (5). The cavity (arrowheads) was communicating with the PCS (refer Figure 5). The urothelial thickening (black arrow) is also well appreciated. (B and C) non-contrast CT image showing punctate calcification [arrows in (B) and soft (caseous) parenchymal calcification arrowheads in (C)]. (D and E) axial CT revealing the lobar pattern of calcification (arrowheads) is well appreciated on these axial images
Renal calcifications have also been described in atypical mycobacterium infections, viz, Mycobacterium avium-intracellulare,[30] which has been reported in 5.5% of patients with AIDS. These usually take the form of fine punctuate calcification and – as a rare exception to the usual rule in mycobacterial calcification – occurs in the acute rather than the chronic stage of disease. A high level of suspicion is usually necessary and biopsy specimens must be routinely stained for acid-fast bacilli and cultured for M. avium-intracellulare.
Pelvic alyceal system (PCS) involvement
As mentioned earlier, the collecting system is commonly involved in GUTB. In the early stage, a few calyces may be involved and only papillary necrosis or other minor calyceal deformities are seen.[22,23,25] Lang[31] studied 86 patients with microscopic hematuria and negative IVUs on multiphasic MDCT; papillary and medullary necrosis was positively identified in 25 (29%) of these patients. Collecting system involvement leads to ulceration, wall thickening, and fibrosis with stricturing.[8] CT is sensitive in detecting focal or diffuse caliectasis unaccompanied by renal pelvic dilatation[7] [Figure 9A and B]. Urothelial thickening, a prominent feature, is a useful and obvious clue [Figure 9] if identified. However, minimal thickening is not as well appreciable on CT as on USG. Fibrosis occurs after healing, resulting in multifocal strictures[11,24] [Figure 10]. The most characteristic finding is uneven caliectasis[16,18,25] caused by varying degrees of fibrosis and obstruction at different sites.[23] Caliectasis that is not revealed by the IVU because of poor renal function, can be well assessed on CT. When the renal pelvis and ureter are involved, the hydronephrosis becomes severe. The involved segment of the collecting system reveals wall thickening and post-contrast enhancement.[32] In patients with healed or chronic TB, calcification may be noted.[16,22,23,25] With long-standing renal TB, progressive parenchymal atrophy and hydronephrosis lead to a loss of normal morphology, and the appearance mimics multiple thin-walled cysts or, occasionally, a multiloculated cyst[16] [Figure 11]. Various patterns of hydronephrosis may be seen on CT depending on the site of the stricture; these include focal caliectasis, caliectasis without pelvic dilatation,[11] and generalized hydronephrosis. Fibrotic strictures of the infundibuli and renal pelvis may be seen on CECT.[22] Fibrosis results in a small – at times ‘virtually absent’ – renal pelvis,[26] which, if accompanied by calcification, suggests TB. CT in such cases may reveal a ‘daisy flower’ appearance.[26]
Figure 9 (A, B).

CT revealing focal uneven caliectasis. Enhancing urothelial thickening (white arrows), noted in the pelvic alcyceal system and upper ureter. Retroperitoneal lymph nodes are also noted (black arrows)
Figure 10.
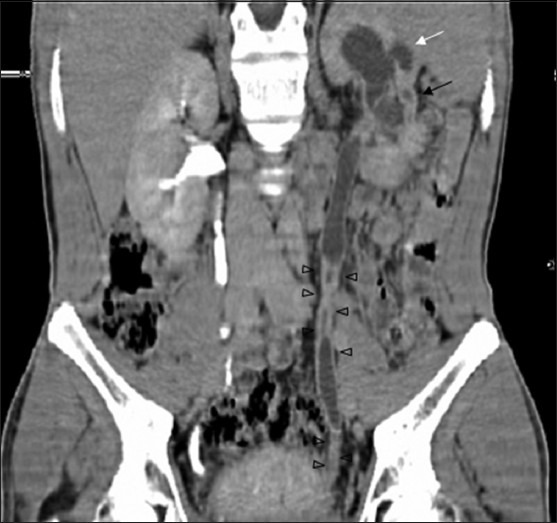
CT revealing multiplicity of findings in urinary TB-uneven caliectasis with no obvious pelvic dilatation, parenchymal scarring (black arrow), cavity communicating with PCS (white arrow), urothelial thickening and multiple ureteral strictures (black arrowheads)
Figure 11.
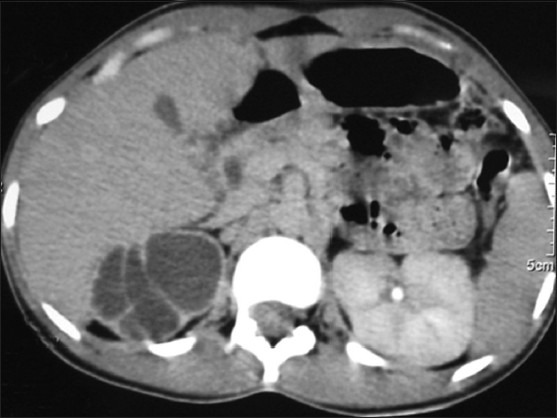
CT revealing chronic tubercular (R) renal affection mimicking a well-circumscribed multi-septated cystic renal mass
Calyces that are dilated due to fluid have attenuation values between 0 HU and 10 HU; those filled with debris and caseation have attenuation values between 10 HU and 30 HU; putty-like calcification shows attenuation values between 50 HU and 120 HU; and calculi show attenuation values greater than 120 HU.[13] As destruction progresses, the dilated calyces are assimilated into the caseous renal parenchyma and a unique ‘lobar caseation’ appearance is recognizable. This can be easily differentiated from hydrocalycosis, as each individual lobe does not connect to another as would be expected if they were calyces [Figure 12].
Figure 12 (A, B).
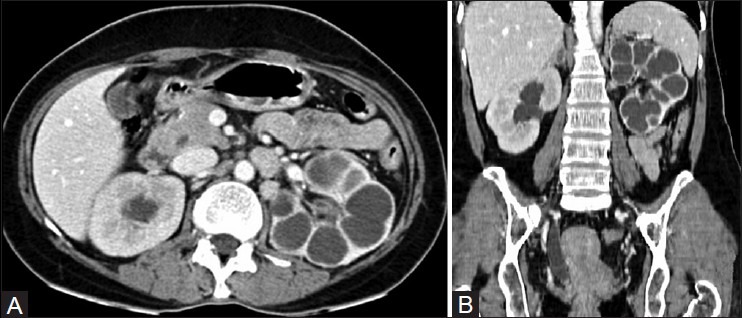
(A) Axial and (B) coronal CT images revealing lobar caseation of the (L) kidney. Note assimilation of the calyces into the renal parenchyma. The calyces in the (R) sided hydronephrosis communicate with each other and are clearly demarcated from the renal parenchyma. Note the stricture of distal ureter with resultant proximal dilatation
In the right clinical setting, uneven caliectasis should be suggestive of renal TB, especially if accompanied by urothelial thickening and provided, of course, that obstructing calculi can be excluded [Figure 9].
Kenny[9] stated that although pelvi-infundibular strictures, papillary necrosis, cortical low-attenuating masses, scarring, and calcification may be seen in other conditions, the combination of three or more of these findings is highly suggestive of TB, even in the absence of documented pulmonary disease. In one study, 35% of patients had four of these findings and 40% had three.[33] We would like to add urothelial thickening to this list. Pattern recognition is important too. For example, caliectasis with urothelial thickening accompanied by a non-dilated/scarred renal pelvis would be a good pointer toward a diagnosis of renal TB. Three imaging patterns were described in CT of renal TB by Wang et al.[18] whenever multiple findings were noted: (a) multiple stricture sites; (b) a single stricture with one other imaging finding; and (c) autonephrectomy along with any other imaging finding barring stricture. The lobar pattern of calcification is pathognomonic of renal TB and ‘lobar caseation’ comes pretty close to the same.
In most patients with renal TB, multiple abnormalities are present and an imaging-based diagnosis can easily be made.
Extrarenal findings
CT is the optimal procedure for evaluation of retroperitoneal extension of disease.[13,34] It can assess perinephric spread,[11,13,35,36] including extension to perirenal and pararenal spaces,[37] and also evaluate psoas muscle affection [Figure 5B].[9,19,35,38] Adrenal involvement; retroperitoneal collections; subcutaneous collections; retroperitoneal fibrosis; and prostate, seminal vesicle, and spinal affection are all extremely well evaluated by CT.[35,39]
Fistulas
Fistulas to various sites are not an uncommon occurrence in GUTB and are well depicted on CT. Fistulas involving the kidney may communicate with the bowel, skin, blood vessels, lymphatics, or thoracic cavity (pleura or bronchus).[40] Renal fistulas may be classified into those communicating with the calyces via the parenchyma (reno- or nephro-) and those that communicate with the renal pelvis (pyelo-).[41] Obstructing calculi may precipitate/prolong such fistulas. TB fistulas are, however, seen less commonly in the current era due to the availability of advanced antibiotics.
Fistulas between the kidney and alimentary tract most commonly involve the colon, duodenum, or stomach.[41] CT is the single most useful diagnostic modality in these cases, and demonstrates significant extrarenal inflammation, along with details of the intrarenal component. Complex material and gas may be present within the renal collecting system.[41]
In renocutaneous fistula, CECT is probably the best initial examination to demonstrate abnormal soft tissue around the tract and the extent of the inflammation. MDCT's volumetric imaging and multiplanar capabilities aid visualization.[41] The cutaneous tract may be opacified on CECT if the kidney is functioning; alternatively, the tract may be injected with iodinated contrast material.[42]
Fistulas have been described between the renal collecting system at the fornix and the lymphatic system.[43] TB is amongst the commonest causes of this, second only to filariasis. CT lymphangiography is useful for obtaining details and for ruling out an associated retroperitoneal collection or lymphadenopathy.[44]
TB is a rare cause of renobronchial fistulization.[41] Spread by contiguity to the liver, causing a liver abscess, has also been reported.[45] Evidence of adrenal TB may be noted, which manifests as unilateral or bilateral adrenal enlargement and central necrosis; and may be accompanied by calcification.[23] With treatment, adrenal atrophy with calcification may be seen,[23,25] and these patients may present with Addison disease.[46]
CT findings of TB elsewhere in the body, for example, features of abdominal TB such as ascites (especially with septations), omental infiltration, peritoneal thickening, mesenteric involvement, bowel wall thickening, enlarged lymph nodes (especially those with necrosis) [Figure 13], splenomegaly, and splenic or hepatic focal lesions, are pointers toward the possibility of the urinary tract lesion being of TB origin.[4] Omental caking (especially when associated with ascites and necrotic nodes) as well as chylous ascites (a fat-fluid level) accompanied by caseated lymph nodes are both pathognomonic of abdominal TB.[47,48]
Figure 13.
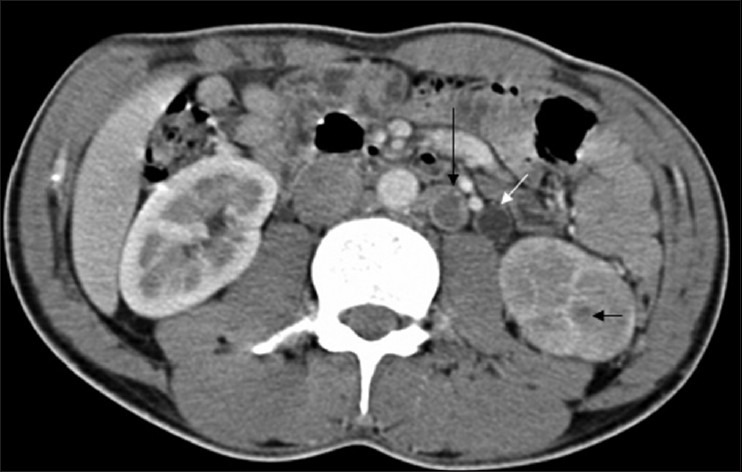
CT revealing poor density (L) nephrogram with complete loss of corticomedullary differentiation. Tiny granulomas (short black arrow) are noted and so are necrotic left para-aortic lymph nodes (long black arrow) and a dilated ureter with urothelial thickening (white arrow)
Other complications of renal TB
Secondary renal amyloidosis is a known complication of various conditions, including extensive pulmonary TB.[49] This may progress to renal failure if the underlying pulmonary TB is not treated or controlled. On similar lines, extensive renal TB may possibly contribute to renal amyloidosis which, when present in the contralateral kidney, may necessitate nephrectomy of the damaged TB kidney.
Magnetic Resonance Imaging
MRI provides good morphological details of the kidneys as well as excellent delineation of the ureters.[50] It allows characterization of various renal masses and can provide valuable information contributing to their clinical management.[51] It is particularly useful in pediatric or pregnant patients or when ionizing radiation and iodinated contrast cannot be administered. Non-contrast MRI is especially useful in patients with renal failure.[50] MRI is helpful for further differentiation of lesions when CT and/or ultrasound are equivocal.[52] MR urography (MRU) comprises an evolving group of techniques with the potential for optimal non-invasive evaluation of urinary tract abnormalities.[53] Both static-fluid (non-contrast, heavily T2W sequences) and excretory MRU (performed during the excretory phase of enhancement after intravenous gadolinium) can be combined with conventional MRI for comprehensive evaluation of the urinary tract. Cine MRU demonstrates the ureters in their entirety and is useful for confirming the presence of stenosis.[53] It is most successful in patients with moderately to severely dilated[54] obstructed collecting systems[53] and in impaired renal function situations.[54] MRU performed with a distended urinary bladder allows better visualization of the upper urinary tract.[55] Time-resolved dynamic contrast-enhanced MRU has been used in the evaluation of ureteral peristalsis in GUTB.[56] In view of the possibility of nephrogenic systemic fibrosis/nephrogenic fibrosing dermopathy,[57] caution should be exercised while administering gadolinium in patients with compromised renal function.
There are very few articles available in the literature on MRI in renal TB and hence the appearance of the same is still not widely known.
Due to its tissue characterization ability, amongst other features, MRI provides informative features corresponding to the pathologic stage of the disease.[58] The superior contrast resolution of MR imaging is ideal for further characterization of renal lesions in cases with indeterminate enhancement at CT.[15] MR imaging may be useful in further characterizing a mass when CT enhancement cannot be definitively proven.[15]
Renal parenchyma
Renal parenchymal involvement in TB is usually associated with collecting system involvement.[14] Localized tissue edema and vasoconstriction caused by active inflammation results in focal hypoperfusion as seen on contrast-enhanced MRI,[14] a finding similar to that seen in acute pyelonephritis caused by other organisms.[23,24]
Loss of interface between the infection and the adjacent renal parenchyma, the surrounding tissue edema, the asymmetric perinephric fat stranding, and the thickening of Gerota's fascia may be clues indicating that the focal pyelonephritis has a tuberculous origin. A chronic abscess may resemble a cystic neoplasm with multiple internal septae. Loss of corticomedullary differentiation in the affected area is obvious [Figures 14 and 15].
Figure 14.
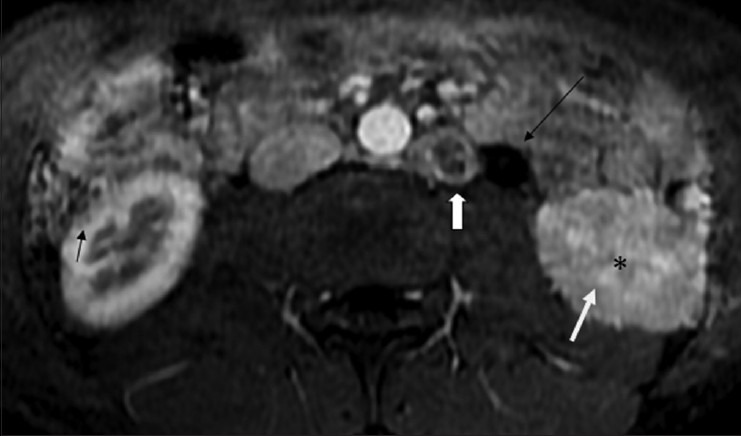
Fat-saturated contrast-enhanced T1W axial MRI image shows loss of normal corticomedullary differentiation (white arrow) with subtle areas of striated nephrogram (*) in the (L) kidney. Small peripherally enhancing hypointense lesions, suggestive of granulomas are seen in (R) kidney (black arrow). Note the dilated proximal ureter (long black arrow), and a large necrotic left para-aortic lymphnode (white block arrow)
Figure 15.
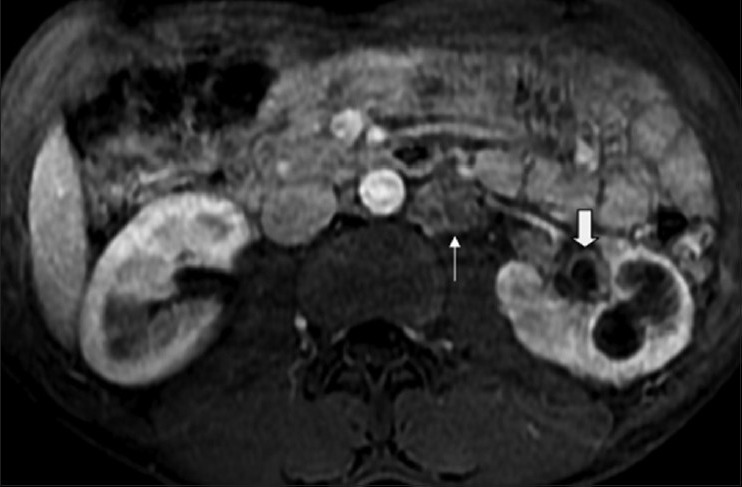
Axial fat-saturated contrast-enhanced MRI image showing loss of normal corticomedullary differentiation along with focal caliectasis, cavity communicating with the calyces, enhancing urothelial thickening (white block arrow) and necrotic (L) para-aortic lymphnodes (white arrow). Note normal corticomedullary differentiation in the right kidney
Contrast-enhanced, fat-suppressed T1-weighted (T1W) images show the hypoperfused areas well, as also the adjacent focal caliectasis accompanied by urothelial thickening [Figure 15]. According to Hecht et al. the use of image subtraction techniques (gadolinium-enhanced fat-suppressed T1W image minus unenhanced fat-suppressed T1W image) is an easy, reliable, and reproducible method of demonstrating the presence or absence of enhancement within a renal mass on MRI.[59] However, for successful use of subtraction, it is necessary to have accurate co-registration of the unenhanced and contrast-enhanced images.[15] Therefore, it has been recommended that all MR imaging sequences be performed during an end-expiratory breath-hold, which has been shown to be more reproducible than end-inspiratory breath holding.[60,61]
A TB granuloma is seen as a solid mass of variable size. The smaller nodular lesions usually appear hypointense on both T1W and T2W images [Figures 14, 16 and 17], whereas the larger nodules may reveal central hyperintensity on T2W images.[62] The central T2 hyperintense signal is due to high numbers of macrophages, fibrosis, and gliosis, as well as the increased lipid content, in these lesions.[63] The necrotic debris along with the caseation and calcification results in a heterogeneous hypo- to iso-intense signal on T2W images.[26] Caseation may have a slightly hyperintense appearance on T2W images [Figure 18]. In T2W images, larger lesions may reveal thick irregular hypointense walls, with a debris-fluid level within.[64] In rare cases, single or multiple parenchymal nodules, without collecting system involvement, are noted, presenting as variable-sized, well-defined parenchymal nodules on cross-sectional images; the appearance may mimic a renal neoplasm. These can occasionally grow to very large sizes and are called as the ‘pseudo-tumoral’ type.[20] MRI helps in differentiating macronodular TB lesions from other mass lesions. Necrotic granulomas can communicate with the collecting system, emptying their contents therein [Figures 15 and 19].
Figure 16.
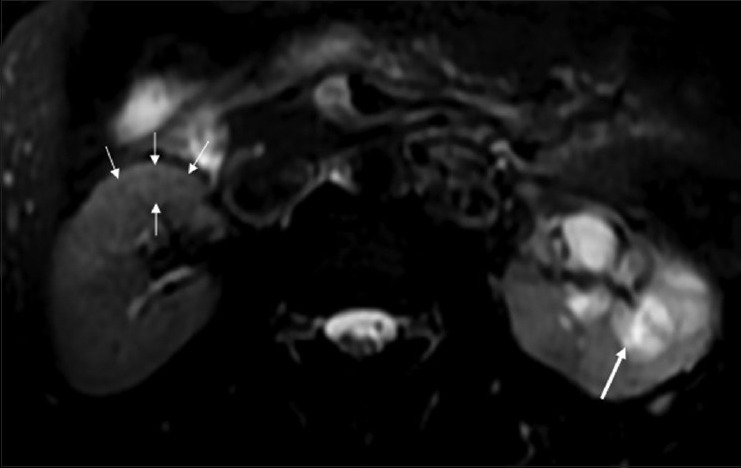
Fat-saturated T2W FSE sequence MRI image showing multiple small hypointense granulomas (thin white arrows) in the (R) kidney. The (L) kidney shows caliectasis with heterogeneous intermediate signal within on T2W images, due to caseous internal debris (thick arrow)
Figure 17.
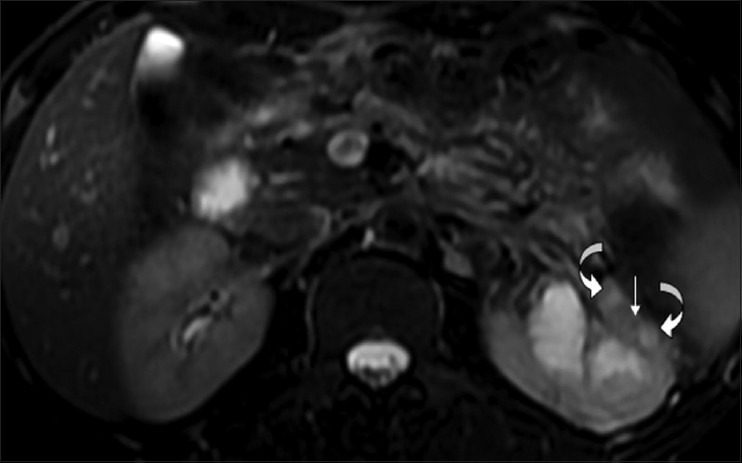
Fat-saturated T2W FSE sequence MRI image showing small, slightly hyperintense, caseating granulomas (curved arrows), and a tiny hypointense non-caseating granuloma (arrow)
Figure 18 (A-C).
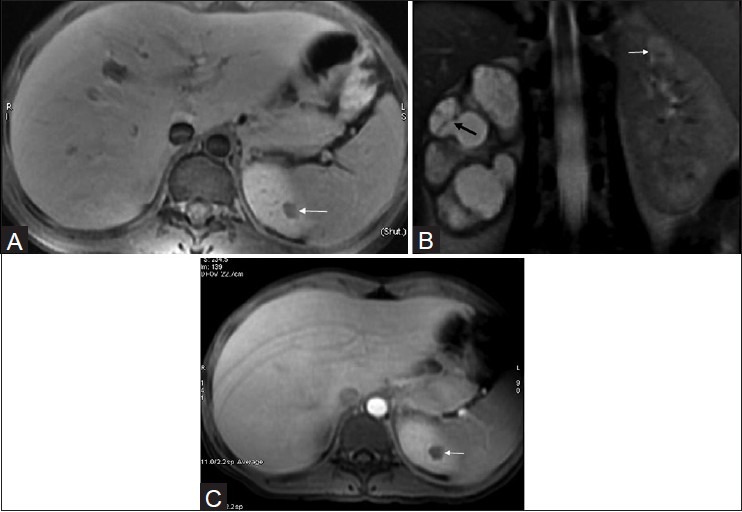
(A) axial fat-saturated T1W FSE, (B) Coronal fat-saturated T2W FSE sequence and (C) post-contrast axial T1 fat-saturated MRI images of the same patient reveals multilocular cystic appearance in a case of tuberculous pyonephrosis on right side. There is significant global thinning of the renal parenchyma. The cystic lesions are predominantly hyperintense, but reveal multiple scattered areas of intermediate signal within, along with few septae (black arrow). The left upper pole renal lesion appears slightly hyperintense on T2-weighted images suggestive of a focal area of caseous necrosis (white arrow)
Figure 19 (A-C).
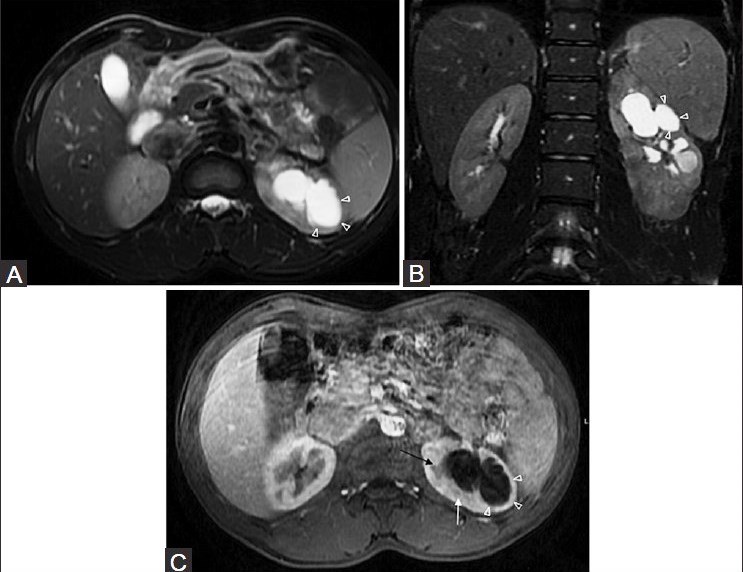
(A) axial and (B) coronal fat-saturated T2W FSE sequence and (C) post-contrast axial T1 fat-saturated MRI images-showing a TB cavity (arrowheads) communicating with dilated calyces. Note small peripheral non-enhancing hypointense lesion, suggestive of a granuloma (white arrow). An enlarged pyramid is also noted (black arrow)
In experimental animal studies, diffusion-weighted MR imaging has been used to assess renal fibrosis.[65] It was noted that an apparent diffusion coefficient (ADC) decrease in renal fibrosis was associated with an increased number of cells (including fibroblasts) and hence it has been suggested that ADC has the potential to serve as a sensitive non-invasive biomarker of renal fibrosis. This could be useful when applied to evaluating parenchymal fibrosis in the various stages of renal TB, including during the post-treatment phase.
DWI is now a widely-used MR technique in many fields of clinical imaging and the addition of these sequences to the diagnostic armamentarium of radiologists enables a ‘one-stop shop’ renal protocol in which both morphologic and functional sequences are combined.[66] Renal anisotropy reflects the nephronal architecture, which can be quantified.[67] Increasing fibrosis, along with decreasing renal anisotropy, can thus be a possible biomarker in the future.[66] These and other techniques, such as MR elastography and US elastography, should prove very useful in the evaluation of the complex changes the kidney undergoes in TB affection, both during the initial diagnosis and during follow-up of such cases (including assessment of response to treatment and monitoring of the sequelae).
Collecting system
Early collecting system changes would be difficult to visualize on MRI. A greater use of DWI may alter this perspective. Fibrosis occurring after healing of acute inflammation results in multifocal strictures, producing uneven caliectasis, which is the most characteristic cross-sectional imaging finding in urinary TB [Figure 15].[16,18,25] In combination with renal pelvic scarring and urothelial thickening, uneven caliectasis forms a pattern that is a very strong pointer to renal TB. MRU can show severe caliectasis that is not shown on IVU. Renal pelvic and ureteric involvement by TB results in the hydronephrosis becoming severe [Figures 18B and 20], with wall thickening and enhancement seen in the involved segments[14] [Figure 21].
Figure 20.
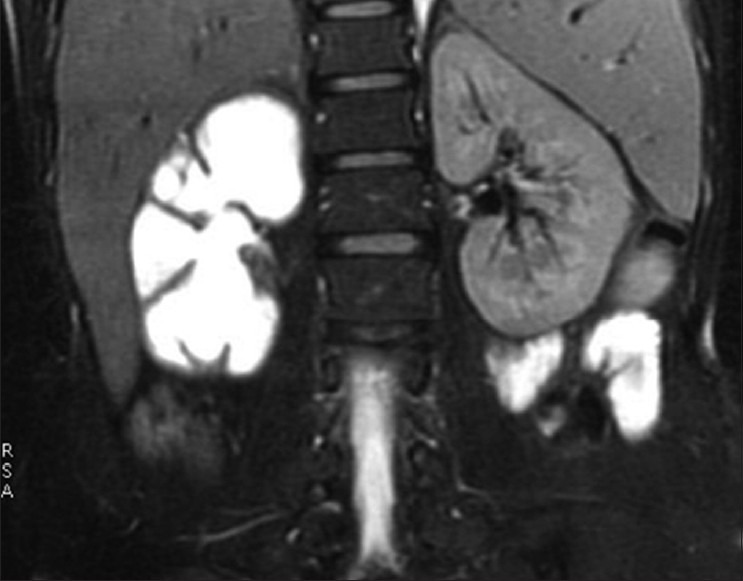
Fat-saturated T2W coronal MRI image of TB pyonephrosis revealing a scarred renal pelvis and marked dilatation of the collecting system with severe parenchymal loss
Figure 21.
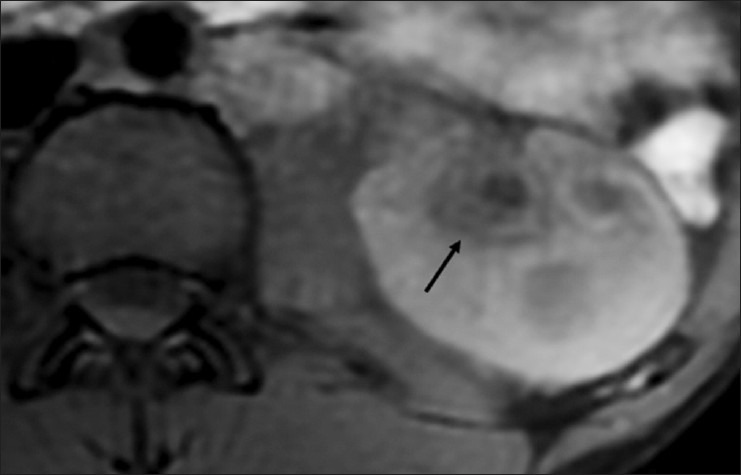
Fat-suppressed T1W MRI image showing a dilated calyx with significant urothelial thickening (arrow)
DWI can be used to differentiate hydronephrosis from pyonephrosis. In cases of pyonephrosis, the ADC values of the renal pelvis are found to be lower than those of the renal pelvis of hydronephrosis (0.77 × 10⁻³ mm2/s to 1.07 × 10⁻³ mm2/s).[68] However, this finding is not specific for TB pyonephrosis [Figure 22].
Figure 22 (A, B).
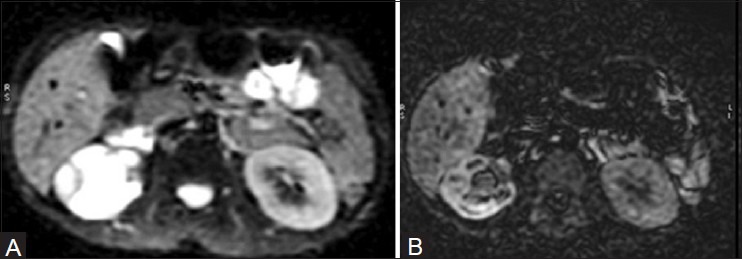
Diffusion-weighted imaging (A) and the corresponding apparent diffusion coefficient (B) image in MRI shows restricted diffusion within a dilated right PCS, suggestive of pyonephrosis. Note urothelial thickening
In abdominal imaging, DWI offers a great potential, particularly for detecting and characterizing focal lesions. It is also useful in the evaluation of diffuse parenchymal diseases for which current techniques are often suboptimal.[68] Healed or chronic TB often results in calcification.[35] Long-standing TB results in loss of renal morphology, and the kidney could have an appearance of multiple thin-walled cysts or, occasionally, of a multiloculated cyst.[16] The end result of inadequately treated TB can be a putty kidney or some other type of TB autonephrectomy.
Angiography
Renal angiography shows no specific vascular changes in renal TB. The vessels appear normal in the early case, while in the more advanced case, there may be zones of irregularity (especially of the interlobar and arcuate arteries) and even complete occlusion. In instances of TB pyonephrosis, angiography reveals the appearance of hydronephrosis. Narrowing of intrarenal vessels due to surrounding fibrosis simulates vascular encasement by a neoplasm. Pruning of peripheral vessels and slow flow around a predominantly avascular/hypovascular mass are good pointers toward a tuberculous etiology of the mass.[69] Occasionally, inflammatory hypervascularity can be seen, especially if there is a chronic sinus with secondary infection. With multiple caseating abscesses or hydrocalycosis, the opacification of the rims of the remaining parenchyma (seen best during the nephrographic phase of angiography) produces an appearance like that of multiple cysts of the kidney. Angiography is of greater help in determining how much viable renal tissue remains and in the planning of partial nephrectomy than it is in the specific diagnosis of TB.[70] It is also a necessary a first step for embolization.
TB in Transplanted Kidneys
Organ transplant recipients are prone to TB due to a persistent immune-depleted state. TB has been reported to be one of the most serious bacterial infections after transplant.[71] Pulmonary TB is the commonest, with renal allograft TB being very rare.[72] It appears to present differently from GUTB in non-transplant patients, with urinary tract symptoms being infrequent;[73] hence, a diagnosis that is difficult to make in normal hosts becomes even more difficult. The latent period that is usually seen in GUTB, which at times can be many decades, is missing and the majority of patients present within 6 months after the transplant.[73] The earlier presentation may be due to the presence of pre-existing TB in the donor kidney[74] or because of re-activation of a pre-existing renal or non-renal focus in the face of immunosuppression.[73] Although rare, TB in renal transplants can result in serious complications, including graft rejection,[73] end-stage renal disease (ESRD),[75] and death, which has been reported in 17.86% of transplant recipients affected by TB.[76]
Although renal allograft TB has been reported to occur in association with disseminated TB, reports of isolated TB of the renal allograft are infrequent in literature.[77,78] TB occurs in an estimated 0.35-6.5% of organ transplant recipients,[79] significantly increasing their mortality (up to 17.86%).[71] The incidence reported from India is much higher, between 5.7% and 13.5%,[80] which is probably related to the higher incidence of TB. Due to infrequent early diagnosis, TB causes significant morbidity and mortality in renal transplant recipients in most Southeast Asian countries.[78] The median interval between transplantation and development of TB was 32 months (range: 1-142 months).[76] The annual incidence of TB in renal transplant patients varies from 1% to 15%, which is 8-100 times higher than that in the general population.[81]
Factors associated with increased risk for post-transplant TB include treatment with cyclosporine, diabetes, pre-transplant hemodialysis duration, number of post-transplant rejection episodes, and chronic liver disease.[80,82] Of these, Indian data has suggested the use of cyclosporine to be the strongest risk factor.[80] In addition, changing from azathioprine to mycophenolate for recipient immunosuppression has been implicated.[83]
Imaging findings are usually non-specific and subtle, although a large granuloma has been noted in one series.[72] The IVU usually does not reveal any abnormality. Dowdy et al.[73] have stated that corticosteroid therapy for transplant recipients may account for the lack of abnormalities typically seen on urograms, and feel that the lack of specificity of IVU findings in this group of patients does not justify the risks associated with performing this procedure. We have seen early papillary necrosis (central type) on IVU in one patient [Figure 23] and feel that just to confirm or to rule out the same, it would be worthwhile performing an IVU, especially in a ‘hematuria’ situation. All modalities can be utilized; however, due to its superficial location, US obviously plays a major role in the imaging of such patients.
Figure 23.
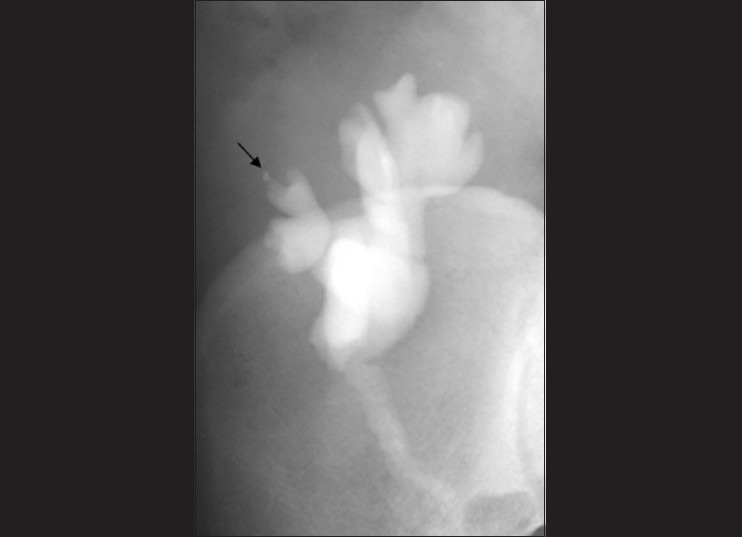
Intravenous urograms (IVU) showing papillary necrosis (arrow) in a transplant kidney
A high degree of suspicion is required to diagnose renal allograft TB as a potential cause for graft dysfunction or loss, and the majority of cases are diagnosed post-graft nephrectomy.[84,85,86] Tuberculous interstitial nephritis (TIN) can also be responsible for graft dysfunction/loss.[87,88] The renal allograft and the patient can both be saved by timely detection and prompt treatment[72] as the mortality rate from TB is very high (on account of the immune suppression). Unfortunately, imaging may be unable to clinch the diagnosis as easily as can be done in normal hosts. Luckily, however, urine culture is positive for Mycobacterium tuberculosis in almost 100% of these patients.[73]
Genitourinary Tuberculosis in HIV
GUTB has a different clinicoradiological presentation in immunocompromised patients, with predominance of systemic symptoms, disseminated TB, multiple parenchymatous renal foci, and lower frequency of lesions of the collecting system.[89] In the context of immune suppression, GUTB behaves like a severe bacterial infection, with bacteremia and visceral metastatic foci.[89] A significant number of immunocompromised patients reveal predominantly parenchymatous renal involvement (87.5% vs. 6.2%).[89] In such individuals, granulomas may be less well formed and caseous necrosis seen less frequently.[90] When immune suppression is severe, and in cases in which the infective organism is one of the environmental mycobacteria, e.g. M. avium-intracellulare, the lesions may be more diffuse and poorly formed and the usual miliary lesions and caseation may not be a prominent feature.[90] A lower frequency of stenosis of the collecting system (12.5% vs. 93.8%) and contracted bladder (12.5% vs. 65.3%) have been noted in HIV-positive patients.[89]
Non-Hodgkin lymphoma has been related to immune deficiency and has been associated with TB.[71]
Future Directions
Recent revolutionary PCR based technologies such as: a) cartridge based nucleic acid amplification techniques [CBNAAT] (GeneXpert – Cepheid USA) and (b) Line Probe Assay (LPA) systems diagnose TB much earlier (including drug sensitivity); within 2 hours by (a) and 2 days by (b), respectively. We have successfully used CBNAAT to diagnose extra-pulmonary TB, and feel this has tremendous potential to revolutionize TB, especially MDR TB, management.
Imaging will continue to play a key role, both in the initial diagnosis and in the follow-up of patients with GUTB.
DWI MR and other techniques such as MR elastography and USG elastography/tissue strain analytics (including exciting new variants such as acoustic radiation force impulse technology) should prove very useful in the evaluation of the complex changes the kidney undergoes with TB, especially key damaging factors such as fibrosis. These techniques will be useful in the initial diagnosis as well as in the follow-up of these patients, including the assessment of response to treatment and the monitoring of sequelae.
Spectral imaging on CT (dual-/tri-/quad-band), as and when it becomes widely available, should further enhance the diagnostic armamentarium of radiologists investigating this scourge. Molecular imaging is also expected to contribute significantly, especially as drugs to treat latent/dormant TB are looming on the horizon.
Acknowledgements
We acknowledge the contributions of the following persons: Rahul Hegde, Tapan Patel and Abhishek Rathi in preparing the manuscript; Sunil Patil, Amit Deshmukh, Rahul Hegde, and Mayura Pawar for preparing the images; and Garima Sharma for the schematic diagrams.
Footnotes
Source of Support: Nil
Conflict of Interest: None declared.
References
- 1.Lu P, Li C, Zhou X. Significance of the CT scan in renal tuberculosis. Zhonghua Jie He He Hu Xi Za Zhi. 2001;24:407–9. [PubMed] [Google Scholar]
- 2.McCarthy CL, Cowan NC. Multidetector CT urography (MD-CTU) for urothelial imaging (abstr) Radiology. 2002;225(P):137. [Google Scholar]
- 3.Freiherr G. Will energy replace slices as CT battleground. 2010. Available from: http://www.diagnosticimaging.com/conference-reports/isct2010/content/article/113619/1574376 .
- 4.Zissin R, Gayer G, Chowers M, Shapiro-Feinberg M, Kots E, Hertz M. Computerized tomography findings of abdominal tuberculosis: Report of 19 cases. Isr Med Assoc J. 2001;3:414–8. [PubMed] [Google Scholar]
- 5.Elkin M. Urogenital tuberculosis. In: Pollack HM, editor. Clinical Urography. Philadelphia: WB Saunders; 1990. pp. 1020–52. [Google Scholar]
- 6.Leder RA, Low VH. Tuberculosis of the abdomen. Radiol Clin North Am. 1995;33:691–705. [PubMed] [Google Scholar]
- 7.Premkumar A, Lattimer J, Newhouse JH. CT and sonography of advanced urinary tract tuberculosis. AJR Am J Roentgenol. 1987;148:65–9. doi: 10.2214/ajr.148.1.65. [DOI] [PubMed] [Google Scholar]
- 8.Browne RF, Zwirewich C, Torreggiani WC. Imaging of urinary tract infection in the adult. Eur Radiol. 2004;14:E168–83. doi: 10.1007/s00330-003-2050-1. [DOI] [PubMed] [Google Scholar]
- 9.Kenney PJ. Imaging of chronic renal infections. AJR Am J Roentgenol. 1990;155:485–94. doi: 10.2214/ajr.155.3.2117344. [DOI] [PubMed] [Google Scholar]
- 10.Hartman DS, Stagg PL. Diagnosis please. Case 3: Renal tuberculosis. Radiology. 1998;209:69–72. doi: 10.1148/radiology.209.1.9769814. [DOI] [PubMed] [Google Scholar]
- 11.Wang LJ, Wong YC, Chen CJ, Lim KE. CT features of genitourinary tuberculosis. J Comput Assist Tomogr. 1997;21:254–8. doi: 10.1097/00004728-199703000-00016. [DOI] [PubMed] [Google Scholar]
- 12.Pasternak MS, Rubin RH. Urinary tract tuberculosis. In: Schrier RW, editor. Diseases of the Kidney and Urinary Tract. 7th ed. Philadelphia, Pa: Lipincott Williams and Wilkins; 2001. pp. 1017–37. [Google Scholar]
- 13.Goldman SM, Fishman EK, Hartman DS, Kim YC, Siegelman SS. Computed tomography of renal tuberculosis and its pathological correlates. J Comput Assist Tomogr. 1985;9:771–6. doi: 10.1097/00004728-198507010-00020. [DOI] [PubMed] [Google Scholar]
- 14.Jung YY, Kim JK, Cho KS. Genitourinary tuberculosis: Comprehensive cross-sectional imaging. AJR Am J Roentgenol. 2005;184:143–50. doi: 10.2214/ajr.184.1.01840143. [DOI] [PubMed] [Google Scholar]
- 15.Israel GM, Bosniak MA. Pitfalls in renal mass evaluation and how to avoid them. Radiographics. 2008;28:1325–38. doi: 10.1148/rg.285075744. [DOI] [PubMed] [Google Scholar]
- 16.Kim SH. Urogenital tuberculosis. In: Pollack HM, McClennan BL, editors. Clinical Urography. 2nd ed. Philadelphia, PA: WB Saunders Co; 2000. pp. 1193–1228. [Google Scholar]
- 17.Li Y, Yang ZG, Guo YK, Min PQ, Yu JQ, Ma ES, et al. Distribution and characteristics of hematogenous disseminated tuberculosis within the abdomen on contrast-enhanced CT. Abdom Imaging. 2007;32:484–8. doi: 10.1007/s00261-006-9144-6. [DOI] [PubMed] [Google Scholar]
- 18.Wang LJ, Wu CF, Wong YC, Chuang CK, Chu SH, Chen CJ. Imaging findings of urinary tuberculosis on excretory urography and computerized tomography. J Urol. 2003;169:524–8. doi: 10.1097/01.ju.0000040243.55265.71. [DOI] [PubMed] [Google Scholar]
- 19.Goldman SM, Fishman EK. Upper urinary tract infection: The current role of CT, ultrasound, and MRI. Semin Ultrasound CT MR. 1991;12:335–60. [PubMed] [Google Scholar]
- 20.Gupta H, Kone K, Pandey S, Dorairajan LN, Kumar S. Tubercular mass mimicking a tumour in a horseshoe kidney: A unique presentation. Int Urol Nephrol. 2004;36:323–4. doi: 10.1007/s11255-004-0925-y. [DOI] [PubMed] [Google Scholar]
- 21.Gurski J, Baker KC. An unusual presentation: Renal tuberculosis. ScientificWorldJournal. 2008;8:1254–5. doi: 10.1100/tsw.2008.162. [DOI] [PMC free article] [PubMed] [Google Scholar]
- 22.Gibson MS, Puckett ML, Shelly ME. Renal tuberculosis. Radiographics. 2004;24:251–6. doi: 10.1148/rg.241035071. [DOI] [PubMed] [Google Scholar]
- 23.Engin G, Acunaş B, Acunaş G, Tunaci M. Imaging of extrapulmonary tuberculosis. Radiographics. 2000;20:471–88. doi: 10.1148/radiographics.20.2.g00mc07471. [DOI] [PubMed] [Google Scholar]
- 24.Das KM, Indudhara R, Vaidyanathan S. Sonographic features of genitourinary tuberculosis. AJR Am J Roentgenol. 1992;158:327–9. doi: 10.2214/ajr.158.2.1729792. [DOI] [PubMed] [Google Scholar]
- 25.Harisinghani MG, McLoud TC, Shepard JA, Ko JP, Shroff MM, Mueller PR. Tuberculosis from head to toe. Radiographics. 2000;20:449–70. doi: 10.1148/radiographics.20.2.g00mc12449. [DOI] [PubMed] [Google Scholar]
- 26.Buxi TB, Sud S, Vohra R. CT and MRI in the diagnosis of tuberculosis. Indian J Pediatr. 2002;69:965–72. doi: 10.1007/BF02726016. [DOI] [PubMed] [Google Scholar]
- 27.Kawashima A, Sandler CM, Ernst RD, Goldman SM, Raval B, Fishman EK. Renal inflammatory disease: The current role of CT. Crit Rev Diagn Imaging. 1997;38:369–415. [PubMed] [Google Scholar]
- 28.Muttarak M, ChiangMai WN, Lojanapiwat B. Tuberculosis of the genitourinary tract: Imaging features with pathological correlation. Singapore Med J. 2005;46:568–74. [PubMed] [Google Scholar]
- 29.Craig WD, Wagner BJ, Travis MD. Pyelonephritis: Radiologic-pathologic review. Radiographics. 2008;28:255–77. doi: 10.1148/rg.281075171. [DOI] [PubMed] [Google Scholar]
- 30.Miller FH, Parikh S, Gore RM, Nemcek AA, Jr, Fitzgerald SW, Vogelzang RL. Renal manifestations of AIDS. Radiographics. 1993;13:587–96. doi: 10.1148/radiographics.13.3.8316666. [DOI] [PubMed] [Google Scholar]
- 31.Lang EK, Macchia RJ, Thomas R, Watson RA, Marberger M, Lechner G, et al. Improved detection of renal pathologic features on multiphasic helical CT compared with IVU in patients presenting with microscopic hematuria. Urology. 2003;61:528–32. doi: 10.1016/s0090-4295(02)02408-1. [DOI] [PubMed] [Google Scholar]
- 32.Cheng VC, Yew WW, Yuen KY. Molecular diagnostics in tuberculosis. Eur J Clin Microbiol Infect Dis. 2005;24:711–20. doi: 10.1007/s10096-005-0039-1. [DOI] [PubMed] [Google Scholar]
- 33.Okazawa N, Sekiya T, Tada S. Computed tomographic features of renal tuberculosis. Radiat Med. 1985;3:209–13. [PubMed] [Google Scholar]
- 34.Becker JA. Renal Tuberculosis. Urol Radiol. 1988;10:25–30. doi: 10.1007/BF02926530. [DOI] [PubMed] [Google Scholar]
- 35.Merchant SA. Tuberculosis of the Genitourinary System. Indian J Radiol Imaging. 1993;3:253–74. [Google Scholar]
- 36.Baumgarten DA, Baumgartner BR. Imaging and radiologic management of upper urinary tract infections. Urol Clin North Am. 1997;24:545–69. doi: 10.1016/s0094-0143(05)70401-8. [DOI] [PubMed] [Google Scholar]
- 37.Rabushka LS, Fishman EK, Goldman SM. Pictorial review: Computed tomography of renal inflammatory disease. Urology. 1994;44:473–80. doi: 10.1016/s0090-4295(94)80042-1. [DOI] [PubMed] [Google Scholar]
- 38.Zissin R, Gayer G, Kots E, Werner M, Shapiro-Feinberg M, Hertz M. Iliopsoas abscess: A report of 24 patients diagnosed by CT. Abdom Imaging. 2001;26:533–9. doi: 10.1007/s002610000201. [DOI] [PubMed] [Google Scholar]
- 39.Benchekroun A, Lachkar A, Soumana A, Farih MH, Belahnech Z, Marzouk M, et al. Urogenital tuberculosis. 80 cases. Ann Urol (Paris) 1998;32:89–94. [PubMed] [Google Scholar]
- 40.Jafri SZ, Roberts JL, Berger BD. Fistulas of the genitourinary tract. In: Pollack HM, editor. Clinical Urography. 2nd ed. Philadelphia: Saunders; 2000. pp. 2992–3011. [Google Scholar]
- 41.Yu NC, Raman SS, Patel M, Barbaric Z. Fistulas of the genitourinary tract: A radiologic review. Radiographics. 2004;24:1331–52. doi: 10.1148/rg.245035219. [DOI] [PubMed] [Google Scholar]
- 42.Cooper SG, Richman AH, Tager MG. Nephrocutaneous fistula diagnosed by computed tomography. Urol Radiol. 1989;11:33–6. doi: 10.1007/BF02926470. [DOI] [PubMed] [Google Scholar]
- 43.Chen KC. Lymphatic abnormalities in patients with chyluria. J Urol. 1971;106:111–4. doi: 10.1016/s0022-5347(17)61237-0. [DOI] [PubMed] [Google Scholar]
- 44.Haynes JW, Miller PR, Zingas AP. Computed tomography and lymphangiography in chyluria. J Comput Assist Tomogr. 1984;8:341–2. [PubMed] [Google Scholar]
- 45.Shah HN, Jain P, Chibber PJ. Renal tuberculosis simulating xanthogranulomatous pyelonephritis with contagious hepatic involvement. Int J Urol. 2006;13:67–8. doi: 10.1111/j.1442-2042.2006.01227.x. [DOI] [PubMed] [Google Scholar]
- 46.Sawczuk IS, Reitelman C, Libby C, Grant D, Vita J, White RD. CT findings in Addison's disease caused by tuberculosis. Urol Radiol. 1986;8:44–5. doi: 10.1007/BF02924072. [DOI] [PubMed] [Google Scholar]
- 47.Anbarasu A, Upadhyay A, Merchant SA, Amonkar P, Devarbhavi H, Bhatnagar M. Tuberculous chylous ascites: Pathognomonic CT findings. Abdom Imaging. 1997;22:50–1. doi: 10.1007/s002619900138. [DOI] [PubMed] [Google Scholar]
- 48.Khanna PC, Merchant SA, Joshi AR. Omental cake from tuberculosis. Appl Radiol Imaging. 2007;36:5. [Google Scholar]
- 49.Georgiades CS, Neyman EG, Barish MA, Fishman EK. Amyloidosis: Review and CT manifestations. Radiographics. 2004;24:405–16. doi: 10.1148/rg.242035114. [DOI] [PubMed] [Google Scholar]
- 50.Kapoor R, Ansari MS, Mandhani A, Gulia A. Clinical presentation and diagnostic approach in cases of genitourinary tuberculosis. Indian J Urol. 2008;24:401–5. doi: 10.4103/0970-1591.42626. [DOI] [PMC free article] [PubMed] [Google Scholar]
- 51.Pedrosa I, Sun MR, Spencer M, Genega EM, Olumi AF, Dewolf WC, et al. MR imaging of renal masses: Correlation with findings at surgery and pathologic analysis. Radiographics. 2008;28:985–1003. doi: 10.1148/rg.284065018. [DOI] [PubMed] [Google Scholar]
- 52.Verswijvel G, Oyen R. Magnetic resonance imaging in the detection and characterization of renal diseases. Saudi J Kidney Dis Transpl. 2004;15:283–99. [PubMed] [Google Scholar]
- 53.Leyendecker JR, Barnes CE, Zagoria RJ. MR urography: Techniques and clinical applications. Radiographics. 2008;28:23–46. doi: 10.1148/rg.281075077. [DOI] [PubMed] [Google Scholar]
- 54.Khanna PC, Karnik ND, Jankharia BG, Merchant SA, Joshi AR, Kukreja KU. Magnetic resonance urography (MRU) versus intravenous urography (IVU) in obstructive uropathy: A prospective study of 30 cases. J Assoc Physicians India. 2005;53:527–34. [PubMed] [Google Scholar]
- 55.Buckley O, Colville J, Torreggiani WC, Leyendecker JR. Re: MR urographic techniques. Radiographics. 2008;28:907. doi: 10.1148/radiographics.28.3.0280907. author reply 907-8. [DOI] [PubMed] [Google Scholar]
- 56.Kim S, Jacob JS, Kim DC, Rivera R, Lim RP, Lee VS. Time-resolved dynamic contrast-enhanced MR urography for the evaluation of ureteral peristalsis: Initial experience. J Magn Reson Imaging. 2008;28:1293–8. doi: 10.1002/jmri.21567. [DOI] [PubMed] [Google Scholar]
- 57.Sadowski EA, Bennett LK, Chan MR, Wentland AL, Garrett AL, Garrett RW, et al. Nephrogenic systemic fibrosis: Risk factors and incidence estimation. Radiology. 2007;243:148–57. doi: 10.1148/radiol.2431062144. [DOI] [PubMed] [Google Scholar]
- 58.Matsui N, Morita T. Magnetic resonance imaging as a clue to successful diagnosis of renal tuberculosis: A case report. Cases J. 2009;2:8879. doi: 10.4076/1757-1626-2-8879. [DOI] [PMC free article] [PubMed] [Google Scholar]
- 59.Hecht EM, Israel GM, Krinsky GA, Hahn WY, Kim DC, Belitskaya-Levy I, et al. Renal masses: Quantitative analysis of enhancement with signal intensity measurements versus qualitative analysis of enhancement with image subtraction for diagnosing malignancy at MR imaging. Radiology. 2004;232:373–8. doi: 10.1148/radiol.2322031209. [DOI] [PubMed] [Google Scholar]
- 60.Holland AE, Goldfarb JW, Edelman RR. Diaphragmatic and cardiac motion during suspended breathing: Preliminary experience and implications for breath-hold MR imaging. Radiology. 1998;209:483–9. doi: 10.1148/radiology.209.2.9807578. [DOI] [PubMed] [Google Scholar]
- 61.Katsuda T, Kuroda C, Fujita M. Reducing misregistration of mask image in hepatic DSA. Radiol Technol. 1997;68:487–90. [PubMed] [Google Scholar]
- 62.Fan ZM, Zeng QY, Huo JW, Bai L, Liu ZS, Luo LF, et al. Macronodular multi-organs tuberculoma: CT and MR appearances. J Gastroenterol. 1998;33:285–8. doi: 10.1007/s005350050085. [DOI] [PubMed] [Google Scholar]
- 63.Gupta RK, Pandey R, Khan EM, Mittal P, Gujral RB, Chhabra DK. Intracranial tuberculomas: MRI signal intensity correlation with histopathology and localised proton spectroscopy. Magn Reson Imaging. 1993;11:443–9. doi: 10.1016/0730-725x(93)90079-s. [DOI] [PubMed] [Google Scholar]
- 64.Verswijvel G, Janssens F, Vandevenne J, Stessens L, Meylaerts P, Palmers Y. Renal macronodular tuberculoma: CT and MR findings in an asymptomatic patient. JBR-BTR. 2002;85:203–5. [PubMed] [Google Scholar]
- 65.Togao O, Doi S, Kuro-o M, Masaki T, Yorioka N, Takahashi M. Assessment of renal fibrosis with diffusion-weighted MR imaging: Study with murine model of unilateral ureteral obstruction. Radiology. 2010;255:772–80. doi: 10.1148/radiol.10091735. [DOI] [PMC free article] [PubMed] [Google Scholar]
- 66.Thoeny HC, Grenier N. Science to practice: Can diffusion-weighted MR imaging findings be used as biomarkers to monitor the progression of renal fibrosis? Radiology. 2010;255:667–8. doi: 10.1148/radiol.100211. [DOI] [PubMed] [Google Scholar]
- 67.Ries BG, Kauczor HU, Konerding MA, Thelen M. Diagnosis of acute lung embolism with spiral CT and 3D reconstruction. Development of an animal model and technical probe in an ex-vivo experiment. Radiologe. 2001;41:187–94. doi: 10.1007/s001170050962. [DOI] [PubMed] [Google Scholar]
- 68.Cova M, Squillaci E, Stacul F, Manenti G, Gava S, Simonetti G, et al. Diffusion-weighted MRI in the evaluation of renal lesions: Preliminary results. Br J Radiol. 2004;77:851–7. doi: 10.1259/bjr/26525081. [DOI] [PubMed] [Google Scholar]
- 69.Brennan RE, Pollack HM. Nonvisualized (“phantom”) renal calyx: Causes and radiological approach to diagnosis. Urol Radiol. 1979;1:17–23. doi: 10.1007/BF02926595. [DOI] [PubMed] [Google Scholar]
- 70.Elkin M. Boston: Little Brown and Company; 1980. Radiology of the urinary system; pp. 148–152. [Google Scholar]
- 71.Wise GJ. Urinary tuberculosis: Modern issues. Curr Urol Rep. 2009;10:313–8. doi: 10.1007/s11934-009-0051-6. [DOI] [PubMed] [Google Scholar]
- 72.Khaira A, Bagchi S, Sharma A, Mukund A, Mahajan S, Bhowmik D, et al. Renal allograft tuberculosis: Report of three cases and review of literature. Clin Exp Nephrol. 2009;13:392–6. doi: 10.1007/s10157-009-0158-6. [DOI] [PubMed] [Google Scholar]
- 73.Dowdy L, Ramgopal M, Hoffman T, Ciancio G, Burke G, Roth D, et al. Genitourinary tuberculosis after renal transplantation: Report of 3 cases and review. Clin Infect Dis. 2001;32:662–6. doi: 10.1086/318723. [DOI] [PubMed] [Google Scholar]
- 74.Mourad G, Soulillou JP, Chong G, Pouliquen M, Hourmant M, Mion C. Transmission of Mycobacterium tuberculosis with renal allografts. Nephron. 1985;41:82–5. doi: 10.1159/000183552. [DOI] [PubMed] [Google Scholar]
- 75.Altintepe L, Tonbul HZ, Ozbey I, Guney I, Odabas AR, Cetinkaya R, et al. Urinary tuberculosis: Ten years’ experience. Ren Fail. 2005;27:657–61. doi: 10.1080/08860220500234857. [DOI] [PubMed] [Google Scholar]
- 76.Zhang XF, Lv Y, Xue WJ, Wang B, Liu C, Tian PX, et al. Mycobacterium tuberculosis infection in solid organ transplant recipients: Experience from a single center in China. Transplant Proc. 2008;40:1382–5. doi: 10.1016/j.transproceed.2008.01.075. [DOI] [PubMed] [Google Scholar]
- 77.Nayak S, Satish R. Genitourinary tuberculosis after renal transplantation: A report of three cases with a good clinical outcome. Am J Transplant. 2007;7:1862–4. doi: 10.1111/j.1600-6143.2007.01853.x. [DOI] [PubMed] [Google Scholar]
- 78.George P, Pawar B, Calton N. Tuberculosis in a renal allograft: A successful outcome. Saudi J Kidney Dis Transpl. 2008;19:790–2. [PubMed] [Google Scholar]
- 79.Centers for Disease Control and Prevention (CDC). Transplantation-transmitted tuberculosis-Oklahoma and Texas, 2007. MMWR Morb Mortal Wkly Rep. 2008;57:333–6. [PubMed] [Google Scholar]
- 80.John GT, Shankar V, Abraham AM, Mukundan U, Thomas PP, Jacob CK. Risk factors for post-transplant tuberculosis. Kidney Int. 2001;60:1148–53. doi: 10.1046/j.1523-1755.2001.0600031148.x. [DOI] [PubMed] [Google Scholar]
- 81.Singh N, Paterson DL. Mycobacterium tuberculosis infection in solid-organ transplant recipients: Impact and implications for management. Clin Infect Dis. 1998;27:1266–77. doi: 10.1086/514993. [DOI] [PubMed] [Google Scholar]
- 82.Basiri A, Moghaddam SM, Simforoosh N, Einollahi B, Hosseini M, Foirouzan A, et al. Preliminary report of a nationwide case-control study for identifying risk factors of tuberculosis following renal transplantation. Transplant Proc. 2005;37:3041–4. doi: 10.1016/j.transproceed.2005.07.041. [DOI] [PubMed] [Google Scholar]
- 83.Mercadal L, Foltz V, Isnard-Bagnis C, Ourahma S, Deray G. Tuberculosis after conversion from azathioprine to mycophenolate mofetil in a long-term renal transplant recipient. Transplant Proc. 2005;37:4241–3. doi: 10.1016/j.transproceed.2005.11.010. [DOI] [PubMed] [Google Scholar]
- 84.Walker JF, Cronin CJ, O’Neill S, McNulty J, Hanson JS. Tuberculosis affecting a cadaveric renal allograft. Clin Nephrol. 1982;17:262–5. [PubMed] [Google Scholar]
- 85.Alsoub H, Al Alousi FS, Haider A. Renal allograft tuberculosis: A case report. Ann Saudi Med. 2002;22:346–8. doi: 10.5144/0256-4947.2002.346. [DOI] [PubMed] [Google Scholar]
- 86.Choi IS, Park JB, Kim SJ, Joh JW, Lee SK, Huh WS, et al. Tuberculous abscess of the graft in a renal transplant recipient after chronic rejection: Case report. Transplant Proc. 2000;32:1957–8. doi: 10.1016/s0041-1345(00)01510-4. [DOI] [PubMed] [Google Scholar]
- 87.Adeva Andany M, Falcón TG, Lozano IR, Bouza P, Alonso A, Valvuena L. Tuberculous interstitial nephritis of the renal graft. Nephron. 1994;68:143–4. doi: 10.1159/000188237. [DOI] [PubMed] [Google Scholar]
- 88.Gonçalves AR, Caetano MA, Paula FJ, Ianhez LE, Saldanha LB, Sabbaga E. Tuberculous interstitial granulomatous nephritis in renal transplants: Report of three cases. Transplant Proc. 1992;24:1911. [PubMed] [Google Scholar]
- 89.Figueiredo AA, Lucon AM, Júnior RF, Ikejiri DS, Nahas WC, Srougi M. Urogenital tuberculosis in immunocompromised patients. Int Urol Nephrol. 2009;41:327–33. doi: 10.1007/s11255-008-9436-6. [DOI] [PubMed] [Google Scholar]
- 90.Eastwood JB, Corbishley CM, Grange JM. Tuberculosis and the kidney. J Am Soc Nephrol. 2001;12:1307–14. doi: 10.1681/ASN.V1261307. [DOI] [PubMed] [Google Scholar]


