Abstract
Background
Despite accuracy standards, there are performance differences among commercially available blood glucose monitoring (BGM) systems. The objective of this analysis was to assess the potential clinical and economic impact of accuracy differences of various BGM systems using a modeling approach.
Methods
We simulated additional risk of hypoglycemia due to blood glucose (BG) measurement errors of five different BGM systems based on results of a real-world accuracy study, while retaining other sources of glycemic variability. Using data from published literature, we estimated an annual additional number of required medical interventions as a result of hypoglycemia. We based our calculations on patients with type 1 diabetes mellitus (T1DM) and T2DM requiring multiple daily injections (MDIs) of insulin in a U.S. health care system. We estimated additional costs attributable to treatment of severe hypoglycemic episodes resulting from BG measurement errors..
Results
Results from our model predict an annual difference of approximately 296,000 severe hypoglycemic episodes from BG measurement errors for T1DM (105,000 for T2DM MDI) patients for the estimated U.S. population of 958,800 T1DM and 1,353,600 T2DM MDI patients, using the least accurate BGM system versus patients using the most accurate system in a U.S. health care system. This resulted in additional direct costs of approximately $339 million for T1DM and approximately $121 million for T2DM MDI patients per year.
Conclusions
Our analysis shows that error patterns over the operating range of BGM meter may lead to relevant clinical and economic outcome differences that may not be reflected in a common accuracy metric or standard.
Keywords: accuracy, blood glucose monitoring system, clinical impact, economic impact, hypoglycemia, multiple daily injections
Introduction
For many patients with diabetes, daily self-injection of insulin and frequent self-monitoring of blood glucose (BG) are essential steps to adequately manage diabetes. Blood glucose monitoring (BGM) meters allow diabetes patients to determine their BG level and to use the information as part of their treatment program. The overall performance of BGM meters is a combination of the analytical performance of the instrument, proficiency of the patient, and quality of the test strips and the underlying measurement technology. Accurate BGM using quality BGM meters helps minimize errors in insulin dosage. 1 The importance of BG measurement system accuracy is acknowledged by health authorities in the United States and in other countries. This is evident in the efforts to update the established International Organization for Standardization (ISO) standard 15197 for BGM systems 2 to reflect tighter accuracy standards as proposed in a 2011 revision draft of this standard. 3
Despite common accuracy standards for strip-based glucose measurement systems, there are performance differences among commercially available systems.
Blood glucose monitoring meter performance is commonly evaluated by a variety of error metrics, such as the mean difference and mean absolute relative difference of meter readings versus a laboratory standard. However, no error metric can fully characterize patient-relevant implications of a meter’s accuracy profile.
For intensified insulin therapy, measurement of preprandial glycemia is key in determining prandial insulin dose. This affects postprandial glycemic excursions and, consequently, the overall level of metabolic control.
Hypoglycemia is the most common complication of insulin therapy. It is a significant cause of morbidity and mortality and is the limiting factor in successful metabolic control of diabetes.
An analysis of patients with type 2 diabetes mellitus (T2DM) from 2003 through 2008 by Curkendall and coauthors 4 estimated mean costs for treatment of a hypoglycemic event. The mean costs ranged from $285 (outpatient visit) to $10,362 (event treated in emergency room and then admitted as inpatient). 4
For patients on multiple daily injections (MDI) therapy, frequent causes of hypoglycemia are (a) missed meal, (b) wrong insulin dose, (c) unaccustomed exercise, and (d) other factors such as alcohol, renal failure, and other diseases. 5 Individuals with loss of early warning symptoms are at an increased risk of severe hypoglycemic events. 6
The role of a BGM meter in minimizing the impact of hypoglycemia is two-fold. The first is to detect hypoglycemic readings in order to avert a more serious hypoglycemic episode. The second is to prevent hypoglycemia by providing accurate readings that facilitate the matching of insulin dose to the patient’s glycemic requirements. Efficacy for the first role can be gauged from meter accuracy study results. However, they are typically not designed to assess the quantitative efficacy for the second role.
This study evaluates the clinical and economic impact of meter accuracy differences on patients adjusting their meal-time insulin doses based on their BG readings. Specifically, we model the impact of meter errors as they interact with other sources of meal- and insulin-dose-related glucose variation on the risk of hypoglycemia and the costs related to treating these events.
Methods
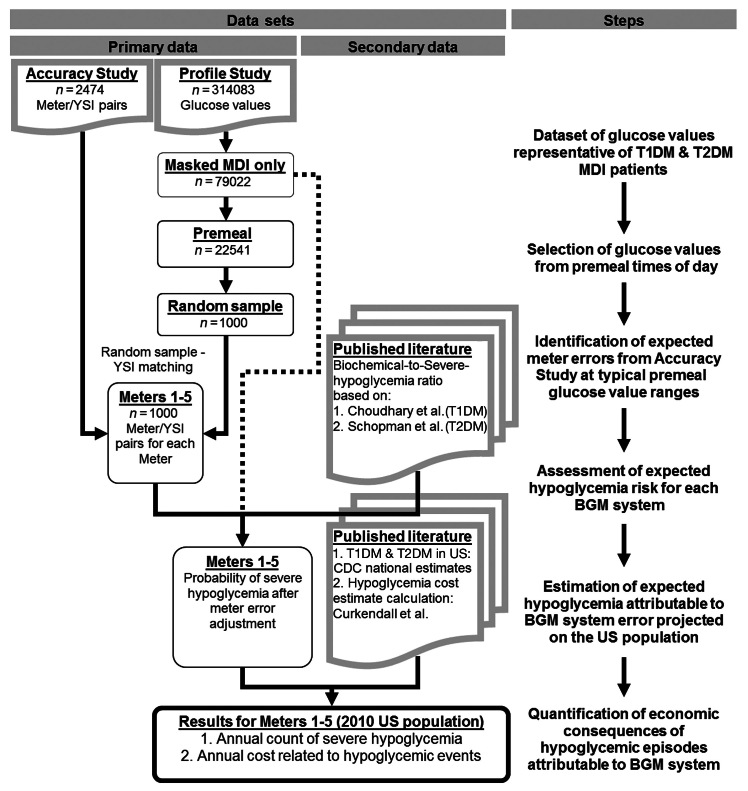
We developed a model that used several data sources to estimate the impact of meter errors on patients’ risk of severe hypoglycemic events. Calculations were performed in Excel (Microsoft Corp., Redmond, WA) and Matlab (MathWorks Inc., Natick, MA) software applications. The process is illustrated in Figure 1 .
Figure 1.
Process sequence. Choudhary and coauthors; 7 Schopman and coauthors; 8 Curkendall and coauthors. 4 CDC, Centers for Disease Control and Prevention.
Study Data Sets
The following primary data sets were used.
Population Glucose Profile Study
This study evaluated a continuous glucose monitoring (CGM) system for home-use conditions. 9 It was conducted at six clinical sites, enrolling a total of 137 T1DM and T2DM patients with at least 2 years of diagnosis of diabetes. In order to use CGM system data as a proxy for a patient’s true glucose profile in between BG measurements and under the patient’s standard care, only the masked phase from this study is used. Only patients on MDI therapy were considered. A total of 79,022 glucose data from 32 patients (15 T1DM and 17 T2DM) were eligible for this analysis.
Figure 2 shows glucose concentration distribution from eligible data within the profile study. A vertical line at 60 mg/dl delineates biochemical hypoglycemia. 7 The vertical axis corresponds to the number of observations that fall within each glucose concentration value bin. The shaded area represents the number of glucose values observed below the hypoglycemia threshold. When normalized to the total number of glucose values, this area represents hypoglycemia probability.
Figure 2.
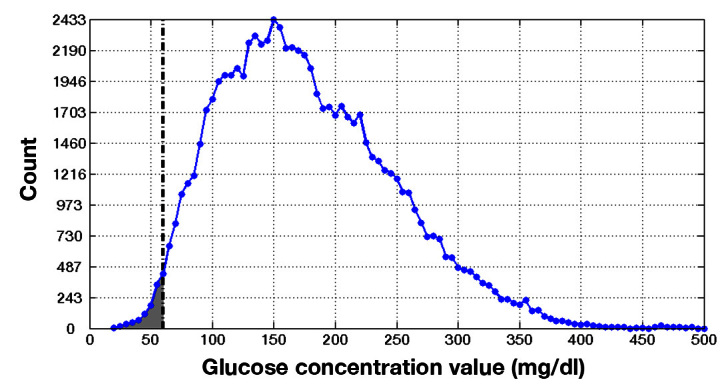
Glucose concentration distribution from the profile study.
Blood Glucose Monitoring System Accuracy Study
This study investigated the measurement performance of five BGM systems independently obtained from pharmacies 10 and analyzed a total of 453 patients (T1DM or T2DM). Each patient was randomized to three out of the five meters. Meters evaluated in the study were Accu-Chek Aviva® (Roche Diagnostics, Mannheim, Germany), Contour® (Bayer Vital GmbH, Leverkusen, Germany), FreeStyle Freedom Lite® (Abbott Diabetes Care), FreeStyle Lite (Abbott Diabetes Care Inc., Alameda, CA), and OneTouch UltraEasy® (LifeScan Inc., Milpitas, CA). For each meter, this accuracy study provided data on the meter reading after a fasting BG test performed by the patient along with reference capillary BG measurements performed by a health care professional. Reference BG measurements were analyzed using the YSI 2300 Stat Plus glucose analyzer (YSI, Yellow Springs, OH). A total of 504, 510, 488, 480, and 492 BG meter–YSI reading pairs are available for the five meters, respectively. Selection of this study as the meter-and-reference-BG paired points source was done as an example of the range of real-life error distribution in present-day BG meters. It is understood that results on a particular meter from different studies 10 – 14 may result in different performance outcomes. The comparative results in our analysis are meant to evaluate potential implications of accuracy differences using an empirical meter error distribution in lieu of an assumed error distribution (e.g. Gaussian with zero mean error and varying standard deviation). Our analysis will treat data from these meters anonymously, from meter 1 through meter 5.
Model Assumptions
Sensor glucose values obtained from the CGM system measurement in the profile study are representative of the real-world BG distribution of a U.S. T1DM and T2DM MDI patient population.
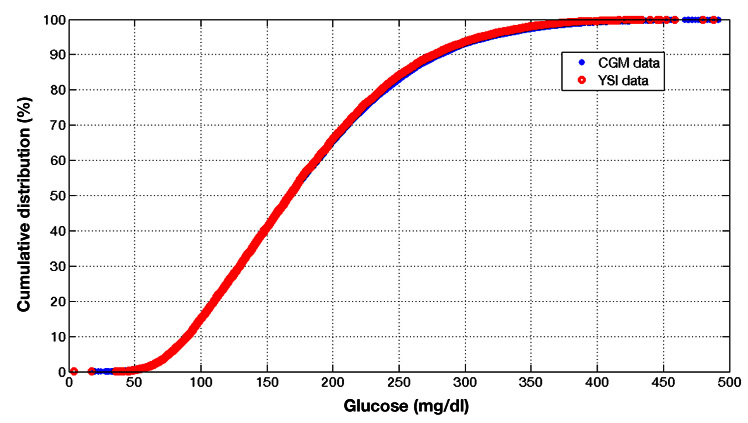
Aggregate glucose distributions of a CGM system and a BGM system are equivalent ( Appendix A ).
Sensor glucose values selected in the premeal windows from the profile study represent typical premeal glucose values of patients.
Patients calculate their insulin dose using an insulin sensitivity factor (ISF) and a defined BG target value and dose appropriately based on their calculation. After dosing, patients do not perform any postmeal testing or corrections.
Time spacing between boluses are significant enough so that insulin on board is not a factor in determining the patient’s dose.
The patient’s glucose level in response to an insulin bolus is based on a static model ( Appendix B ) that operates on premeal glucose initial conditions obtained from the profile study. The static model is the basis of standard bolus calculation involving ISF and insulin-to-carbohydrate ratio.
Expected Meter Errors at Typical Premeal Glucose Ranges
In order for BG values to be representative of those observed prior to dosing insulin, we resampled values from our accuracy study. First we drew glucose values from the profile study in time ranges representing breakfast (7:00 am–9:00 am), lunch (11:00 am–1:00 pm), and dinner (5:00 pm–8:00 pm) in order to represent true BG values prior to dosing insulin. Of the available 22,541 glucose values, 1000 random values were extracted as a pairing key. Then, for each of the 1000 values, we selected the closest YSI reading from the accuracy study and its corresponding BGM reading. The resampled pairs provide meter error data that affect subsequent glucose after dosing insulin. If more than one YSI reading matched the key, the YSI observation with the earliest “observation ID” was used. This process was repeated for each of the five BGM meters used in the accuracy study using the same 1000 pairing key values.
Assessment of the Probability of Hypoglycemia
The fraction of glucose values from the profile study up to 60 mg/dl is a proxy for the probability of hypoglycemic readings of a MDI population as depicted in Figure 2 . Given assumptions described earlier, we expect that a meter error affects a patient’s insulin administration, increasing or decreasing the insulin dose based on a linear method commonly used to calculate insulin dosing. 15 , 16
Using a linear physiological model that is the basis of the common insulin dose calculation method, 15 , 16 the impact of the insulin dose on the patient’s subsequent glucose was calculated. Our method allows for the glucose time series obtained from each patient, which were impacted by many sources of glycemic variability, to be retained. The impact of meter error enters the model as an incremental adjustment to these glucose profiles. Details on how a meter error affects a patient’s subsequent glucose distribution by an equal and opposite amount, altering the patient’s probability of hypoglycemia, are provided in Appendix B . For example, suppose a meter yields a value of 120 mg/dl when the true value is at 105 mg/dl. In addition to the proper dose that would address the true value of 105 mg/dl, the BGM meter reading results in an additional dose caused by the +15 mg/dl error. The extra dose shifts the patient’s subsequent glucose response down by 15 mg/dl, increasing the risk of hypoglycemia. The increased risk of hypoglycemia is evident in the enlarged shaded area shown in Figure 3 , relative to Figure 2 .
Figure 3.
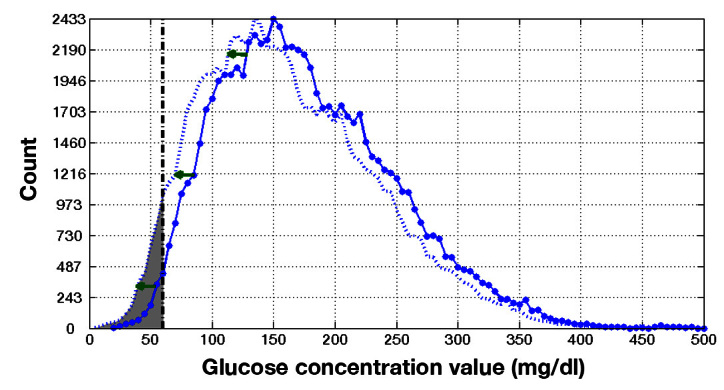
A premeal meter reading with a +15 mg/dl error results in more insulin dosed, altering the patient’s glucose distribution by -15 mg/dl.
This process was repeated for each of the 1000 random pulls for each of the five meters to obtain 1000 corresponding probabilities of hypoglycemia. From this point, only the mean values of each 1000 probabilities were retained for each meter.
Calculation of Hypoglycemia-Related Costs
We assumed three BG readings done per day, which informed insulin dosing decisions. Since the probability of hypoglycemia was based on data logged every 10 min, a hypoglycemic event could have been captured multiple times, depending on the duration of the hypoglycemic event. We assumed 113 min as the mean duration of a hypoglycemic event based on a study by Choudhary and coauthors. 7 These adjustments were used to transform the instantaneous probability of biochemical hypoglycemia for a person at any given instant to an annual mean estimated number of biochemical hypoglycemia events per person.
The percentage of biochemical hypoglycemia estimated for each meter using the error simulation modeling was used to estimate the annual burden of hypoglycemia for T1DM and T2DM MDI patients in a 2010 U.S. population. A study by Choudhary and coauthors, 7 which included 95 patients, 74 of which had normal hypoglycemia awareness and 21 had impaired hypoglycemia awareness, assessed the incidence of hypoglycemia. For these two cohorts, the mean monthly rate of biochemical hypoglycemia (0.82, 1.29) and severe hypoglycemia (0.13, 0.41) were presented. Based on these data, we calculated that 20.78% of all biochemical hypoglycemic episodes are severe hypoglycemia for T1DM patients. Severe hypoglycemia was defined as a hypoglycemic event that required assistance for recovery. 7 Schopman and coauthors 8 presented similar data for an insulin-using T2DM population, resulting in 5.24% severe hypoglycemia among all hypoglycemic episodes. These ratios, 20.78% and 5.24%, translate mean annual biochemical hypoglycemic events into mean annual severe hypoglycemic events.
The 2010 U.S. diabetes population was used to calculate the impact of the prevalence of hypoglycemia. Within the diabetes population, we assumed a 1:9 ratio of T1DM and T2DM patients. 17 Among T1DM patients, 51% were assumed to perform MDI, and among T2DM patients, 8% were assumed to perform MDI, based on estimates acquired from Roper Consulting (personal communication, 2011). These adjustments transform mean annual severe hypoglycemic events per person into total estimated annual severe hypoglycemic events within the U.S. population.
Based on a study by Curkendall and coauthors, 4 the average treatment costs per hypoglycemic episode for insulin-using patients were calculated based on a weighted average by type of visit (outpatient visit, emergency room visit, inpatient visit) by patient (insulin only, insulin + sulfonylurea, insulin + nonsulfonylurea, noninsulin antidiabetic drug). This study estimated costs using commercial and Medicare supplemental databases. All costs were standardized to 2010 using the medical care consumer price index.
We then calculated the overall hypoglycemia-related cost for T1DM and T2DM MDI patients in the United States, taking into account epidemiology, probability of severe hypoglycemia, and estimated mean cost to treat a hypo-glycemic episode.
Results
The mean and standard deviation of meter errors are presented in Table 1 . Meter 4 had a mean error closest to zero and the lowest standard deviation. In contrast, meter 1 and meter 2 have mean error values farthest from zero. Meter 2 and meter 5 have the highest standard deviation of meter error. Meter 2, meter 3, and meter 4, on average, measured lower than the actual YSI reading. Intuitively, a negative mean error (i.e., reading lower than YSI) is associated with a lower risk for hypoglycemia due to glucose undercorrection.
Table 1.
Meter Error of Resampled Data
| Meter 1 | Meter 2 | Meter 3 | Meter 4 | Meter 5 | |
| Mean error (mg/dl) | 4.0 | -4.0 | -2.9 | -1.0 | 2.5 |
| Standard deviation (mg/dl) | 10.2 | 18.5 | 15.5 | 9.9 | 18.2 |
For each meter, the 1000 resampled BGM meter combined with glucose time series from the profile study resulted in 1000 estimates of the probability of hypoglycemia. The mean values for the probability of biochemical hypoglycemia for meter 1 through meter 5 are presented in Figure 4 . The horizontal dashed line (1.93%, Appendix C ) represents the baseline hypoglycemia probability of the population based on the profile study.
Figure 4.
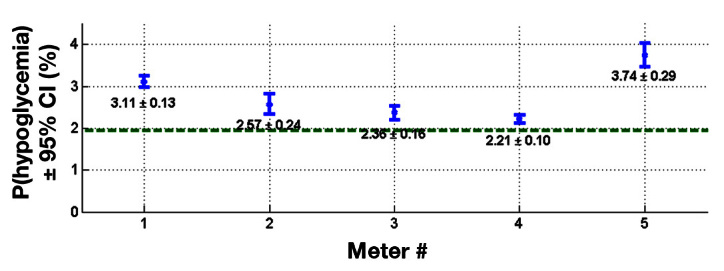
Mean probability of biochemical hypoglycemia relative to baseline value.
The 95% confidence interval (CI) bounds suggest that the mean probabilities of hypoglycemia for the five meters are distinctly different than the baseline. Moreover, within their CI ranges, meter 1 and meter 5 have higher mean probabilities of hypoglycemia relative to meter 3 and meter 4.
Based on these data, we estimated the probability of severe hypoglycemic episodes for T1DM ( Table 2 ) and T2DM MDI patients ( Table 3 ). Meter 4 had the lowest incidence of severe hypoglycemia (at 426,000 for T1DM and 152,000 for T2DM MDI patients), while meter 5 had the highest (at 722,000 for T1DM and 257,000 for T2DM MDI) for both populations T1DM and T2DM MDI patients, respectively.
Table 2.
Annual Hypoglycemia Prevalence and Costs for Type 1 Diabetes Mellitus Patients
| T1DM | Meter 1 | Meter 2 | Meter 3 | Meter 4 | Meter 5 | Baseline |
| Percentage of biochemical hypoglycemia (≤ 60 mg/dl) | 3.11 | 2.57 | 2.36 | 2.21 | 3.74 | 1.93 |
| Duration correction (mean duration of event = 113 min) | ||||||
| Percentage of biochemical hypoglycemia (≤ 60 mg/dl) | 0.28 | 0.23 | 0.21 | 0.20 | 0.33 | 0.17 |
| Annual estimates | ||||||
| Number of biochemical hypoglycemia per year (three mealtime tests per day) | 3.01 | 2.49 | 2.29 | 2.14 | 3.62 | 1.87 |
| Number of severe hypoglycemia | 0.63 | 0.52 | 0.47 | 0.44 | 0.75 | 0.39 |
| Hypoglycemia prevalence | ||||||
| T1DM MDI patients ( n ) | 958,800 | 958,800 | 958,800 | 958,800 | 958,800 | 958,800 |
| Severe hypoglycemia per year ( n ) | 600,151 | 495,945 | 455,420 | 426,474 | 721,725 | 372,441 |
| Hypoglycemia-related costs | ||||||
| Overall visit related costs ($) | 688,373,280 | 568,848,659 | 522,366,862 | 489,165,579 | 827,818,671 | 427,189,849 |
Table 3.
Annual Hypoglycemia Prevalence and Costs for Type 2 Diabetes Mellitus Patients
| T2DM | Meter 1 | Meter 2 | Meter 3 | Meter 4 | Meter 5 | Baseline |
| Duration correction (mean duration of event = 113 min) | ||||||
| Percentage of biochemical hypoglycemia (≤ 60 mg/dl) | 0.28 | 0.23 | 0.21 | 0.20 | 0.33 | 0.17 |
| Number of biochemical hypoglycemia per year (three tests per day) | 3.01 | 2.49 | 2.29 | 2.14 | 3.62 | 1.87 |
| Number of severe hypoglycemia | 0.16 | 0.13 | 0.12 | 0.11 | 0.19 | 0.10 |
| Hypoglycemia prevalence | ||||||
| T2DM MDI patients ( n ) | 1,353,600 | 1,353,600 | 1,353,600 | 1,353,600 | 1,353,600 | 1,353,600 |
| Severe hypoglycemia per year ( n ) | 213,756 | 176,641 | 162,207 | 151,897 | 257,057 | 132,652 |
| Hypoglycemia-related costs | ||||||
| Overall visit related costs ($) | 245,177,784 | 202,606,722 | 186,051,309 | 174,226,014 | 294,844,023 | 152,152,130 |
The differences between severe hypoglycemic episodes attributable to a meter’s specific error profile also translated into corresponding cost differences to treat these events ( Table 2 for T1DM, Table 3 for T2DM). Our results showed incremental costs of approximately $339 million for T1DM and $121 million for T2DM patients if the least accurate meter of this study was assumed to inform insulin self-dosing decisions for patients in the United States.
Discussion
The five BGM meters evaluated in this analysis are on-market meters and have demonstrated compliance with ISO standards during their market approval process as well as in a variety of studies. 10 – 14 Within the boundaries of this standard, meters can have very different performance profiles and error patterns.
In real life, errors associated with a single BG meter test might not have a significant impact on dosing pattern. But looking at dosing decisions over a longer period of time and a large population base, we have to assume that patients sometimes reach a cut-off point where the meter error drives a change in an insulin dosing decision. There are little data available concerning clinical and economic implications of accuracy differences among different meters. Our analysis attempts to relate meter error to its clinical and economic consequences, focusing on hypoglycemia.
The results of our analysis show a difference in meter error-driven costs of hypoglycemia of approximately $339 million for T1DM patients and of approximately $121 million for T2DM patients. These differences were based on the finding that we expected almost 300,000 additional severe hypoglycemic episodes for T1DM patients and 105,000 severe hypoglycemic episodes for T2DM patients simulated to use meter 5 versus meter 4. These data support the view that use of more/most accurate meters can help patients avoid (severe) hypoglycemic episodes and ultimately have large budgetary implications, potentially saving the U.S. health care system over $500 million a year.
However, there may be a point where additional accuracy beyond what is found in current meters provides marginal benefit, given the fact that meter accuracy is only one of the key variables that impact the probability that a patient will make appropriate dosing decisions. Other potentially important factors include a patient’s compliance with testing, numeracy skills, cognitive function during a hypoglycemic episode, and willingness to calculate appropriate dosing decisions based on a meter reading. Numerous other factors may be related to other lifestyle aspects, insulin stacking, and errors in carbohydrate counting.
Our simulation study combines empirical BGM meter error study data, empirical patient BG distribution representative of daily life, a model that determines the impact of BGM meter error on insulin dosing error (leading to each patient’s altered glucose values), a calculation of the resulting risk of hypoglycemia from the altered glucose values, and a calculation of health care costs associated with the risk of hypoglycemia (taking into account a number of assumptions, which may be questioned).
This analysis assumes a linear model in dosing that is the standard of care for MDI patients. The coupling of other sources of error and variability was addressed by considering the effect of each of the 1000 random BGM meter errors on all the population’s glucose distribution data from the profile study instead of only against one randomly paired postprandial glucose time series. A more complex model such as the many variations of the minimal model 18 – 22 introduces additional factors. Combined, these may affect the likelihood of some of the 1000 simulated cases reaching hypoglycemia relative to what is predicted by the linear model.
Given the fact that BGM systems have a distinct error pattern over its dynamic measurement range, we wanted to reflect as much as possible typical glucose ranges. Accordingly, we used retrospective in-home CGM system data from defined daily time windows to select appropriate true YSI readings that correspond to typical real-world premeal testing values. Because each individual may have different meal timing habits, whose day-to-day regularity may in itself vary, this time-of-day-based selection method of premeal glucose values may include other periods that are unrelated for the simulation of the effects of meal bolus errors.
In our simulation model, we carried forward the distribution of meter errors based on the findings of the resampled accuracy study data until we were able to come up with a mean expected value for the incremental probability of hypoglycemia due to specific BGM meter accuracy characteristics. Without carrying forward the error distribution unique to each meter, the linear model can only relate the mean meter error to the probability of hypoglycemia and, consequently, to the costs associated with hypoglycemia. This simpler alternative will predict that meter 2, having the most negative mean meter error, poses the lowest probability of hypoglycemia and, consequently, incurs the smallest cost associated with hypoglycemia. Our analysis suggests that the relatively higher standard deviation of error matters enough, such that meter 2 is not associated with the lowest probability of hypoglycemia.
This analysis investigated the incremental clinical and economic costs associated with various BGM meter accuracy levels. Specifically, meter accuracy was linked to hypoglycemia. Other clinical risks such as diabetic ketoacidosis and the many chronic complications associated to extended exposure to hyperglycemia may show a qualitatively different ranking among the meters tested. Error metrics other than mean and standard deviation of error may be a better predictor for these other clinical risks.
Due to the multiplicity of assumptions used in our simulation approach, we acknowledge that the true impact of meter accuracy on hypoglycemic events may be substantially different from the findings in our study.
One potential factor that could affect the quantitative outcome of our analysis is the assumption that all MDI patients calculate their insulin dose using an ISF to meet a defined BG target value. In a real-world setting, this may not be true for all patients. This could reduce the effective number of patients included in the population-based analysis for all the BGM meters.
A second potential factor is the strict adherence to each patient’s calculated dose correction based on the BGM meter reading and their target BG value. In reality, some instances resulted in the patient overriding the calculation and applying less or more dose for a variety of reasons.
Another potential factor is the use of the profile study to reflect the baseline population glucose profile and to implicitly introduce other sources of variability into the analysis. Examples of sources of variability include intrapatient and interpatient variations of physiology, lifestyle variations, meal pattern variations, and a host of other real-life sources of challenge for glycemic control. These sources of variability capture real-life nuances that provide robustness in our analysis. One exception is the contribution of the original BGM meter error on the glucose profile of the profile study. Ideally, we would like to remove or compensate for this factor before using the profile study data. However, the impact of the original BGM meter cannot be readily separated from the many favorable sources of variability. We expect that removing the effect of the original BGM meter error, if possible, would provide a greater reduction of hypoglycemia probability and cost for the best meter relative to the worst. As a result, the gap between the best and worst meter in terms of hypoglycemia probability and cost will be larger than predicted by our analysis. In that sense, our analysis estimates a lower benefit for the best meter relative to the worst than would have been observed in real life.
Further research will be required to validate or revise the findings of our study.
Conclusions
A simulation of performance differences of various commercially available BG measurement systems revealed potentially significant public health implications with high economic impact on the U.S. health care system. Our analysis allows for the selection of BGM meter error data from an accuracy study and its use to adjust patient glucose time series from a profile study while retaining other sources of variability as experienced by the patients during the profile study. Results from BGM meters with the most positive mean error affirm the expectation that higher mean error is associated with higher probability of hypoglycemia. In addition, our analysis also suggests that, within the range of accuracy attained by on-market BGM meters, merely having a negative mean error does not guarantee the lowest probability of hypoglycemia.
Acknowledgments
We thank our colleagues, Mindy Cheng, Lynne Lyons, Ron Ng, and Tim Dunn, for providing insightful feedback.
Glossary
- (BG)
blood glucose
- (BGM)
blood glucose monitoring
- (CGM)
continuous glucose monitoring
- (CI)
confidence interval
- (ISF)
insulin sensitivity factor
- (ISO)
International Organization for Standardization
- (MDI)
multiple daily injections
- (T1DM)
type 1 diabetes mellitus
- (T2DM)
type 2 diabetes mellitus
Appendix A. Comparison of Continuous Glucose Monitoring and Blood-Glucose-Based Glucose Distribution
Figure 5 shows a comparison of paired CGM and reference BG cumulative distribution from an unmasked CGM system study. 23 Reference BG measurements were assayed using the YSI 2300 Stat Plus glucose analyzer. Both cumulative distributions demonstrate aggregate equivalence of the two glucose measurement sources. Note that this does not imply temporal equivalence in the sense that CGM and reference BG measurements taken from a patient at any given time are equivalent.
Figure 5.
Paired CGM and reference BG cumulative distribution from a study demonstrates aggregate equivalence of the two glucose measurement sources.
Appendix B: Effect of Blood Glucose Monitoring Meter Error on Patient Glucose
Consider a static model governing the effect of meals and insulin on a patient’s glucose concentration. 15 Let G r represent the patient’s true (/reference) BG concentration before the latest insulin dose. Assume that, for a given patient, ISF S f is perfectly known and used by the patient to calculate the bolus component intended to maintain a target BG, G t . For this calculation, we also assume that the number of carbohydrates in meal C m and the patient’s insulin-to-carbohydrate ratio R ic is determined correctly.
Then, for each event, insulin dose I is given as the sum of BG-target-related dose I BG and meal-related dose I m :
The meal-related dose depends on the amount of carbohydrates in the meal and the patient’s insulin-to-carbohydrate ratio:
Alternatively, patients with a fixed meal bolus plus a target BG correction simply use a fixed value of I m . Blood-glucose-target-related dose I BG adjusts for the discrepancy between the measured premeal BGM meter reading, G BGM , to the patient’s BG target, G t :
Once the postprandial peak has been attenuated, the patient’s baseline glucose concentration level G b can be expressed in terms of the BG-target-related bolus baseline glucose G bBG and meal-related bolus baseline glucose G bm :
Since it was assumed that the patient had perfectly estimated the number of carbohydrates in each meal, C m , and has perfect knowledge of R ic , then I m will result in the exact opposite effect of the glycemic excursion due to the uncompensated meal, G mu . Hence, G bm is zero. Appendix D discusses the impact of relaxing this assumption as well as introducing other sources of variability. The baseline glucose concentration level, G b , is then equal to
Noting that BG meter error G e is defined as G e = G BGM - G r , then
In the absence of BGM meter error, the resulting baseline glucose concentration level, G b , is identical to the target glucose concentration level, G t . This can be illustrated in Figure 6 , where a BGM measurement without error results in subsequent patient glucose concentration values as shown. Even when there is no BGM measurement error, there will be a certain level of postprandial peak and transient before approaching a steady value near target G t . The population’s glucose profile, represented by the values in the profile study data as shown in Figure 2 , is the result of aggregating glucose values from postprandial time series as with the example in Figure 6 .
Figure 6.
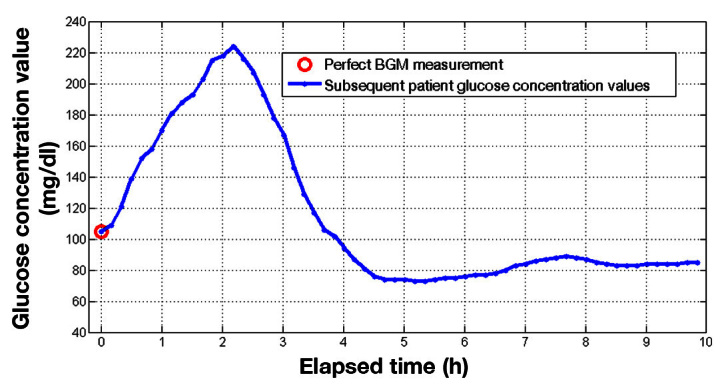
An example of a patient’s glucose concentration values several hours after a premeal bolus.
In the presence of BGM meter error, the baseline glucose concentration is offset by the opposite amount of the BGM meter error. In other words, shift G d is equal to the difference between the resultant baseline and the target value:
For example, if the BGM meter reads 15 mg/dl higher ( Figure 7 ), then, given the earlier assumptions, the extra insulin dose would result in a baseline glucose concentration level 15 mg/dl lower than the desired target.
Figure 7.
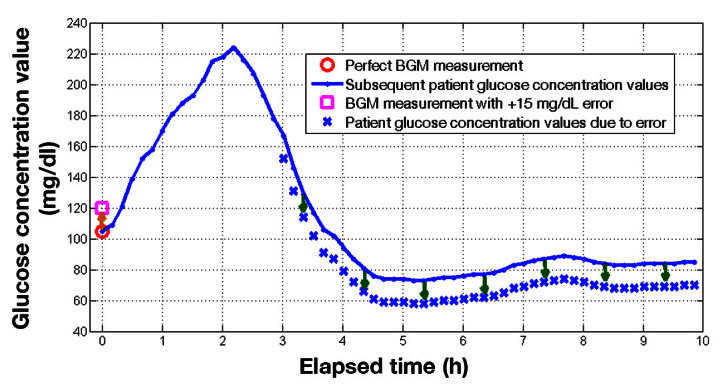
A BGM measurement with a +15 mg/dl error increases insulin dose beyond the ideal amount. The extra insulin alters the patient’s glucose concentration by -15 mg/dl as shown.
The glucose profiles taken from the profile study was not obtained under zero BGM meter error and may have included a variety of real-life reasons for not being able to reach the target glucose. Examples of these reasons include physiological variations in each patient’s ISF, carbohydrate counting discrepancies, effect of fat content or insulin pharmacodynamics on the plasma insulin’s time profile ability to match the rate of glucose appearance, exercise, and endogenous insulin production confounding the otherwise proper insulin dose. Patients with T2DM as well as a subset of patients with T1DM who have a positive C-peptide reading can affect the overall insulin dose, especially if a meal requires a relatively small insulin dose.
However, within the linear model assumption, the alterations of the patient’s subsequent glucose concentration due to these various sources are linear. Since all the BGM meters are simulated using the same population glucose profile, the incremental differences are comparable. Rather than shifting only a postprandial glucose time series paired with each BGM meter error information, the entire glucose value from the profile study is shifted with each BGM meter error value. This results in the alteration of the risk of hypoglycemia as illustrated in Figure 3 .
It is then argued that, under this model, the entire glucose response, including the postprandial peak and any subsequent hypoglycemia or hyperglycemia, is offset by the opposite amount of the BGM meter error used for each dosing of insulin. Appendix D discusses the impact when other sources of error are explicitly incorporated into the model.
Appendix C: Baseline Probability of Hypoglycemia
The baseline probability of hypoglycemia is calculated using the profile study data comprising 79,022 glucose values from 32 patients. To obtain statistical measures beyond the mean expected value of hypoglycemia, bootstrapping with case resampling 24 is used. For each of the 1000, 1 patient out of 32 is randomly selected for removal. Glucose values from the available 79,022 values corresponding to this patient are removed and randomly replaced by values from the other 31 patients. The result is 1000 sets of 79,022 glucose values. For each of these sets, a cumulative distribution function is generated in order to calculate the probability of hypoglycemia.
From the 1000 values of probability of hypoglycemia obtained via this bootstrap method, the mean baseline probability of hypoglycemia is 1.93%, with a 95% CI of ±0.01%. The lower quartile, median, and upper quartile values are 1.91%, 1.96%, and 1.99%, respectively.
Appendix D: Coupling of Blood Glucose Monitoring Meter Error and Other Sources of Variability on Patient Glucose
Suppose the static model governing the effect of meals and insulin on a patient’s glucose used in Appendix B is not only affected by BGM meter error, but also has several other sources of variability. Then it can be shown that, on average, a BGM meter error in the amount of G e will generally shift the patient’s subsequent glucose values by -G e . However, the distribution of the actual shift will see a wider spread depending on the extent of the other sources of variability. Instead of knowing the real insulin-to-carbohydrate-ratio R ic , real amount of carbohydrates in a meal C m , and real ISF S f , the patient will use their best estimate equivalent values. These estimates, along with BGM meter measurement G BGM , which was the only source of error in the analysis presented in Appendix B, govern the calculation of insulin dose I:
Once the postprandial peak has been attenuated, then the patient’s baseline glucose concentration level G b can be expressed in terms of BG-target-related bolus baseline glucose G bBG and meal-related bolus baseline glucose G bm :
By definition, the glycemic excursion due to an uncompensated meal, G mu , should be identical to the product of the patient’s true insulin-to-carbohydrate ratio R ic and the amount of carbohydrates in meal C m , normalized by the patient’s true ISF S f . Performing this substitution to the calculation of the baseline level of the patient’s subsequent glucose yields the following relationship:
Suppose the estimated values can be characterized in terms of the true (but unknown) values and additive error terms as follows:
Substituting for these definitions yields the following expression for baseline glucose:
By definition, the deviation of G b from its target glucose level G t is the amount of shift incurred as a result of the various sources of error. This deviation, G d , is then equal to
Unlike in the simpler case presented in Appendix B, the resultant shift is no longer determined purely by the first term on the right-hand side, the BGM meter error. In addition, other sources of variability will adjust each shift according to the net contribution of each of the additional elements. In general, the variability of G d applied onto the population data will increase the spread of the probability of hypoglycemia distribution. Depending on the specific distribution properties of BGM meter error and the other sources of variability, there may also be an aggregate bias on the mean probability of hypoglycemia.
Funding
This work was funded by Abbott Diabetes Care Inc., Alameda, CA.
Disclosures
The authors are full-time employees of Abbott Diabetes Care Inc.
References
- 1.Ginsberg BH. Factors affecting blood glucose monitoring: sources of errors in measurement. J Diabetes Sci Technol. 2009;3(4):903–13. doi: 10.1177/193229680900300438. [DOI] [PMC free article] [PubMed] [Google Scholar]
- 2.International Organization for Standardization. Geneva: International Organization for Standardization; 2003. In vitro diagnostic test systems -- requirements for blood-glucose monitoring systems for self-testing in managing diabetes mellitus. ISO 15197:2003. [Google Scholar]
- 3.International Organization for Standardization. Geneva: International Organization for Standardization; 2011. In vitro diagnostic test systems -- requirements for blood-glucose monitoring systems for self-testing in managing diabetes mellitus. ISO 15197:2011. (Draft.) [Google Scholar]
- 4.Curkendall SM, Zhang B, Oh KS, Williams SA, Pollack MF, Graham J. Incidence and cost of hypoglycemia among patients with type 2 diabetes in the United States: analysis of a health insurance database. J Clin Outcomes Manage. 2011;18(10):455–62. [Google Scholar]
- 5.American Diabetes Association. Standards of medical care in diabetes--2011. Diabetes Care. 2011;34(Suppl 1):S11–61. doi: 10.2337/dc11-S011. [DOI] [PMC free article] [PubMed] [Google Scholar]
- 6.Amiel SA, Dixon T, Mann R, Jameson K. Hypoglycaemia in type 2 diabetes. Diabet Med. 2008;25(3):245–54. doi: 10.1111/j.1464-5491.2007.02341.x. [DOI] [PMC free article] [PubMed] [Google Scholar]
- 7.Choudhary P, Geddes J, Freeman JV, Emery CJ, Heller SR, Frier BM. Frequency of biochemical hypoglycaemia in adults with Type 1 diabetes with and without impaired awareness of hypoglycaemia: no identifiable differences using continuous glucose monitoring. Diabet Med. 2010;27(6):666–72. doi: 10.1111/j.1464-5491.2010.03006.x. [DOI] [PubMed] [Google Scholar]
- 8.Schopman JE, Geddes J, Frier BM. Prevalence of impaired awareness of hypoglycaemia and frequency of hypoglycaemia in insulin-treated type 2 diabetes. Diabetes Res Clin Pract. 2010;87(1):64–8. doi: 10.1016/j.diabres.2009.10.013. [DOI] [PubMed] [Google Scholar]
- 9.Bode B, Silver M, Weiss R, Martin K. Evaluation of a continuous glucose monitoring system for home-use conditions. Manag Care. 2008;17(8):40–5. [PubMed] [Google Scholar]
- 10.Tack C, Pohlmeier H, Behnke T, Schmid V, Grenningloh M, Forst T, Pfützner A. Accuracy evaluation of five blood glucose monitoring systems obtained from the pharmacy: a European multicenter study with 453 subjects. Diabetes Technol Ther. 2012;14(4):330–7. doi: 10.1089/dia.2011.0170. [DOI] [PMC free article] [PubMed] [Google Scholar]
- 11.Harrison B, Leazenby C, Halldorsdottir S. Accuracy of the CONTOUR® blood glucose monitoring system. J Diabetes Sci Technol. 2011;5(4):1009–13. doi: 10.1177/193229681100500425. [DOI] [PMC free article] [PubMed] [Google Scholar]
- 12.Freckmann G, Baumstark A, Jendrike N, Zschornack E, Kocher S, Tshiananga J, Heister F, Haug C. System accuracy evaluation of 27 blood glucose monitoring systems according to DIN EN ISO 15197. Diabetes Technol Ther. 2010;12(3):221–31. doi: 10.1089/dia.2009.0128. [DOI] [PubMed] [Google Scholar]
- 13.Freckmann G, Schmid C, Baumstark A, Pleus S, Link M, Haug C. System accuracy evaluation of 43 blood glucose monitoring systems for self-monitoring of blood glucose according to DIN EN ISO 15197. J Diabetes Sci Technol. 2012;6(5):1060–75. doi: 10.1177/193229681200600510. [DOI] [PMC free article] [PubMed] [Google Scholar]
- 14.Kristensen GB, Monsen G, Skeie S, Sandberg S. Standardized evaluation of nine instruments for self-monitoring of blood glucose. Diabetes Technol Ther. 2008;10(6):467–77. doi: 10.1089/dia.2008.0034. [DOI] [PubMed] [Google Scholar]
- 15.Wolpert H. Alexandria: American Diabetes Association; 2002. Smart pumping. [Google Scholar]
- 16.Walsh J, Roberts R. 4th ed. San Diego: Torrey Pines Press; 2006. Pumping insulin: everything in a book for successful use of an insulin pump. [Google Scholar]
- 17.Centers for Disease Control and Prevention. Atlanta: U.S. Department of Health and Human Services, Centers for Disease Control and Prevention; 2011. National diabetes fact sheet: national estimates and general information on diabetes and prediabetes in the United States, 2011. [Google Scholar]
- 18.Bergman RN, Phillips LS, Cobelli C. Physiologic evaluation of factors controlling glucose tolerance in man: measurement of insulin sensitivity and beta-cell glucose sensitivity from the response to intravenous glucose. J Clin Invest. 1981;68(6):1456–67. doi: 10.1172/JCI110398. [DOI] [PMC free article] [PubMed] [Google Scholar]
- 19.Roy A, Parker RS. Dynamic modeling of exercise effects on plasma glucose and insulin levels. J Diabetes Sci Technol. 2007;1(3):338–47. doi: 10.1177/193229680700100305. [DOI] [PMC free article] [PubMed] [Google Scholar]
- 20.Hovorka R, Powrie JK, Smith GD, Sönksen PH, Carson ER, Jones RH. Five-compartment model of insulin kinetics and its use to investigate action of chloroquine in NIDDM. Am J Physiol. 1993;265(1 Pt 1):E162–75. doi: 10.1152/ajpendo.1993.265.1.E162. [DOI] [PubMed] [Google Scholar]
- 21.Wilinska ME, Bodenlenz M, Chassin LJ, Schaller HC, Schaupp LA, Pieber TR, Hovorka R. Interstitial glucose kinetics in subjects with type 1 diabetes under physiologic conditions. Metabolism. 2004;53(11):1484–91. doi: 10.1016/j.metabol.2004.05.014. [DOI] [PubMed] [Google Scholar]
- 22.Breton MD. Physical activity-the major unaccounted impediment to closed loop control. J Diabetes Sci Technol. 2008;2(1):169–74. doi: 10.1177/193229680800200127. [DOI] [PMC free article] [PubMed] [Google Scholar]
- 23.Weinstein RL, Schwartz SL, Brazg RL, Bugler JR, Peyser TA, McGarraugh GV. Accuracy of the 5-day FreeStyle Navigator Continuous Glucose Monitoring System: comparison with frequent laboratory reference measurements. Diabetes Care. 2007;30(5):1125–30. doi: 10.2337/dc06-1602. [DOI] [PubMed] [Google Scholar]
- 24.Efron B, Tibshirani RJ. Boca Raton: Chapman and Hall/CRC; 1993. An introduction to the bootstrap. [Google Scholar]


