

Abstract
Background
Treatment response in patients with type 2 diabetes mellitus (T2DM) varies because of different genotypic and phenotypic characteristics. Results of clinical trials are based largely on aggregated estimates of treatment effect rather than individualized outcomes. This research assessed heterogeneity and differential treatment response using the subgroup identification based on differential effect search (SIDES) algorithm with data from a large multinational study.
Methods
This was a retrospective analysis of the DURABLE trial, a randomized, open-label, two-arm, parallel study. The trial enrolled 2091 insulin-naïve T2DM patients aged 30 to 80 years. Patients received twice-daily insulin lispro mix 75/25 (LM75/25) or once-daily insulin glargine (insulin glargine). The SIDES methodology was used to find subgroups where the treatment effect was substantially different from what was observed in the full population of the clinical trial. A subgroup identification tool implementing the SIDES algorithm was used to examine data for 1092 patients (584 LM75/25 and 508 insulin glargine), achieving at-goal 12- or 24-week glycated hemoglobin A1c (A1C) (≤7.0%).
Results
The overall at-goal population treatment difference (A1C reduction) was not clinically meaningful, but a clinically meaningful difference was observed (A1C reduction 2.31% ± 0.06% LM75/25 versus 2.01% ± 0.07% insulin glargine; p = .001) in patients with a baseline fasting insulin level >11.4 μIU/ml and age ≤56 years.
Conclusions
The observation that younger patients with higher levels of fasting insulin may benefit from a regimen that includes short-acting insulin targeting postprandial glycemia helps explain the heterogeneity in response and warrants further investigation.
Keywords: differential treatment response, heterogeneity, insulin, predictors of treatment effect, subgroup identification based on differential effect, search, subgroup identification
Introduction
Type 2 diabetes mellitus (T2DM) is a prevalent, complex metabolic disorder, and T2DM management is challenging due to multiple treatment options and individual patient responses, which vary due to genotypic and phenotypic characteristics.1–5 Factors such as illness severity, sociodemographic characteristics, and specific clinical factors [e.g., baseline glycated hemoglobin A1c (A1C), insulin sensitivity, body composition, and duration of disease] may also affect diabetes management.9 Results of clinical trials tend to report aggregated estimates of treatment effect rather than individualized outcomes. Knowledge of a specific subgroup of individuals who might benefit most from certain treatment is of special interest for patients, physicians, payers, and other stakeholders.
Accordingly, the concept of tailoring treatment is an important factor in managing diabetes. The objective of this exploratory analysis was to apply the subgroup identification based on differential effect search (SIDES) algorithm in order to identify subgroups of patients with differential treatment response who may benefit most from twice-daily insulin lispro mix 75/25 (LM75/25) or once-daily insulin glargine (insulin glargine) treatment among those who successfully responded to either treatment [achieved at-goal 12- or 24-week A1C (≤7.0%)]. This study sought to help explain heterogeneity, not to develop a predictive algorithm for patient response given the pretreatment characteristics. Further, we sought to generate preliminary hypotheses that could be tested in confirmatory prospective randomized studies.
Methods
Data Source
All Eli Lilly and Company-sponsored trials comparing LM75/25 with insulin glargine were considered for inclusion in this analysis (n = 5). Given the small sample size of some of the studies, the heterogeneity of the patient populations and treatment algorithms, and the availability of detailed blood glucose measurements across these studies, we decided to limit the current analysis to the DURABLE (Assessing the DURAbility of Basal versus Lispro mix 75/25 insulin Efficacy) study. The relatively large sample size (n = 2091), availability of both fasting and postprandial blood glucose measurements, and inclusion of a diverse multinational population were major considerations. The DURABLE trial results have been reported previously and included measures of safety, efficacy, and the durability of glycemic control associated with initiating insulin therapy with analog basal insulin or premixed analog insulin in patients unable to achieve adequate glycemic control (A1C ≤ 7.0%) while taking multiple oral antidiabetic medications (OAMs).10-12
In the current study, we performed a retrospective analysis of the DURABLE trial’s 24-week initiation phase, a randomized, open-label, two-arm, parallel study conducted at 242 centers in 11 countries.11 The DURABLE trial had two phases, the initiation phase where all patients modified their dose to attain A1C ≤ 7.0% and the maintenance phase where patients who reached the goal were monitored for an additional 24 months to evaluate how long the A1C goal could be maintained. The initiation phase of the trial enrolled 2091 insulin-naïve patients (1045 to LM75/25, 1046 to insulin glargine) with T2DM (World Health Organization classification13) aged 30 to 80 years with A1C > 7.0% who had been taking at least two OAMs for 90 days. Patients were excluded if they had a history of scheduled long-term insulin use; recent use of other antihyperglycemic agents; body mass index (BMI) > 45 kg/m2; recent history of severe hypoglycemia; significant concomitant hematologic, oncological, renal, cardiac, hepatic, or gastrointestinal disease; recent systemic steroid use; or were pregnant or breast feeding.
Statistical Methods
Data for 1092 patients (584 on LM75/25, 508 on insulin glargine) who provided a baseline A1C and achieved a target 12- or 24-week A1C (≤7.0%; responders) from the DURABLE study’s initiation phase were examined and explored with the SIDES algorithm.14 The at-goal population (those who successfully responded to either treatment) was chosen because most of these patients were included in the maintenance phase of the DURABLE trial, and we expected that any differential response in A1C to treatment would be more apparent in these patients. We also examined nonresponders (n = 889) using the SIDES algorithm.
To explore heterogeneity in treatment response, we used the subgroup identification tool (SIT), an analytical tool developed at Eli Lilly and Company that implements the SIDES algorithm introduced in Lipkovich and coauthors14 and identifies subgroups that have a differential treatment effect between two comparator groups in an experiment. Cut-off points are identified by examining a large number of covariates simultaneously rather than examining one covariate at a time. A key benefit of the SIT is that it implements a more flexible and efficient strategy than parametric regression for identifying key variables.14 Parametric regression relies on a model dictated by a predefined structure and set of variables, whereas the SIT allows the data to guide the process of identifying the subgroups and then evaluates whether the results are reproducible. The SIT is written in Visual Basic for .NET (VB 9.0; Microsoft, Redmond, WA).
The SIDES algorithm is in the family of recursive partitioning algorithms, but it differs from the recursive partitioning algorithm implemented in the classification and regression trees15 in that the SIDES algorithm directly incorporates treatment variables into the search criteria (essentially, looking for subgroups with large treatment effect rather than large mean outcome) and it provides control of the overall type I error rate.14 For the purposes of this research, the SIDES algorithm search criteria incorporated stratification by baseline A1C to help control for the differences between patients in baseline A1C. The stratification levels used were quintiles estimated by the SIT for the distribution of baseline A1C for the 1092 patients included in the analysis data set.
Subgroups with the largest treatment differences were first explored through a single run of the SIT to screen for clinically distinct subgroups. The data were randomly split into equal training and validation portions (500 replications). The SIDES algorithm was then applied to each training sample, and the treatment difference in the resultant sub-groups was evaluated on the validation sample. A high frequency of a particular subgroup appearing in multiple training samples, and then confirmed in the associated validation samples, was used by the analyst to determine the reproducibility of the subgroups of interest. Thus subgroups found repeatedly in the training sets and confirmed in the corresponding validation sets were considered reliable.
The SIDES algorithm controls for type I error (false positives) through a resampling-based method. The overall type I error rate was controlled at approximately <5%14 for the hypothesis that there is any subgroup with a treatment effect substantially larger than the treatment effect for the overall population of 1092 patients.
A variable importance index is included in this analysis. This index assesses the relative contribution of a variable to the subgroup identification process. A benchmark value is also computed using permutation-based maximum variable importance. Permutation-based maximum variable importance results from randomly permuting the treatment variable and then measuring the variable importance on the data where the relationship between the treatment and the outcome variable has been removed. The “maximum” refers to the maximum variable importance score among all covariates observed in the data with permuted treatment labels. This process is repeated 500 times, resulting in 500 such data sets, and we compute the maximum variable importance for each iteration, and then we compute the average and standard deviation (SD) of these 500 maximum values. The resulting summary values (maximum variable importance mean and SD of the maximum variable importance) allows us to construct a benchmark value to use in judging which importance score values are above the level that would be expected just by chance. We considered values at the maximum variable importance mean to be a strong signal and values above the maximum variable importance mean + 1 SD of the maximum variable importance to be a very strong signal.
Analysis of variance and analysis of covariance models were used to help assess differences between treatment groups and explore main effects of covariates (baseline A1C and age). We adjusted for baseline A1C and age to add validity to the model.16 For the change from baseline A1C, an analysis of variance with therapy (LM75/25, insulin glargine) was conducted and then an analysis of covariance adjusting for the effect of baseline A1C was evaluated. The interaction between therapy and baseline A1C was explored using a model comprised of therapy, baseline A1C, and the interaction.
The investigators prespecified that differences ≥0.3% on change of A1C were to be clinically relevant because 0.3% had been used for registration purposes.17 P values for differences between LM75/25 and insulin glargine were considered statistically significant for p ≤ .05. The effect of a covariate was considered statistically significant for p ≤ .05. Interactions between a covariate and therapy were considered statistically significant for p ≤ .10.
A locally weighted regression smoothing algorithm was used to compute the regression functions shown in Figures 1 to 5.
Figure 1.
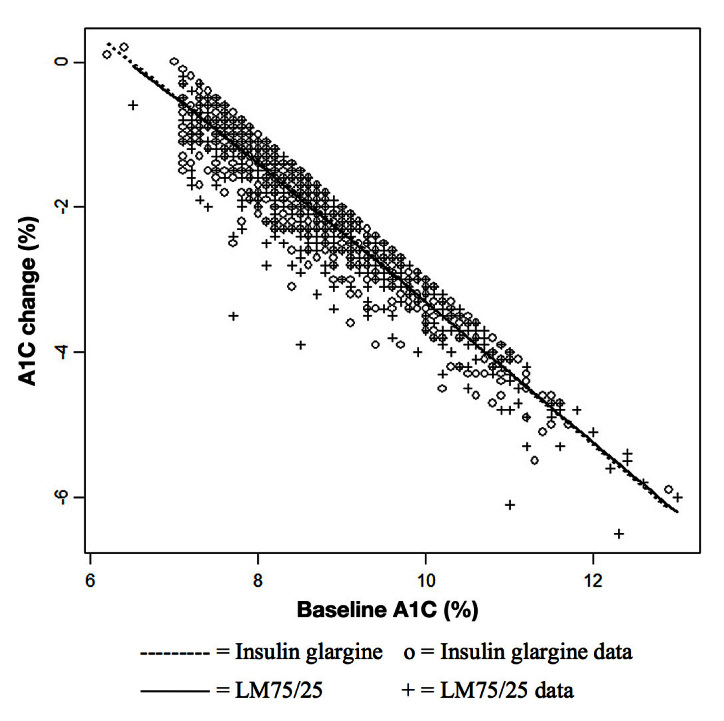
Relationship between change in A1C from baseline to end point and baseline A1C by treatment group of at-goal (12 or 24 weeks) patients (who provided a baseline A1C).
Figure 5.
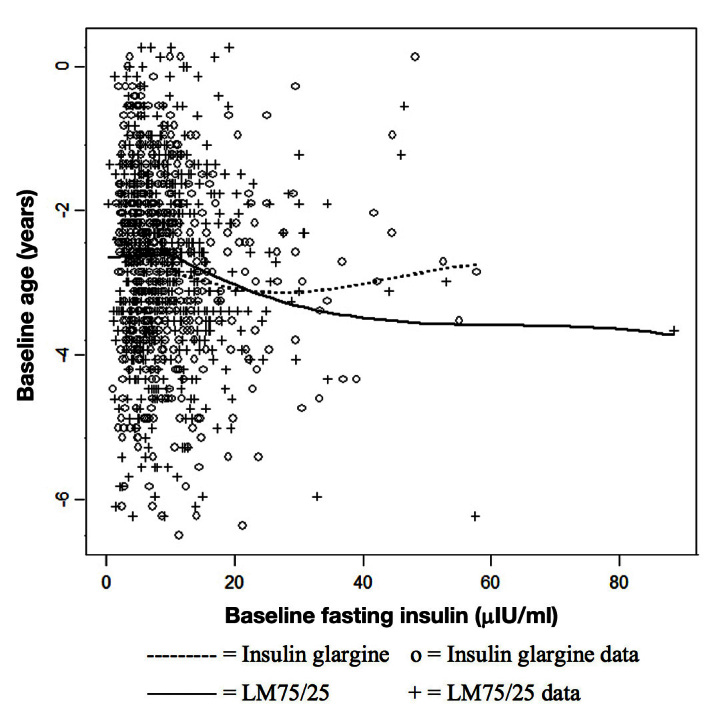
Relationship between age and baseline fasting insulin by treatment group of at-goal (12 or 24 weeks; who provided a baseline A1C) population.
SAS (9.2; SAS Institute Inc., Cary, NC) was used for summary and analyses of the responder population and the subgroup identified through the SIT. S-plus 8.0 (Insightful Corp., Seattle, WA) was used to compute locally weighted regressions.
Outcome and Candidate Predictor Variables
The outcome variable input into the SIT was change in A1C from baseline to A1C at the point of control (≤7.0%) for those patients who achieved control at either 12 or 24 weeks. This measure was used as the response variable for subgroup identification analysis with the SIT, and the following variables were used as candidate predictors of treatment effect: age at study entry, baseline A1C, baseline BMI, duration of diabetes, race/ethnicity, gender, use of metformin at baseline, use of sulfonylurea at baseline, use of a thiazolidinedione at baseline, baseline fasting glucose level, baseline 1,5-anhydroglucitol level, baseline adiponectin level, baseline fasting insulin level, and randomized treatment. The SIT compared this change in A1C between LM75/25 and insulin glargine to determine whether any subgroups achieved better outcomes in either treatment group.
Results
We found a clinically relevant subgroup among the responders that validated under-resampling with training and validation samples. We did not find a subgroup in the nonresponders that validated under-resampling with training and validation samples.
Characteristics of the 1092 at-goal patients between treatment groups are summarized in Table 1. Treatment groups were generally balanced, with baseline A1C slightly higher for patients treated with LM75/25 (8.7% ± 1.2% versus 8.6% ± 1.1%; p = .05) than with insulin glargine. The unadjusted baseline to end point A1C was -2.15% ± 0.05% (LM75/25) versus -1.98% ± 0.05% (insulin glargine; p = .02). The adjusted baseline to end point A1C was -2.18% ± 0.02% (LM75/25) versus -2.11% ± 0.02% (insulin glargine; p = .03). There was no significant interaction between therapy and baseline A1C (p = .92; Figure 1). At the point of control [12- or 24-week A1C (≤7.0%)], total daily insulin dose was higher with LM75/25 (0.42 ± 0.18 versus 0.34 ± 0.18 U/kg; p < .0001) than with insulin glargine (Table 1).
Table 1.
Characteristics of At-Goal (12 or 24 Weeks) Population (Who Provided a Baseline Glycated Hemoglobin A1c) in the DURABLE Trial
| Variable | Treatment group | p value | |
| LM75/25 (n = 584) | Insulin glargine (n = 508) | ||
| Baseline A1C (%), mean (SD) | 8.7 (1.2) | 8.6 (1.1) | 0.05 |
| Baseline A1C (%) group (n, %) | |||
| >9.6% | 122 (20.9%) | 88 (17.3%) | |
| 8.81–9.6% | 100 (17.1%) | 89 (17.5%) | |
| 8.21–8.8% | 118 (20.2%) | 94 (18.5%) | |
| 7.71–8.2% | 107 (18.3%) | 104 (20.5%) | |
| ≤7.7% | 137 (23.5%) | 133 (26.2%) | |
| Initial total daily insulin dose (U/kg/day),a mean (SD) | 0.36 (0.13) | 0.27 (0.13) | <0.0001 |
| Age (years), mean (SD) | 58.0 (9.5) | 57.7 (9.3) | 0.54 |
| Duration of diabetes (years), mean (SD) | 9.6 (6.3) | 9.5 (6.0) | 0.79 |
| Gender (% female) | 49.0% | 44.7% | 0.16 |
| BMI (kg/m2), mean (SD) | 31.7 (5.9) | 31.8 (5.9) | 0.96 |
| Fasting insulin (μIU/ml), mean (SD) Median (25th percentile, 75th% percentile) |
9.8 (7.8)7.9 (4.9, 12.2) | 9.5 (8.1) 7.1 (4.8, 11.1) |
0.56 |
| Race/ethnicity (n, %) | |||
| African American | 29 (5.0%) | 28 (5.5%) | 0.71a |
| Asian | 48 (8.2%) | 48 (9.5%) | |
| Caucasian | 419 (71.8%) | 359 (70.7%) | |
| East Asian | 6 (1.0%) | 10 (2.0%) | |
| Hispanic | 68 (11.6%) | 51 (10.0%) | |
| Other | 14 (2.4%) | 12 (2.4%) | |
| A1C reduction (%), SIT stratified mean (standard error) | -2.18% (0.02) | -2.11% (0.02) | 0.03c |
| Total daily insulin dose (U/kg) at point of control, mean (SD) Hypoglycemia (episodes/year) at point of control mean (SD) |
0.42 (0.18) 44.5 (54.7) |
0.34 (0.18) 34.6 (42.8) |
<0.0001 <0.001 |
LM75/25 minimum starting dose was 10 U twice daily. Glargine minimum starting dose was 10 U once daily.
The p value is the result of the test whether the distribution of the variable race is different between the two treatments.
p values are significant at p < .05 level.
For total daily insulin dose at the point of control, there was a significant age effect (p < .0001), and the interaction between age and therapy was significant (p = .0565).
The mean (SD) permutation-based maximum variable importance value was 1.47 (0.37). Thus, values above 1.47were considered to be strong subgroup variables in this analysis, and values above 1.84 were considered very strong variables. Baseline fasting insulin level and age demonstrated values at or above the benchmark (Table 2). These two variables also defined a subgroup we considered replicable, as the subgroup was identified repeatedly in training sets and showed significant treatment differences in the test sets. These two results (variable importance at or above 1.47 and replicability) led us to the subgroup defined as insulin level > 11.4 μIU/ml and age ≤ 56 years. As a point of reference, this subgroup was in the upper part of the distribution of fasting insulin values for the 1092 patients and in the lower half of the distribution of age; in the 1092 patients, the median was 7.57 μIU/ml, the 75th percentile was 11.66 μIU/ml, and the maximum was 88.76 μIU/ml. For age of the 1092 patients, the median was 58 years, the 25th percentile was 52 years, and the minimum was 30 years.
Table 2.
Predictors of Treatment Effect Identified by the Subgroup Identification Tool
| Variable | Importance based on splitting criterion |
| Baseline fasting insulin level | 2.09 |
| Age | 1.47 |
| Race/ethnicity | 1.34 |
| Use of a thiazolidinedione at baseline | 1.07 |
| Baseline adiponectin level | 1.07 |
| Gender | 0.78 |
| Duration of diabetes | 0.72 |
| Baseline 1,5-anhydroglucitol level | 0.39 |
| Use of sulfonylurea at baseline | 0.33 |
| Use of metformin at baseline | 0.19 |
| Baseline fasting glucose level | 0.14 |
| Baseline BMI | 0.11 |
| Permutation-based maximum variable importance (mean) | 1.47a |
| Permutation-based maximum variable importance (SD) | 0.37 |
The number 1.47, computed by the SIT, is not a standardized measure like r2; it is a benchmark useful for defining predicting variables.14 This number can vary based on the data set—a number above 1.47 is considered important and a number below 1.47 may not be as important.
This subgroup of at-goal patients with fasting insulin > 11.4 μIU/ml and age ≤ 56 years (n = 148; 85 LM75/25 and 63 insulin glargine) was evaluated (Table 3). The majority of patients were Caucasian [n = 101 (68%)] as found in the population of responding patients (Table 1). Among the subgroup identified, all other variables were not notably different from the entire population (Table 3), although caution should be exercised because of the small sample size.
Table 3.
Characteristics of At-Goal (12 or 24 Weeks; Who Provided a Baseline Glycated Hemoglobin A1c) Subgroup with Fasting Insulin > 11.4 µIU/ml and Age > 56 Years
| Variable | Treatment group | p value | |
| LM75/25(n = 85) | Insulin glargine(n = 63) | ||
| Baseline A1C (%), mean (SD) | 8.7 (1.3) | 8.5 (0.9) | 0.13 |
| Baseline A1C (%) groups (n, %) | |||
| >9.6% | 16 (18.8%) | 8 (12.7%) | |
| 8.81–9.6% | 13 (15.3%) | 12 (19.0%) | |
| 8.21–8.8% | 18 (21.2%) | 11 (17.5%) | |
| 7.71–8.2% | 19 (22.4%) | 15 (23.8%) | |
| ≤7.7% | 19 (22.4%) | 17 (27.0%) | |
| Initial total daily insulin dose (units/kg/day),a mean (SD) | 0.36 (0.13) | 0.31(0.12) | 0.0105a |
| Age (years), mean (SD) | 49.2 (5.7) | 48.1 (6.7) | 0.28 |
| Duration of diabetes (years), mean (SD) | 6.5 (4.1) | 7.0 (3.8) | 0.42 |
| BMI (kg/m2), mean (SD) | 34.8 (6.4) | 35.2 (6.4) | 0.74 |
| Fasting insulin (μIU/ml), mean (SD) Median (25th percentile, 75th percentile) | 18.8 (11.3) 15.6 (13.4, 19.2) |
19.3 (9.0) 15.1 (13.1, 23.3) |
0.78 |
| Race/ethnicity (n, %) | |||
| African American | 3 (3.5%) | 6 (9.5%) | 0.18b |
| Asian | 9 (10.6%) | 8 (12.7%) | |
| Caucasian | 61(71.8%) | 40 (63.5%) | |
| East Asian | 2 (2.4%) | 0 (0.0%) | |
| Hispanic | 7 (8.2%) | 9 (14.3%) | |
| Other | 3 (3.5%) | 0 (0.0%) | |
| A1C reduction (%), SIT stratified mean (standard error) | -2.31% (0.06) | -2.01% (0.07) | 0.001c |
| Total daily insulin dose (U/kg/day) at point of control, mean (SD) Hypoglycemia (episodes/year) at point of control mean (SD) |
0.45 (0.18) 21.3 (30.3) |
0.43 (0.19) 19.1 (32.2) |
0.5759 0.67 |
LM75/25 minimum starting dose was 10 U twice daily. Glargine minimum starting dose was 10 U once daily.
p value is the result of the test whether the distribution of the variable race is different between the two treatments.
The p values are significant at <0.05 level.
Baseline A1C was similar between the LM75/25 treatment group (8.7% ± 1.3%) and the insulin glargine treatment group (8.5% ± 0.9%; p = .13; Table 3). The reduction in A1C from baseline to end point without adjustment for baseline was significantly greater for the LM75/25-treated patients compared with the insulin-glargine-treated patients (-2.22% ± 0.12% versus -1.77% ± 0.14%; p = .02). Similar results were observed after adjusting for baseline A1C, with LM75/25-treated patients having a significantly larger reduction than insulin-glargine-treated patients (-2.31% ± 0.06% versus -2.01% ± 0.07%; p = .001). The insulin glargine group demonstrated a greater increase from the starting dose than the LM75/25 group (0.12 versus 0.09 U/kg/day). However, by the end of the study, both treatment groups showed a similar mean dose in the responders (patients who achieved a target 12- or 24-week A1C of ≤7.0%). The insulin glargine group demonstrated a smaller change in A1C.
There was not a significant interaction effect between therapy and baseline A1C (p = .35; Figure 2). Figure 2 shows that, for baseline A1C < 10%, the glargine group demonstrates less change from baseline than the LM75/25 group. There are few observations with baseline A1C above 10%, and the estimated regression function for the insulin glargine group shows a greater reduction than for the LM75/25 group. However, that relationship appears to be driven by one data point. At the point of control (12- or 24-week A1C [≤7.0%]), insulin dose was similar between LM75/25 and insulin glargine (0.45 ± 0.18 versus 0.43 ± 0.19 U/kg/day; p = .5759), and there was no significant age effect (p = .4395) and no significant interaction between age and therapy (p = .2190).
Figure 2.
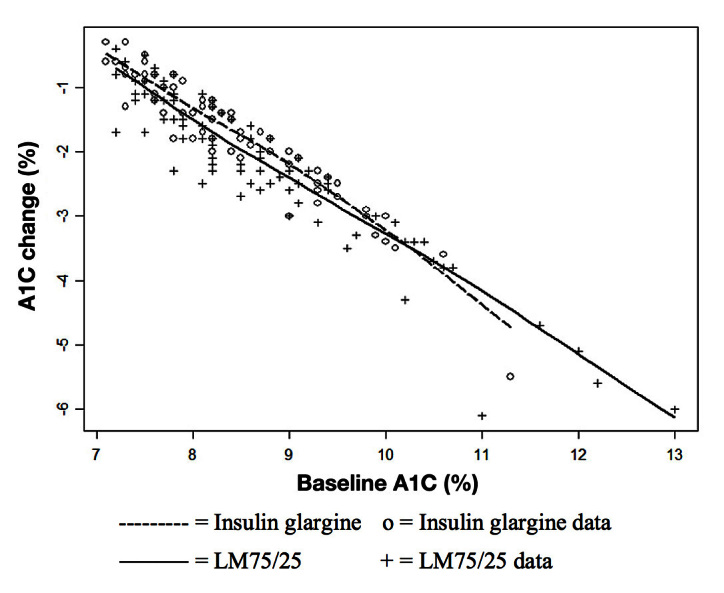
Relationship between change in A1C from baseline to end point and baseline A1C by treatment group of at-goal (12 or 24 weeks) patients (who provided a baseline A1C): subgroup with fasting insulin > 11.4 μIU/ml and age ≤ 56 years.
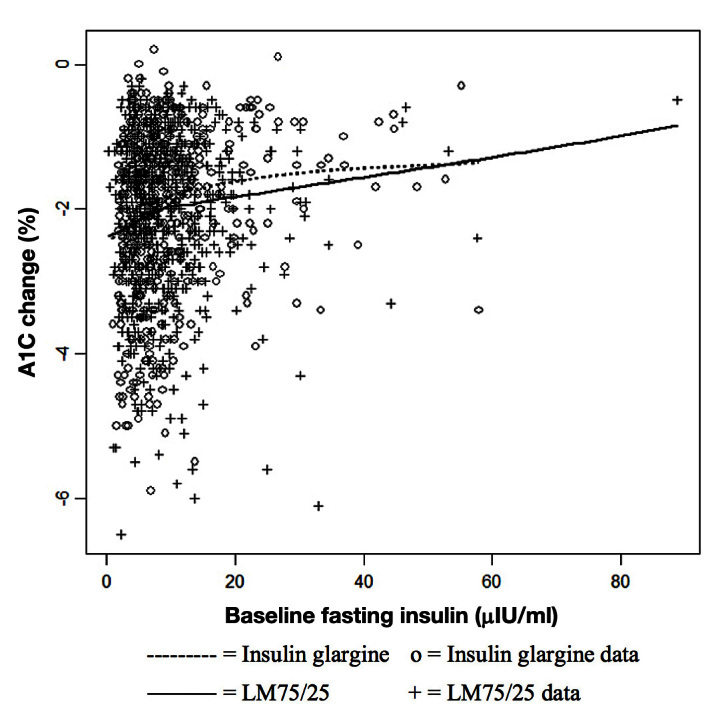
For at-goal patients, Figure 3 shows a low correlation between change from baseline A1C and age (r = 0.15). The LM75/25 group shows a greater reduction than the insulin glargine group until approximately age 60, after which the treatment groups show a similar response. This observation is consistent with our subgroup findings. For at-goal patients, Figure 4 shows a significant but low correlation between change from baseline A1C and baseline fasting insulin level (r = 0.12). Most of the observations have a baseline fasting insulin level ≤ 10 μIU/ml, and in this region, the difference between the therapies is small. Above a baseline fasting insulin level of 10 μIU/ml, the difference between therapies is larger, but only up to a value of approximately 50 μIU/ml. This observation is also consistent with our subgroup finding. For at-goal patients, Figure 5 shows a low correlation between age and baseline fasting insulin (r = -0.07), which suggests that the variables are not highly associated.
Figure 3.
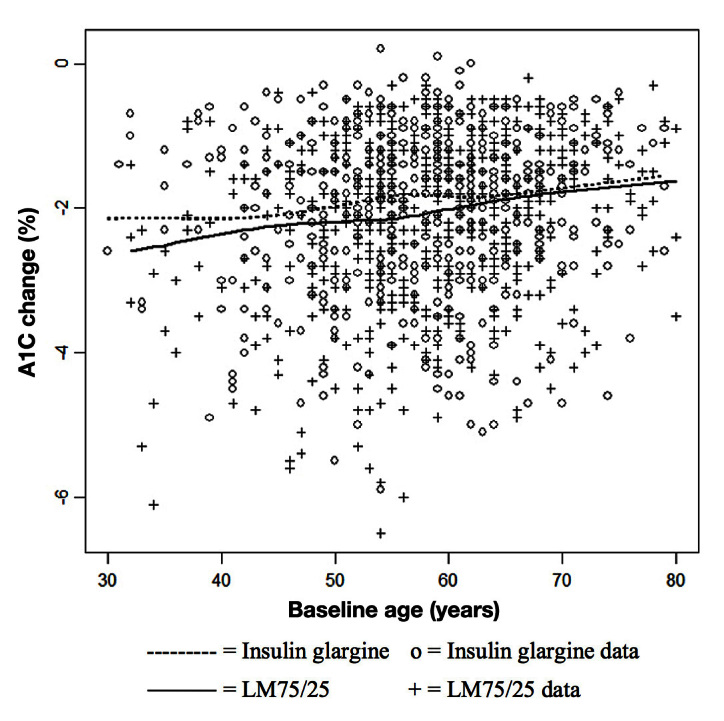
Relationship between change in A1C from baseline to end point and age by treatment group of at-goal (12 or 24 weeks; who provided a baseline A1C) population.
Figure 4.
(A) The OneTouch VerioPro+ meter. (B) Examples of onscreen QC prompts.
Subgroup searches using at-goal patients did not yield any reliable subgroups in which insulin glargine showed a better response than LM75/25. Subgroup searches using all randomized patients did not yield any reliable subgroups in which LM75/25 showed a better response than insulin glargine or insulin glargine showed a better response than LM75/25.
Discussion
The goal of our study was to perform an analysis that may be useful to provide preliminary tailoring therapy information. This exploratory analysis used a computer program implementing the SIDES algorithm to examine patient-level data. A completed clinical trial with a large sample size that had detailed and validated measures of glycemic response (continuous glucose monitoring) was selected to explore whether some groups of patients responded well or less well to the therapies. The overall at-goal population treatment difference (A1C reduction) was not clinically meaningful,11 but a clinically meaningful difference in the subgroup of patients with a baseline fasting insulin level >11.4 μIU/ml and age ≤ 56 years was observed (A1C reduction of 2.31% LM75/25 versus 2.01% insulin glargine; p = .001). In the full DURABLE trial’s 24-week initiation phase, population treatment difference (end point A1C reduction at 24 weeks) was -1.8% ± 1.3% for LM75/25 versus -1.7% ± 1.3% for insulin glargine; p = .005.11
Heterogeneity of patient factors characterized the T2DM population and how well the groups of patients responded to the therapies. Implementing the SIDES methodology with the SIT, we found that older and younger patients may respond differently to different treatments. Lower caloric intake in the elderly may result in less postprandial hyperglycemia contribution to A1C elevation. As a consequence, they may not experience glycemic control as tight as their younger counterparts,18 which renders mealtime glycemia less influential on A1C values. Our results in younger patients may be secondary to better beta-cell function as part of earlier disease state. Beta cells have a long lifespan with a very slow rate of regeneration in adulthood that decreases with age (1.00% to 0.45%/year),19 and aged cells are more susceptible to cytotoxic damage and apoptosis. In these younger patients (≤56 years) with better functioning such as lispro mixtures because it is similar to the natural insulin physiology by providing an insulin with both basal and meal-time coverage, which may result in a better A1C response. In contrast, the elderly or individuals with less beta-cell function, reflected by low fasting insulin levels, tend to respond to both treatment regimens. In the overall group, there was difference in insulin dose between the two treatments at the point of control. For the subgroup with baseline fasting insulin > 11.4 μIU/ml and age ≤ 56 years, the insulin doses were similar between the two treatments at the point of control. This provides evidence that the subgroup finding is not completely driven by insulin dose effects.
Achieving natural insulin ranges is typically an unspecified aim for insulin dosing. The normal insulin range in adults (≥18 years) for the Covance assay (access ultrasensitive insulin assay; analyzed regionally by Covance: Geneva, Switzerland; Sydney, Australia; Indianapolis, IN; Singapore) used for this study is 1.9 to 23.0 μIU/ml. The fasting insulin cut point (11.4 μIU/ml) for the identified subgroup is in the middle of this range; the tool identified subgroups of patients who are in the upper part of the distribution of fasting insulin. These may be the most insulin-resistant patients in the 1092 at-goal patients.
Current diabetes pathology theories suggest that insulin resistance is a major pathogenic characteristic of T2DM, particularly in African American and Hispanic patients.20,21 In African American and Pima Indian minority populations, especially evident in children, fasting plasma glucose concentrations are higher than in Caucasian populations.22,23 The higher rate of insulin resistance may be due to lower insulin clearance and higher insulin production, which result in a higher rate of T2DM in these populations. Therefore, the added postprandial insulin would help overcome insulin resistance and produce enough insulin for the body to process the excess glucose, rather than just basal insulin, which is not necessary. There was some evidence in the at-goal patients that non-Caucasian patients may have a greater A1C reduction with LM75/25, but those subgroups were not very replicable in the sensitivity analyses and the variable importance for race/ethnicity was not as strong as for fasting insulin level and age.
Alternatively, new theories suggest that insulin resistance may not be a part of the pathology of diabetes, but rather a compensation mechanism of the body for an error in beta-cell function.24 Insulin resistance could be a mechanism to prevent hypoglycemia between meals.24 Therefore, this subpopulation of younger adults with T2DM and lower fasting insulin may have responded better to the prandial insulin because they may actually have a more aggressive disease and need prandial insulin at an earlier stage in the disease.
Our findings suggest that the subgroup discussed here was replicable (based on resampling) and appears to provide a stable finding that makes sense medically: younger patients with high levels of fasting insulin may be in earlier stages of the disease and therefore respond to an insulin regimen that includes a postprandial component that is similar to normal physiology in nondiabetic persons. We acknowledge the possibility that the subgroup differences discussed here may be influenced by unmeasured confounders, such as diet and exercise. These data were not collected in the original study. In this study, only those patients who successfully responded to either treatment [achieved at-goal 12- or 24-week A1C (≤7.0%)] were included, and those patients not under control were excluded. This study sought to help explain heterogeneity, not to develop a predictive algorithm for patient response given the pretreatment characteristics. Further, we sought to generate preliminary hypotheses that could be tested in confirmatory prospective randomized studies. If we identify subpopulations, that is, minority populations or younger populations with more aggressive beta-cell dysfunction, that are likely to have a particular course of disease, then their starting insulin regimen could be selected to correct their particular T2DM disease pathologies. We found that the response to the two insulin therapies may vary by age and fasting insulin level. The observation that younger T2DM patients with higher levels of fasting insulin may benefit from a regimen that includes short-acting insulin targeting postprandial glycemia warrants further investigation.
The mean baseline A1C level was significantly different in the two groups. To help control for this observed difference, we stratified baseline A1C using quintiles of the distribution for the 1092 patients. Due to the intensive computational requirements of the SIT, we decided that quintiles were a sufficient stratification for the SIDES algorithm analysis. We examined the results using more percentiles (e.g., 20 strata), but the subgroup findings were the same as reported here. The observation that the insulin glargine group had a lower starting dose may be related to the lower baseline A1C level; however, the dosing regimens in the two groups yielded similar doses at the point of control. Additionally, we recognize that the duration of treatment could be a potential confounder. However, the patient was allowed 24 weeks to get under control with either therapy; therefore, time was not considered a confounder.
Our investigation focused on the response in patients whose A1C was controlled during the initiation phase. A subsequent investigation, to further define the response of the subgroup, would be to examine the durability of the control in the subset identified during the maintenance phase because the original trial was designed to assess the durability of response. Additionally, examination of postprandial glucose data would expand upon our research relevantly to examine how a neutral-protamine-Hagedorn-equivalent insulin compares with insulin glargine for the subset identified. Another relevant follow-up analysis would be to reconfirm our subgroup finding in one or more of the other three clinical trials that were originally considered for inclusion in this analysis. Finally, a prospective clinical trial of patients similar to those in the identified subgroup would be the “gold standard” evidence.
The SIDES methodology employed in this study is a recognized method to assess heterogeneity,14 and implementation of this approach could provide information to help design more targeted clinical trials. Ultimately, more precise identification of patients likely to respond to therapy will lead to improved patient care.
Acknowledgments
The authors thank Teri Tucker, B.A., of PharmaNet/i3 for her editorial contributions to this manuscript and Rebecca McCracken, M.S.P.H., also of PharmaNet/i3 for her writing contributions to this manuscript.
Glossary
- (A1C)
glycated hemoglobin A1c
- (BMI)
body mass index
- (DURABLE)
Assessing the DURAbility of Basal versus Lispro mix 75/25 insulin Efficacy
- (insulin glargine)
once-daily insulin glargine
- (OAM)
oral antidiabetic medication, (SIDES) subgroup identification based on differential effect search
- (SIT)
subgroup identification tool, (SD) standard deviation, (T2DM) type 2 diabetes mellitus
Funding
This study was funded by Eli Lilly and Company, Indianapolis, IN.
Disclosures
The authors are full-time employees and minor stockholders of Eli Lilly and Company, Indianapolis, IN.
References
- 1.World Health Organization. Diabetes. Fact sheet. No. 312. http://www.who.int/mediacentre/factsheets/fs312/en/index.html. Accessed April 12, 2012.
- 2.Centers for Disease Control and Prevention. Atlanta: U.S. Department of Health and Human Services, Centers for Disease Control and Prevention; 2011. National diabetes fact sheet: national estimates and general information on diabetes and prediabetes in the United States, 2011. [Google Scholar]
- 3.Danaei G, Finucane MM, Lu Y, Singh GM, Cowan MJ, Paciorek CJ, Lin JK, Farzadfar F, Khang YH, Stevens GA, Rao M, Ali MK, Riley LM, Robinson CA, Ezzati M, Global Burden of Metabolic Risk Factors of Chronic Diseases Collaborating Group (Blood Glucose) National, regional, and global trends in fasting plasma glucose and diabetes prevalence since 1980: systematic analysis of health examination surveys and epidemiological studies with 370 country-years and 2·7 million participants. Lancet. 2011;378(9785):31–40. doi: 10.1016/S0140-6736(11)60679-X. [DOI] [PubMed] [Google Scholar]
- 4.Nathan DM, Buse JB, Davidson MB, Ferrannini E, Holman RR, Sherwin R, Zinman B, American Diabetes Association; European Association for Study of Diabetes Medical management of hyperglycemia in type 2 diabetes: a consensus algorithm for the initiation and adjustment of therapy: a consensus statement of the American Diabetes Association and the European Association for the Study of Diabetes. Diabetes Care. 2009;32(1):193–203. doi: 10.2337/dc08-9025. [DOI] [PMC free article] [PubMed] [Google Scholar]
- 5.Shomali ME. Practical applications of therapy with a glucagon-like peptide-1 receptor agonist. J Fam Pract. 2009;58(9 Suppl Treating):S35–43. [PubMed] [Google Scholar]
- 6.Cantrell RA, Alatorre CI, Davis EJ, Zarotsky V, Le Nestour E, Carter GC, Goetz I, Paczkowski R, Sierra-Johnson J. A review of treatment response in type 2 diabetes: assessing the role of patient heterogeneity. Diabetes Obes Metab. 2010;12(10):845–57. doi: 10.1111/j.1463-1326.2010.01248.x. [DOI] [PubMed] [Google Scholar]
- 7.Greenfield S, Kravitz R, Duan N, Kaplan SH. Heterogeneity of treatment effects: implications for guidelines, payment, and quality assessment. Am J Med. 2007;120(4 Suppl 1):S3–9. doi: 10.1016/j.amjmed.2007.02.002. [DOI] [PubMed] [Google Scholar]
- 8.Kravitz RL, Duan N, Braslow J. Evidence-based medicine, heterogeneity of treatment effects, and the trouble with averages. Milbank Q. 2004;82(4):661–87. doi: 10.1111/j.0887-378X.2004.00327.x. [DOI] [PMC free article] [PubMed] [Google Scholar]
- 9.Ruberg SJ, Chen L, Wang Y. The mean does not mean as much anymore: finding sub-groups for tailored therapeutics. Clin Trials. 2010;7(5):574–83. doi: 10.1177/1740774510369350. [DOI] [PubMed] [Google Scholar]
- 10.Fahrbach J, Jacober S, Jiang H, Martin S. The DURABLE trial study design: comparing the safety, efficacy, and durability of insulin glargine to insulin lispro mix 75/25 added to oral antihyperglycemic agents in patients with type 2 diabetes. J Diabetes Sci Technol. 2008;2(5):831–8. doi: 10.1177/193229680800200514. [DOI] [PMC free article] [PubMed] [Google Scholar]
- 11.Buse JB, Wolffenbuttel BH, Herman WH, Shemonsky NK, Jiang HH, Fahrbach JL, Scism-Bacon JL, Martin SA. DURAbility of basal versus lispro mix 75/25 insulin efficacy (DURABLE) trial 24-week results: safety and efficacy of insulin lispro mix 75/25 versus insulin glargine added to oral antihyperglycemic drugs in patients with type 2 diabetes. Diabetes Care. 2009;32(6):1007–13. doi: 10.2337/dc08-2117. [DOI] [PMC free article] [PubMed] [Google Scholar]
- 12.Herman WH, Dungan KM, Wolffenbuttel BH, Buse JB, Fahrbach JL, Jiang H, Martin S. Racial and ethnic differences in mean plasma glucose, hemoglobin A1c, and 1,5-anhydroglucitol in over 2000 patients with type 2 diabetes. J Clin Endocrinol Metab. 2009;94(5):1689–94. doi: 10.1210/jc.2008-1940. [DOI] [PubMed] [Google Scholar]
- 13.World Health Organization. Geneva: World Health Organization; 1999. Definition, diagnosis and classification of diabetes mellitus and its complications: report of a WHO consultation. Part 1: diagnosis and classification of diabetes mellitus. [Google Scholar]
- 14.Lipkovich I, Dmitrienko A, Denne J, Enas G. Subgroup identification based on differential effect search--a recursive partitioning method for establishing response to treatment in patient subpopulations. Stat Med. 2011;30(21):2601–21. doi: 10.1002/sim.4289. [DOI] [PubMed] [Google Scholar]
- 15.Breiman L, Friedman J, Stone CJ, Olshen RA. New York: Chapman & Hall/CRC; 1984. Classification and regression trees. [Google Scholar]
- 16.Owen V, Seetho I, Idris I. Predictors of responders to insulin therapy at 1 year among adults with type 2 diabetes. Diabetes Obes Metab. 2010;12(10):865–70. doi: 10.1111/j.1463-1326.2010.01239.x. [DOI] [PubMed] [Google Scholar]
- 17.Food and Drug Administration. Guidance for industry. Diabetes mellitus: developing drugs and therapeutic biologics for treatment and prevention. Draft guidance. 2008. Feb, http://www.fda.gov/downloads/Drugs/GuidanceComplianceRegulatoryInformation/Guidances/UCM071624.pdf. Accessed February 20, 2013.
- 18.De Castro JM. Age-related changes in spontaneous food intake and hunger in humans. Appetite. 1993;21(3):255–72. doi: 10.1006/appe.1993.1044. [DOI] [PubMed] [Google Scholar]
- 19.Cnop M, Igoillo-Esteve M, Hughes SJ, Walker JN, Cnop I, Clark A. Longevity of human islet α- and β-cells. Diabetes Obes Metab. 2011;13(Suppl 1):39–46. doi: 10.1111/j.1463-1326.2011.01443.x. [DOI] [PubMed] [Google Scholar]
- 20.Harris MI. Summary. In: Harris MI, Cowie CC, Stern MP, Boyko EJ, Reiber GE, Bennett PH, editors. Diabetes in America. 2nd ed. Bethesda: National Diabetes Data Group; 1995. p. 12. NIH Publication No. 95-01468. [Google Scholar]
- 21.Harris MI, Cowie CC, Gu K, Francis ME, Flegal K, Eberhardt MS. Higher fasting insulin but lower fasting C-peptide levels in African Americans in the US population. Diabetes Metab Res Rev. 2002;18(2):149–55. doi: 10.1002/dmrr.273. [DOI] [PubMed] [Google Scholar]
- 22.Pettitt DJ, Moll PP, Knowler WC, Mott DM, Nelson RG, Saad MF, Bennett PH, Kottke BA. Insulinemia in children at low and high risk of NIDDM. Diabetes Care. 1993;16(4):608–15. doi: 10.2337/diacare.16.4.608. [DOI] [PubMed] [Google Scholar]
- 23.Arslanian SA, Saad R, Lewy V, Danadian K, Janosky J. Hyperinsulinemia in african-american children: decreased insulin clearance and increased insulin secretion and its relationship to insulin sensitivity. Diabetes. 2002;51(10):3014–9. doi: 10.2337/diabetes.51.10.3014. [DOI] [PubMed] [Google Scholar]
- 24.Corkey BE. Diabetes: have we got it all wrong? Insulin hypersecretion and food additives: cause of obesity and diabetes? Diabetes Care. 2012;35(12):2432–7. doi: 10.2337/dc12-0825. [DOI] [PMC free article] [PubMed] [Google Scholar]