Abstract
Cellular systems are generally robust against fluctuations of intracellular parameters such as gene expression level. However, little is known about expression limits of genes required to halt cellular systems. In this study, using the fission yeast Schizosaccharomyces pombe, we developed a genetic ‘tug-of-war’ (gTOW) method to assess the overexpression limit of certain genes. Using gTOW, we determined copy number limits for 31 cell-cycle regulators; the limits varied from 1 to >100. Comparison with orthologs of the budding yeast Saccharomyces cerevisiae suggested the presence of a conserved fragile core in the eukaryotic cell cycle. Robustness profiles of networks regulating cytokinesis in both yeasts (septation-initiation network (SIN) and mitotic exit network (MEN)) were quite different, probably reflecting differences in their physiologic functions. Fragility in the regulation of GTPase spg1 was due to dosage imbalance against GTPase-activating protein (GAP) byr4. Using the gTOW data, we modified a mathematical model and successfully reproduced the robustness of the S. pombe cell cycle with the model.
Keywords: cell cycle, cytokinesis, fission yeast, gene overexpression, mathematical model
Introduction
Intracellular parameters such as gene expression require optimization, such that cellular functions may be performed effectively (Alon et al, 1999; Zaslaver et al, 2004; Dekel and Alon, 2005; Wagner, 2005). Fluctuations in these parameters lead to various cellular defects. Overexpression of genes involved in proliferation of cancer cells due to gene amplification is a prime example (Albertson, 2006). On the other hand, in order to maintain cellular functions despite environmental change, mutation, and noise in intracellular biochemical reactions, these parameters may have certain permissible ranges, a characteristic termed robustness, which is commonly observed in various cellular systems (Barkai and Leibler, 1997; Little et al, 1999; von Dassow et al, 2000).
We previously reported a method designated genetic ‘tug-of-war (gTOW),’ by which we can measure the limit of gene overexpression in the budding yeast Saccharomyces cerevisiae (Moriya et al, 2006). In gTOW, a target gene with its native regulatory regions is cloned into a particular plasmid, and the copy number of the plasmid is increased by genetic selection. Next, the copy number is measured just before the cellular system halts (i.e., the cell dies), such that the overexpression limit of the target gene is evaluated as the gene copy number limit. As the gene copy number increases, relative overexpression of the gene is expected. If we can measure the copy number limit of gene overexpression, we can evaluate the degree to which the cellular system resists overexpression of the target gene (namely, robustness versus gene overexpression).
Using gTOW, we previously measured the copy number limits of 30 cell-cycle regulators in budding yeast (Moriya et al, 2006). The data were used to reveal the robustness profile of the cell-cycle regulatory system, and to evaluate and refine the integrative mathematical model of the budding yeast cell cycle (Moriya et al, 2006; Kaizu et al, 2010). The fission yeast Schizosaccharomyces pombe is distantly related to S. cerevisiae (Sipiczki, 2000), and like S. cerevisiae, is an established model eukaryote for the study of the molecular biology of the cell cycle (Egel, 2004). In this study, we developed a gTOW method using S. pombe and determined the copy number limits of 31 cell-cycle regulators. The data thus obtained were used to compare the robustness profiles of budding and fission yeasts in order to reveal the conserved/non-conserved properties of the eukaryotic cell cycle. The data were also used to constitute an integrative mathematical model of the fission yeast cell cycle.
Results
Development of plasmid vectors used for S. pombe gTOW
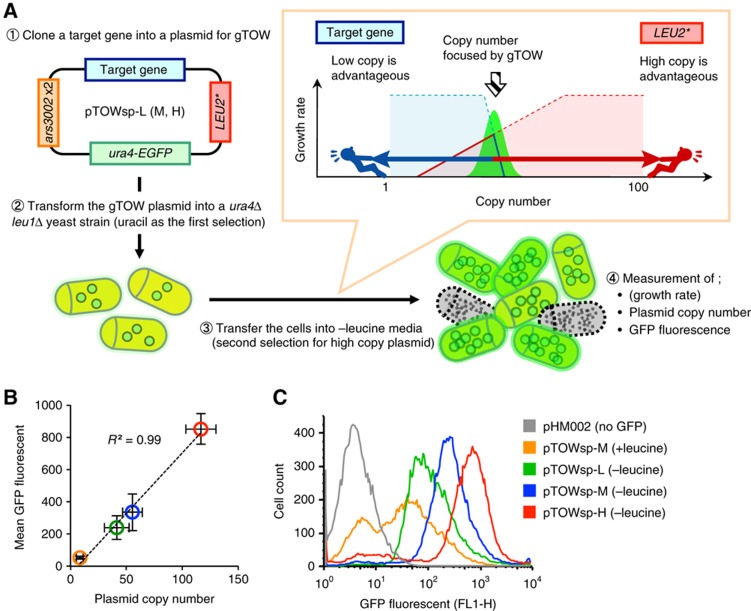
The scheme of S. pombe gTOW is described in Figure 1A. The plasmid for gTOW must have the following properties: (1) the copy number in each cell is multiple; (2) the copy number is diverse in each cell; and (3) the plasmid contains a gene with a selection bias for increasing the plasmid copy number (leu2d in the case of S. cerevisiae gTOW). Because S. pombe possesses no plasmid with the above properties, we first constructed plasmid vectors for use in S. pombe gTOW.
Figure 1.
gTOW in Schizosaccharomyces pombe. (A) The four steps in the gTOW experiment. (1) Each target gene is cloned into a plasmid for gTOW. (2) The plasmid is introduced into the leu1Δura4Δ cell (first selection is uracil). The plasmid copy number becomes ∼10 per cell due to ars3002 × 2 ORI. If the copy number limit of the target gene is <10 per cell, then the plasmid copy number is determined according to the limit. (3) The cells are transferred into leucine− media. In this condition, cells with a high plasmid copy number are selected according to the strength of expression of the leucine synthesizing enzyme gene LEU2. On the other hand, if the increase in the target gene (i.e., overexpression) is toxic to the cell, then the plasmid copy number must be less than the toxicity limit. The resulting tug-of-war of both selection biases determines the plasmid copy number within the cell, the number being close to the copy number limit of overexpression of the target gene. (4) To estimate the copy number limit of the target gene, the growth rate, GFP fluorescence of the cell, and the plasmid copy number within the cell are measured. In gTOW, the growth rate of the cell with the plasmid and the plasmid copy number within the cell should be mutually related (Moriya et al, 2006). We observed this trend in S. pombe, but measuring growth rate with a microplate reader, as described previously (Moriya et al, 2006), was unstable in this species. We thus cannot show the growth rate of the cell. (B) Comparison of the plasmid copy number determined by real-time PCR with mean GFP fluorescence of the cell determined by flow cytometry. A linear correlation between the plasmid copy number and the GFP fluorescence is observed. (C) Flow cytometric analysis of cellular distribution for each pTOW plasmid. pHM002 represents the control without GFP. In the leucine+ condition, no difference is observed among pTOWsp-L, -M, and -H.
Given below is a brief summary of the construction of the plasmid (details are given in Supplementary information). We used pDblet (Brun et al, 1995) for the backbone of the plasmid because it satisfies properties 1 and 2 above, and built S. cerevisiae LEU2 with promoter deletions into the plasmid to satisfy property 3. We first used S. cerevisiae leu2d (a LEU2 allele used in S. cerevisiae gTOW). In S. cerevisiae, the selection bias of leu2d to increase the plasmid copy number can be controlled by the leucine concentration in the medium (Moriya et al, 2006). However, this proved impossible in S. pombe because the final copy numbers of the leu2d plasmid (pTOWsp-H) were the same in media containing different leucine concentrations (data not shown). This is probably due to differences in the leucine-sensing mechanism between the yeasts. We thus optimized lengths of the LEU2 promoters (Supplementary Table S4) and developed three independent gTOW vectors (pTOWsp-L, pTOWsp-M, and pTOWsp-H) with different biases to increase plasmid copy numbers in leu1Δ S. pombe cells (Supplementary Figure S1). Average plasmid copy numbers of the plasmids in the leu1Δ cell in the leucine+ media (uracil− selection) were 8.5±3.3 (all three plasmids showed no difference), and in the leucine− media were ∼41.3±13.0, 55.4±11.3, and 116.8±7.0, respectively (Figure 1B; Supplementary Table S4). Differences between the gTOW vectors in S. cerevisiae and S. pombe are shown in Supplementary Table S5.
In each plasmid, Ura4-EGFP was expressed, such that distribution of the plasmid copy number within populations could be monitored. Distribution of the cells for each of the plasmids analyzed by flow cytometry is shown in Figure 1C. In the leucine+ condition (orange in Figure 1C), the plasmids tended to become lost because a portion of the cells showed the same fluorescence as the negative control (gray in Figure 1C). The average GFP fluorescence and copy number showed good correlation (Figure 1B), which indicates that GFP fluorescence is also useful in estimating the plasmid copy number within the cell.
Measuring copy number limits of cell division cycle regulator (cdc) genes using gTOW
We first selected 31 cdc genes (except byr4+, Table I) and measured their copy number limits using gTOW. These genes contain orthologs of the budding yeast cdc genes, which we had previously analyzed (Moriya et al, 2006). They also contained genes implemented into an integrative mathematical model described below. In gTOW, one needs to measure by how much the expression of a target gene can be increased from the native expression level; hence, whole regulatory elements on the 5′ and 3′ regions of the target ORF should be cloned into the plasmids. We thus cloned each target gene just before and after the neighboring ORFs (the case of cdc2 is shown in Supplementary Figure S3 as an example). In addition, we introduced frameshift mutations in five genes just after their start codons to test whether proteins expressed by these genes determine copy number limits (the structure of the frameshift mutant of cdc2 is shown in Supplementary Figure S4 as an example).
Table 1. Schizosaccharomyes pombe genes analyzed in this study.
| No. | Gene | Description |
|---|---|---|
| 1 | ark1+ | Aurora kinase |
| 2 | cdc2+ | Cyclin-dependent kinase |
| 3 | cdc7+ | Septation kinase |
| 4 | cdc10+ | G1 phase transcription factor |
| 5 | cdc13+ | B-type cyclin, M phase |
| 6 | cdc16+ | With Byr4, a two-component GEF for the GTPase Spg1 |
| 7 | cdc18+ | S-phase initiator/MCM loader |
| 8 | cdc25+ | CDK tyrosine phosphatase |
| 9 | chk1+ | Checkpoint kinase, damage response |
| 10 | cig1+ | B-type cyclin, function not clear |
| 11 | cig2+ | B-type cyclin in S phase |
| 12 | clp1+ | Phosphatase, involved in septation |
| 13 | csk1+ | CDK-activating kinase |
| 14 | cut1+ | Promotes anaphase, Separase |
| 15 | cut2+ | APC substrate, blocks Cut1, Securin |
| 16 | dfp1+ | Regulatory subunit of CDC7-type kinase |
| 17 | fkh2+ | Fork head transcription factor |
| 18 | hsk1+ | DBF4-dependent Kinase |
| 19 | mik1+ | CDK tyrosine kinase, overlaps with wee1+ |
| 20 | plo1+ | Polo-like kinase |
| 21 | puc1+ | Cyclin, acts in G1 at cell-cycle entry/exit |
| 22 | pyp3+ | CDK tyrosine phosphatase |
| 23 | ras1+ | Ras homolog |
| 24 | res1+ | Partner to Cdc10 transcription factor |
| 25 | res2+ | Partner to Cdc10 transcription factor |
| 26 | rum1+ | CDK inhibitor, functionally similar to Sic1 |
| 27 | sid2+ | Ser/Thr kinase, functions as part of a network in mitosis |
| 28 | slp1+ | APC activator |
| 29 | spg1+ | GTPase, involved in septation and mitotic exit |
| 30 | srw1+ | APC activator, WD protein |
| 31 | wee1+ | CDK tyrosine kinase |
| 32 | byr4+ | With Cdc16p, a two-component GEF for the GTPase Spg1 |
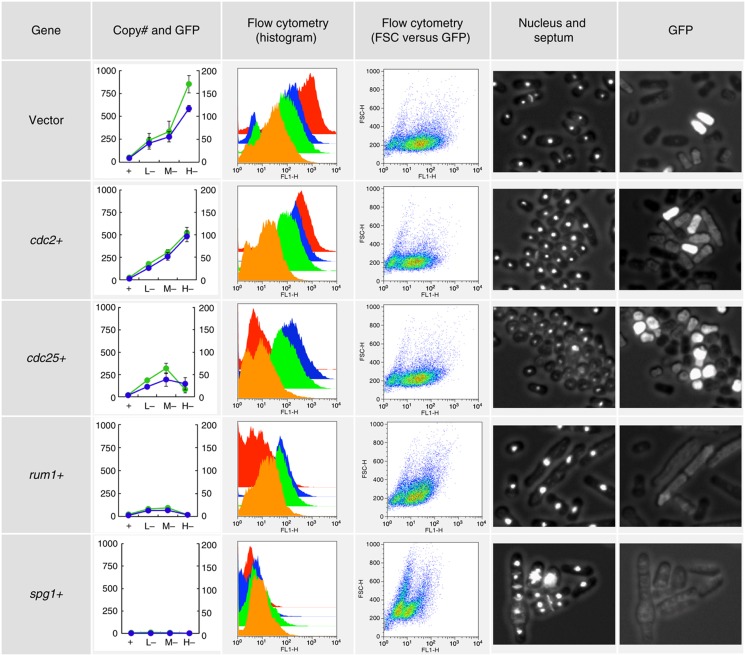
Each gene was cloned into pTOWsp-L, -M, and -H vectors, and at least two independent clones were studied for each gene. S. pombe cells with each plasmid were grown in leucine+ and leucine− (uracil−) media. After 48 h of cultivation for pTOWsp-L and -M plasmids and 72 h for pTOWsp-H plasmid, plasmid copy numbers within the cells and GFP fluorescence of the cells were measured and cellular morphologies were observed. Cell size distribution was also monitored as forward scattering (FSC) by flow cytometry, and some examples are shown in Figure 2. Using combinations of leucine+ and leucine− conditions with three vectors, the copy number limit of each gene could be determined precisely (second and third columns in Figure 2). Using fluorescent microscopy, we could assess how cells with high target gene copy numbers (brighter GFP fluorescence) died (fifth and sixth columns in Figure 2). For example, in the case of cdc25, the copy number limit could be determined by the pTOWsp-M vector, and cells became smaller in the leucine− condition. In the case of rum1, both cells and nuclei enlarged, while in the case of spg1, cells showed multiple septation. The pTOWsp-H vector for these genes showed a very strong bias for cells with the plasmid in the leucine− condition (red graphs in the FACS histogram in the third column of Figure 2).
Figure 2.
Examples of gTOW experiments with cdc genes in S. pombe. The experimental results obtained by gTOW with empty vector, cdc2+, cdc25+, rum1+, and spg1+ are shown (enlarged part of figure is shown in Supplementary Figure S5). First column: The plasmid copy number (blue graph, right vertical axis) and the mean GFP fluorescence (green graph, left vertical axis) in gTOW in leucine+ (indicated as ‘+’) and leucine− with each vector (pTOWsp-L, -M, and -H) are shown (indicated as ‘L−,’ ‘M−,’ and ‘H−,’ respectively). The original data are shown in Supplementary Tables S6 and S7. Second column: Cell distribution with GFP fluorescence in gTOW experiments in leucine+ (orange graph) and leucine− conditions with −L vector (green graph), −M vector (blue graph), and −H vector (red graph) are shown. Some experiments showed bimodality distributions. This is probably due to the plasmid loss, which is a property of the ars-based plasmid. Third column: Scatter plot between GFP fluorescence (FL-1) and cell size (FSC). Cells were cultured in the leucine+ condition. Fourth column: Fluorescent microscopic image of the cells cultured in the leucine+ condition. Nucleus and septum are stained. Fifth column: GFP fluorescence of the cells in the fourth column. The brightness reflects the plasmid copy number within the cell. The whole data set of above analysis for the genes analyzed in this study is provided upon request.
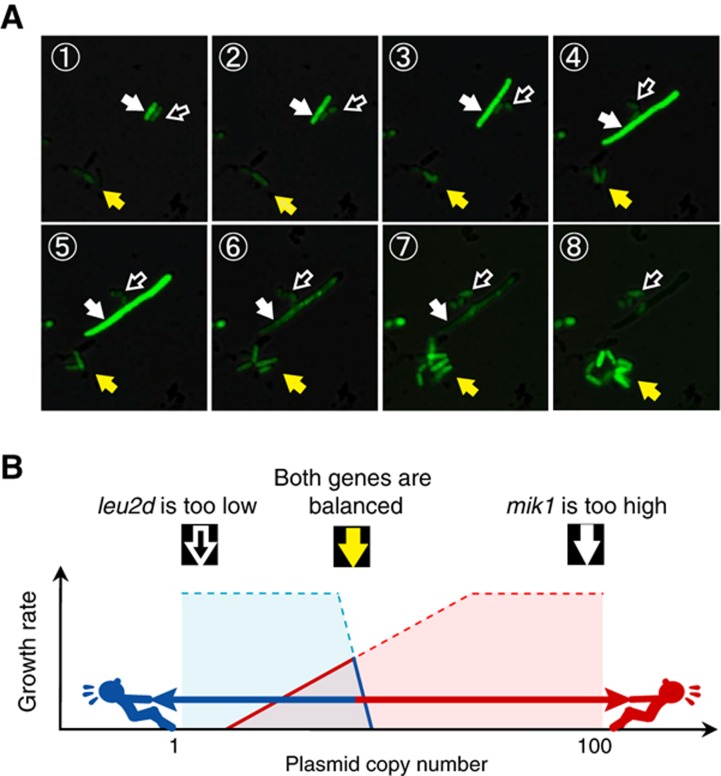
In addition, when we analyzed the gTOW experiments by time-lapse microscopy, we could assess how cells with high target gene copy numbers died. Figure 3 shows an example of time-lapse observation of a gTOW experiment with the target gene mik1+, which encodes a mitotic inhibitory kinase. Daughter cells with unequally distributed plasmid copy numbers had different fates; cells with low plasmid copy numbers barely grew, and after two cellular divisions growth ceased completely (black arrowhead in Figure 3). Cells with high plasmid copy numbers grew faster because they produced leucine but were unable to divide, resulting in elongation and eventual death (white arrowhead in Figure 3). On the other hand, cells with a balanced plasmid copy number maintained normal growth and division and accumulated in the media (yellow arrowhead in Figure 3).
Figure 3.
Time-lapse observation of gTOW experiment with the target gene mik1+. (A) FY7652 cells harboring the pTOWsp-H plasmid with the mitotic CDK inhibitor mik1+ were cultivated in EMM without leucine and were observed under fluorescent microscopy. The plasmid copy number in each cell was estimated from the intensity of GFP fluorescence. The black arrowhead with a white frame indicates a cell with very low plasmid copy number to synthesize a sufficient amount of leucine to support growth. The cell stops proliferating after the second cell division (frame 6). The white arrowhead indicates a cell with a sufficiently high plasmid copy number to synthesize enough leucine to support rapid cellular growth, but this number is beyond the copy number limit of mik1+. The cell thus cannot divide, becomes elongated (frames 3–5), and eventually dies (frame 6). The yellow arrowhead indicates cells with balanced plasmid copy number; the cells can grow and divide because they synthesize sufficient leucine. Cells with a plasmid copy number close to the limit of mik1+ thus become concentrated during cultivation. A video clip is provided in Supplementary information. (B) Assumed cellular situations in gTOW experiment are shown (A). The arrowheads correspond to the arrowheads in (A).
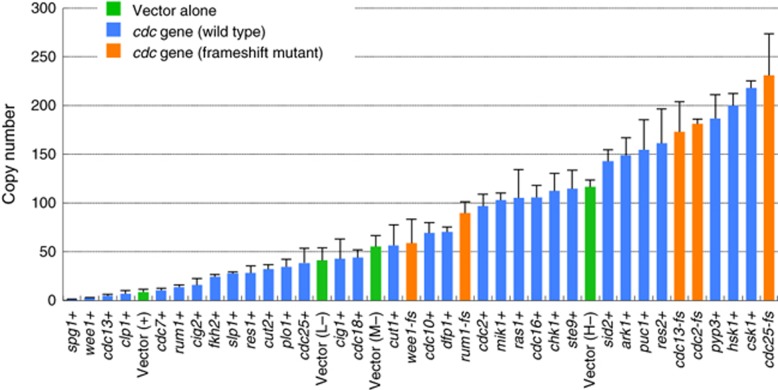
The copy number limits varied from 1 (one extra copy of the endogenous copy number kills the cell) to >100 (Figure 4), indicating that the cell-cycle regulatory system has a different robustness against overexpression of each gene, as observed in S. cerevisiae cell-cycle regulation (Moriya et al, 2006). The frameshift mutants generally showed much higher copy number limits than the wild types (orange bars in Figure 4), but the frameshift mutants of wee1 and rum1 had lower limits than the pTOWsp-H vector alone, probably because their frameshifts do not completely shut down protein expression. The morphology of cells with high copy frameshift mutant genes was similar to that of cells with high copies of their wild types (Supplementary Figure S6).
Figure 4.
Copy number limits of 30 cell-cycle regulators in S. pombe. The green bar indicates the plasmid copy number obtained in the gTOW experiment with each vector. The blue bar indicates the maximum plasmid copy number for each target gene obtained in the gTOW experiment with three different vectors. The orange bar indicates the maximum plasmid copy number for each target gene with frameshift mutation. The original data are shown in Supplementary Table S6. Because the cell has an endogenous copy of the target gene, the copy number limit for the target gene is the plasmid copy number plus 1.
Comparison of robustness profiles of cell-cycle regulation in S. cerevisiae and S. pombe
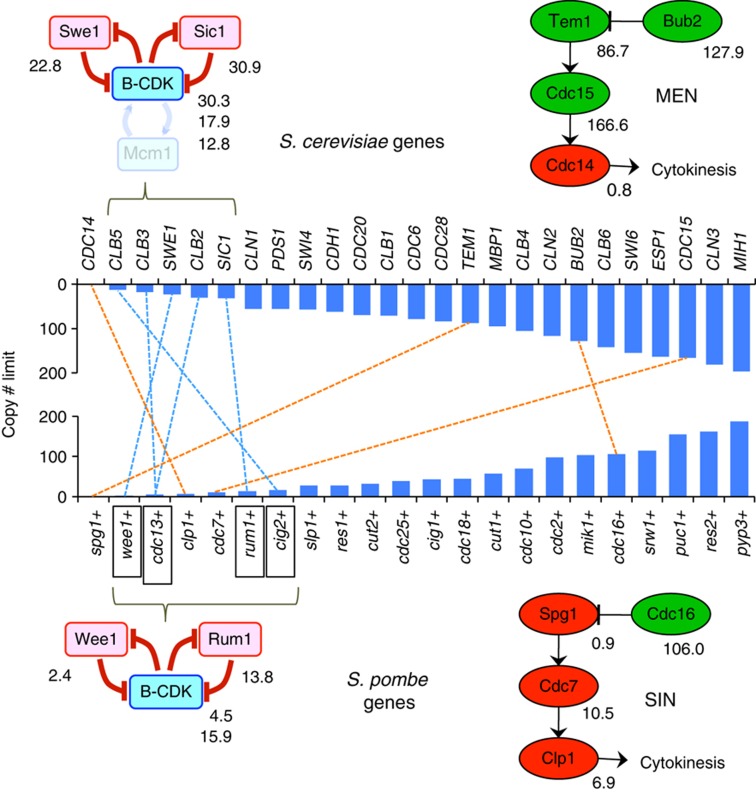
We next compared the copy number limits of the cdc genes determined in this study with that of the S. cerevisiae homologs determined previously (Moriya et al, 2006; Figure 5). S. pombe genes generally had lower copy number limits (average=52) than those of S. cerevisiae (average=87). We previously reported that cdc genes with lower limits constituted a fragile core that directly regulates the activity of B-type cyclin Cdk (Cyclin-dependent kinase) complexes (Moriya et al, 2006). The orthologs that constitute the core structure of S. pombe (Cdc13, Rum1, and Wee1) also demonstrated low limits, which may indicate the presence of a conserved fragile core in eukaryotic cell-cycle regulation. In contrast, the orthologous components of the mitotic exit network (MEN) of S. cerevisiae showed very different limits from those in the septation-initiation network (SIN) of S. pombe, although both networks have conserved architecture (Bardin and Amon, 2001; Krapp and Simanis, 2008). This might reflect the different physiologic functions in the two yeasts (namely, budding and fission), although these components have the same origin. These results suggest that comparison of robustness profiles is a useful way to reveal the conserved/non-conserved properties of cellular systems.
Figure 5.
Comparison of robustness profiles of cell-cycle regulation between S. cerevisiae and S. pombe. The dotted blue line connects the functional orthologs within the ‘fragile core’ conserved in both yeasts (left). The dotted orange line connects the functional orthologs involved in the cytokinesis regulatory pathway of both yeasts (MEN and SIN). Some components involved in both MEN and SIN are omitted from the diagrams because their copy number limits were not measured. Data for S. cerevisiae are obtained from a previous study (Moriya et al, 2006). The original data are shown in Supplementary Table S8.
Dosage imbalance causes very low limit of spg1
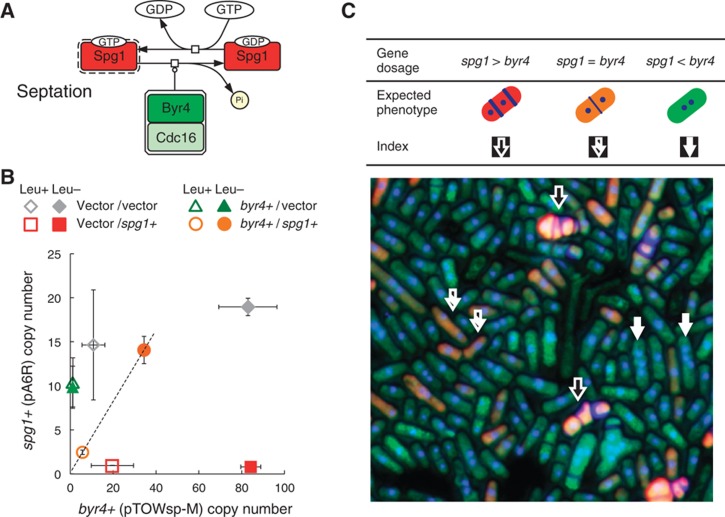
We recently demonstrated that the M-phase phosphatase gene CDC14 has a very low limit is because of the dosage imbalance between CDC14 and its inhibitor gene, NET1 (Kaizu et al, 2010). Hence, we investigated whether the low limit of spg1, the lowest copy number gene in S. pombe cell-cycle regulators evaluated in this study, was also due to dosage imbalance. spg1 encodes a small GTPase involved in the initiation of cellular septation; this activity is regulated by the bipartite GTPase-activating protein (GAP), which is encoded by both cdc16 and byr4 (Furge et al, 1998; Figure 6A). The copy number limit of cdc16 is quite high (Figure 4), and cells with high copy cdc16 did not show any obvious phenotype (data not shown). In contrast, the limit of byr4 was very low (1.8±0.2, measured by pTOWsp-L in the leucine+ condition). And cellular lethality due to overexpression of spg1 is nullified by the simultaneous overexpression of byr4 (Furge et al, 1998). We thus assume that proper activation of Spg1 is in delicate balance with Byr4, and hence, the limits of both spg1 and byr4 are quite low. To investigate whether spg1 and byr4 were in dosage balance, we performed two-dimensional (2D) gTOW (Kaizu et al, 2010). As shown in Figure 6B, byr4 limits increased only when multicopy spg1 was supplied by another plasmid. Moreover, their copy numbers were balanced (Figure 6B, dotted line). Microscopic observation also confirmed our assumption that cells can divide normally only when spg1 and byr4 expressions are balanced (Figure 6C). These results strongly support the theory that spg1 has a very low limit because of the sensitive balance required for GTPase activity.
Figure 6.
The very low limit for spg1 is due to dosage imbalance with byr4. (A) To trigger cellular septation, GTPase Spg1 and its GAP Byr4 function in an antagonistic manner. The molecular interactions are given with Systems Biology Graphical Notation (SBGN) using CellDesigner 4.1 (http://www.celldesigner.org). (B) 2D-gTOW experiment between spg1 and byr4. The copy numbers of spg1 and byr4 can be increased only when both gene copy numbers are balanced (dotted line). Extra copies of spg1+ are supplied by the pA6R plasmid, and extra copies of byr4+ are supplied by the pTOWsp-M plasmid. (C) Microscopic image of cells by 2D-gTOW experiment involving spg1 and byr4. Sp286h+ cells with pTOWsp-M with byr4 and pA6R with spg1 were cultivated in EMM with leucine. GFP (reflecting the byr4 copy number), RFP (reflecting the spg1 copy number), the nucleus, and the septum were observed. Expected phenotypes of the cells within the dosage balance between spg1 and byr4, and the indices within the image are shown.
Development of an integrative mathematical model that reproduces the robustness of cell-cycle regulation in S. pombe
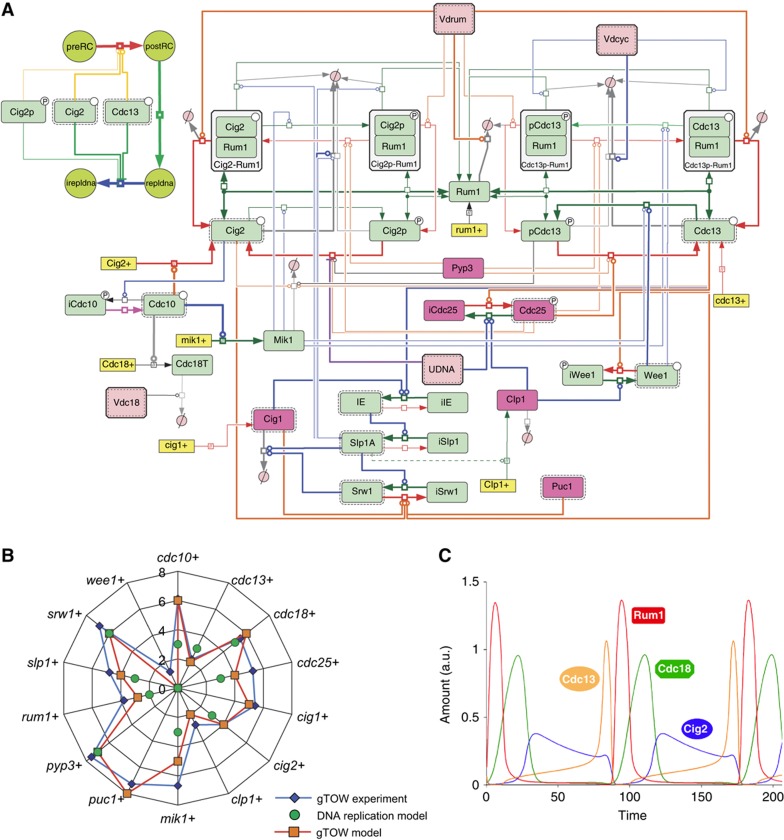
Robustness can be a measure of plausibility in mathematical models of biological networks (Morohashi et al, 2002). We previously used copy number limits obtained for S. cerevisiae gTOW to evaluate and refine an integrative mathematical model of the S. cerevisiae cell cycle (Chen et al, 2004; Moriya et al, 2006; Kaizu et al, 2010). We thus evaluated and refined the integrative mathematical model, such that the model reproduces robustness (copy number limits of genes) of the S. pombe cell cycle obtained from this study. We previously published a mathematical model for S. pombe cell-cycle regulation (Novak and Tyson, 1997; Sveiczer et al, 2000), and have independently modified the model from the gTOW experiment, such that the model reproduces more published experimental results. Here, we designated the model ‘basic model,’ the whole structure of which is shown in Figure 7A (green components; the simplified structure is shown in Supplementary Figure S8). We first investigated to what degree the core model reproduced the copy number limits obtained in this study (see Supplementary information for details). Although we did not use the gTOW data for development of the model, the model predicted the experimental data well (Figure 7B, green circles), and appeared to capture the robustness of fission yeast cell-cycle regulation. To describe the gTOW data more extensively, we modified the basic model by adding some important regulators (M-phase phosphatase Clp1, cyclins Cig1 and Puc1) and regulations, and the parameters were optimized by-hand parameter adjustments (we designated the model ‘gTOW model,’ shown in red in Figure 7A; see also Supplementary Figure S8). The model successfully reproduced the copy number limits obtained in this study (Figure 7B, orange squares). In addition, the model could also reproduce 42 already published mutant behaviors (Supplementary Table S10). The result of time-course simulation of the model is shown in Figure 7C. As a result, we can claim that the presented ‘gTOW’ model is the most detailed model of fission yeast cell-cycle regulation so far.
Figure 7.
Mathematical model reproducing gTOW data. (A) Whole structure of the mathematical model of the fission yeast cell cycle developed in this study (gTOW model) given with Systems Biology Graphical Notation (SBGN) using CellDesigner 4.1. Pink colored components are the ones added to the ‘basic model’ to make the ‘gTOW model’. CellDesigner file and Systems Biology Markup Language (SBML) file are provided in Supplementary information. (B) Comparison of the copy number limits of cell-cycle regulators between the data obtained by gTOW and prediction of the mathematical model. Scale of the axis=log2. (C) Time-course simulation result of the gTOW model.
Increase of each Cdc2/cyclin complex, but not the depletion of Cdc2/Cdc13 through the competition for Cdc2, determines the upper limits of cyclins (cig1, cig2, and puc1)
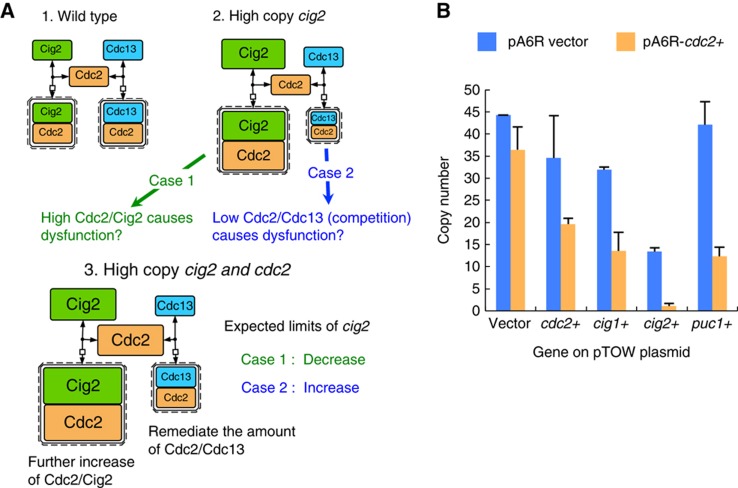
S. pombe contains four cyclins (Cdc13, Cig1, Cig2, and Puc1), all of which bind to Cdc2 to form a Cdc2/cyclin complex that performs regulatory functions on Cdc2 (Figure 8A). Cdk's (like Cdc2) are thought to be in excess of cyclins, but in S. cerevisiae it is not tremendously so (Cross et al, 2002). It is thus possible that if cyclins compete with each other for Cdc2, overexpression of one of the cyclins would interfere in formation of other Cdc2/cyclin complexes. Especially since deletion of Cdc13 can lead to lethality, there is a chance that overexpression of the other cyclins is deleterious for the cells because Cdc2 is titrated away from Cdc13 (Figure 8A-2, case2). In other words, the overexpression limit of each cyclin may be determined by the increased Cdc2/cyclin activity itself (Figure 8A-2, case1) or by the reduction of Cdc2/Cdc13 complex. To answer this question, we first used the mathematical model to investigate which conditions involve cyclins in competitive situations, and the experimental means to test these conditions. In the gTOW model (and in the basic model), each cyclin is considered to form a Cdc2/cyclin complex immediately after its expression; thus, no monomer cyclins or Cdc2 would be available and one cannot simulate competition with these models. Hence, we further modified the gTOW model, such that the behavior of monomer cyclins and Cdc2 could be simulated (green components in Supplementary Figure S8).
Figure 8.
2D-gTOW analysis to test the cyclin competition. (A) There are two possibilities determining the limits of cyclins. The case in cig2, as an example is shown. (1) In wild type, both Cig2 and Cdc13, and their Cdc2 complexes are balanced. (2) Upon high copy of cig2, there are two possible mechanisms to cause cell-cycle dysfunction. Case1: high Cdc2/Cig2 activity itself causes the dysfunction. Case2: Low Cdc2/Cdc13 activity due to the competition of cyclins for Cdc2 causes the dysfunction. (3) Both possibilities can be tested by the experiment increasing cig2 and cdc2 simultaneously, which situation leads to further increase of Cdc2/Cig2, as well as remediation of the amount of Cdc2/Cdc13. In this situation, the limit of cig2 should be increased if Case1 is true, and the limit of cig2 should be decreased if Case2 is true. (B) Testing cyclin competition. The copy number limit of each cyclin gene with increased cdc2 copy number (supplied by the pA6R plasmid) was measured. pTOWsp-M was used as the gTOW vector. The copy number for pTOW was measured in the leucine− condition.
We first investigated the parameters of the condition in which cyclin competition occurs using this model, and observed that the condition is determined by a combination of the dissociation constant of Cdc2/cyclin and total Cdc2 level, and that this condition can be experimentally evaluated by measuring the copy number limit of each cyclin in the Cdc2 overexpression condition (Supplementary Table S12; Figure 8A-3). If the limit is decreased, then the limit should be determined by an increase in the Cdc2/cyclin activity itself; and if the limit is increased, then the limit should be determined by the reduction of Cdc2/Cdc13 (competition). Figure 8B shows the copy number limits of cig1, cig2, and puc1 with multicopy cdc2; in all cases, the limits were decreased. We thus concluded that upper limits of cyclin genes are determined because of the high Cdc2/cyclin (Cig1, Cig2, and Puc1) activity itself, but not the depletion of Cdc2/Cdc13. This conclusion is supported by the phenotypic observation of gTOW-cig1+, -cig2+, and puc1+ cells (Supplementary Figure S7). The cells did not show any elongated cellular morphology, which is a typical cellular phenotype when Cdc13-Cdc2 activity is depleted.
Comparison of 2D-gTOW data in silico and in vivo revealed uncovered regulations in the cell cycle
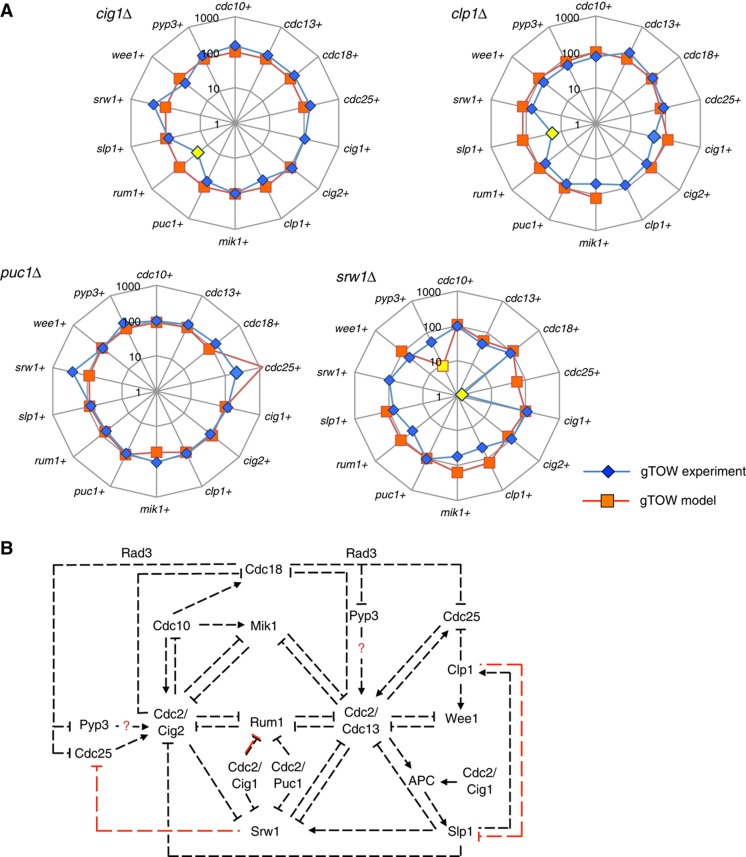
One of the practical values of the existence of the integrative mathematical model, just as we developed in this study, is that we can define the limit of our understanding and find novel biological knowledge using the model predictions as references of experimental results. We thus measured the copy number limits of the cell-cycle regulators in the deletion strains, and compared the data with the model prediction in Supplementary Table S11. This ‘2D-gTOW experiment’ was performed with the deletion strain of each of four genes (cig1, clp1, puc1, and srw1). We chose these genes because the deletion of them does not give so much impact for the upper limits of the other cell-cycle regulators in the model (Figure 9A; Supplementary Table S11). We thus expected that we could reveal uncovered regulations.
Figure 9.
Testing the gTOW model with 2D-gTOW experiments. (A) Comparison of upper limits of cell-cycle regulators in clp1Δ, cig1Δ, puc1Δ, and srw1Δ strains between the model prediction (orange) and experimental data (blue). The percentage of mutant/wild type is shown. Yellow marker indicates that the upper limit in the mutant strain is significantly less than the wild type (copy number is < 30% and P-value is <0.05). The large discrepancy between the model and experiment in the upper limit of pyp3+ in the srw1Δ is also shown in yellow marker. The complete experimental data set is shown in Supplementary Table S9. (B) Regulatory interactions among cell-cycle regulators in the fission yeast cell-cycle control network mathematically reconstituted in the gTOW model. Arrows and blocked end lines represent the simulation of synthesis (or activation) and repression of synthesis (or inhibition). Red lines indicate the potential novel regulations proposed by comparison of the gTOW model and 2D-gTOW data shown in (A). Red question marks refer the regulations with uncertain strengths in the model. Possible mechanisms for these regulations are described in Discussion.
In fact, we found some discrepancies between the gTOW experimental data and the gTOW model predictions (Figure 9A). The rum1 limit in cig1Δ, the slp1 limit in clp1Δ, and cdc25 limit in srw1Δ were much lower than the model prediction. The pyp3 limit in srw1Δ was much higher than the model prediction. These results suggested additional regulations and wrong assumptions within the current gTOW model (summarized in Figure 9B).
Discussion
gTOW in S. pombe
In this study, we developed a gTOW method in the fission yeast S. pombe. gTOW vectors in S. pombe have different biases for increasing the plasmid copy number. These vectors also have GFP, such that distribution of the plasmid copy numbers can be monitored by flow cytometry, or the plasmid copy number in a single cell can be estimated under fluorescent microscopy. In S. pombe, the nmt1 promoter has been often used to overexpress genes, but the upper limit is difficult to determine by this method. Thus, gTOW provides another means for overexpression of genes and for obtaining unique data to investigate the robustness of cellular systems in S. pombe.
Robustness and fragility in cell-cycle regulation in S. pombe and S. cerevisiae
S. cerevisiae and S. pombe appear to have conserved fragility in the subsystem that directly regulates B-type cyclin Cdk1 activity (Figure 5). Because these species are distantly related, with an evolutional distance of several hundred million years (Sipiczki, 2000), fragility in B-type Cdk regulation would be conserved among eukaryotes. In contrast, networks regulating cytokinesis (MEN in S. cerevisiae and SIN in S. pombe) showed different robustness profiles (Figure 5), which might reflect their different systems of cellular division (budding and fission). Hence, comparison of robustness profiles would be useful to reveal the conserved properties of cellular systems.
In the cell-cycle regulation of S. cerevisiae, the Cdk1-counteracting phosphatase gene CDC14 had the lowest copy number limit, the reason being dosage imbalance against the inhibitor gene NET1 (Kaizu et al, 2010). The relatively high copy number limit of clp1, the S. pombe ortholog of CDC14, may be explained by the fact that Clp1 does not have a stoichiometric inhibitor (it seems there is an ortholog of Net1, but acts differently; Jin et al, 2007). In this study, we showed that the small GTPase gene spg1, the gene with the lowest copy number limit among the S. pombe cell-cycle regulators, was also in dosage balance with the GAP gene byr4 (Figure 6). We therefore believe that dosage imbalance is a general mechanism for inducing cellular fragility in case of gene overexpression.
Integrative mathematical model of cell-cycle regulation in S. pombe
In this study, we evaluated and modified mathematical models constituted from molecular knowledge using gTOW data. Although the initial model (the basic model) was independently developed from gTOW experiments, the model predicted the experimental results well (Figure 7A). This model is a quantitative model in which biochemical parameters had not been experimentally determined, but it already appears to have captured the robustness characteristics of the S. pombe cell cycle.
By addition of certain components to the model and optimization of parameters, we successfully developed a model (the gTOW model) to reproduce the gTOW data obtained in this study (Figure 7A) and the behavior of 42 other mutants (Supplementary Table S10). The model provided us with two types of predictions that should be evaluated by further research. One of these predictions concerns the effect of gene overexpression on phenotype. With simulations using the gTOW model, three different cell-cycle defects were observed due to overexpression of each gene (Supplementary Figure S11). Interestingly, the model predicted that rum1 overexpression results in three independent phenotypes according to the level of overexpression (Supplementary Figure S12).
The other prediction concerns the copy number limits of each gene in its deletion strains (Supplementary Table S11). Upon comparison with the data in vivo, this type of prediction is quite useful to find additional regulations that are not implemented in the model (Kaizu et al, 2010). In this study, we measured upper limits of cell-cycle regulators in four deletion mutant strains, which suggest some novel regulations in the network lacking in our model (Figure 9). We thus showed that the prediction of the model was quite useful reference to indicate the existence of additional (unknown) regulations conferring the robustness of the cell cycle. We propose that the following potential regulatory mechanisms provide an explanation for the 2D-gTOW data in Figure 9.
(1) Low rum1 limit in cig1Δ: Cig1 might be more important for Rum1 degradation than it is assumed in the model.
(2) Low slp1 limit in clp1Δ: Clp1 might negatively regulate Slp1 activity or the level that is absent in clp1Δ background.
(3) Low cdc25 in srw1Δ: Srw1 might be important for degradation of Cdc25.
(4) Low pyp3 limit in srw1Δ in the model but not in the experiment: Pyp3 might be less important as a Cdc25 backup phosphatase than it is assumed in the model.
At this point, we did not modify the gTOW model with these suggested regulatory interactions because they are still hypothetical. These hypothetical regulations should be tested with additional experiments and the model will be refined with the regulations, just as we did in the budding yeast case (Kaizu et al, 2010).
Evaluation and refinement of integrative mathematical model using robustness information
A considerable body of knowledge has been accumulated for the fission yeast S. pombe and for the molecular details of the regulation of its cell cycle (Nurse, 2002), and this knowledge has been integrated into mathematical models before (Novak and Tyson, 1997; Sveiczer et al, 2000), and further developed in this study. These integrative mathematical models are expected to have very important roles in future life sciences because they can be used to predict behaviors of complicated biological systems that are difficult to handle intuitively.
These models are generally constructed according to the accumulated knowledge on the interactions between relevant molecules, but information on biochemical parameters needed to describe the strength and speed of interactions is usually lacking. Although these parameters are important to guarantee the plausibility of these models, it is sometimes technically difficult to obtain these biochemical parameters experimentally.
On the other hand, it is considered that these parameters should have some permissible ranges because biological systems have robustness (Barkai and Leibler, 1997; Little et al, 1999; von Dassow et al, 2000). Because the permissible ranges have emerged from interactions of components within the system, they are useful indicators for evaluation of the network structures of biological models (Morohashi et al, 2002; Moriya et al, 2006; Kaizu et al, 2010). In this study, we performed experiments to measure the permissible range of gene overexpression and used the data obtained to evaluate and modify the mathematical model. We believe this is a useful scheme for development of integrative mathematical models in which direct experimental measurement of biochemical parameters is difficult.
Materials and methods
Strains
Saccharomyces cerevisiae strain BY4741 (MATa, his3Δ1, leu2Δ0, met15Δ0, ura3Δ0) (Brachmann et al, 1998) was used for plasmid construction by the gap-repair cloning method (Oldenburg et al, 1997). Schizosaccharomyces pombe strain FY7652 (h− leu1-32 ura4-D18) obtained from NBRP yeast was used for gTOW, apart from 2D-gTOW (byr4 versus spg1 and cyclins versus cdc2). In 2D-gTOW of S. pombe, Sp286h+ (h+ ade6 ura4-D18 leu1-32), a haploid progeny of Sp286 (BG_0000, Bioneer) was used. For clp1Δ, cig1Δ, puc1Δ, and srw1Δ strains, haploid progenies of BG_0465, BG_4780, BG_4172, and BG_0289 (Bioneer) were used, respectively. The Escherichia coli strain XL1-blue (Stratagene) was used for plasmid amplification.
Media and growth conditions
YPD and SC medium were used for cultivation of S. cerevisiae and LB broth for E. coli. S. pombe cells were cultured in a manner similar to that described by Moreno et al (1991). EMM medium and plates were prepared using EMM broth powder (MP Biomedicals). Yeast transformation was performed using the LiOAc method (Amberg et al, 2005). Yeasts and E. coli were cultivated at 30 and 37°C, respectively.
Plasmids used in this study
Plasmid vectors used in this study are listed in Supplementary Table S1. Construction details of the plasmids used in this study are described in Supplementary Information. The vectors pTOWsp-L, pTOWsp-M, pTOWsp-H, and pA6R are available from the National BioResource Project (http://yeast.lab.nig.ac.jp/nig/index_en.html). The DNA sequences are provided in Supplementary information.
Measurement of plasmid copy number in S. pombe cells
S. pombe cells with pTOWsp containing target genes were grown in EMM without uracil, transferred into EMM without leucine and uracil, and then cultivated for 48 h (for cells with pTOWsp-L- and -M-based plasmids) or 72 h (for cells with pTOWsp-H-based plasmids). In 2D-gTOW shown in Figures 6B and 8B, pTOW and pA6R derivatives were introduced into Sp286h+ cells, and the cells were grown in EMM without uracil and adenine; they were then transferred into EMM without leucine, uracil, and adenine and cultivated for 48 h. EMM was prepared using EMM broth powder (MP Biomedicals). The plasmid dosage in a yeast cell was determined using real-time PCR, as described previously (Moriya et al, 2006), except that the pombe-1 primer set (5′-CCCTCAGTTGCTTCTCCTAA-3′ and 5′-GTGACTTCGTGAATCAAGTG-3′), the ura4-3 primer set (5′-TCTTTGGCTACTGGTTCCTA-3′ and 5′-TATGTAGTCGCTTTGAAGGT-3′), and the ade6-1 primer set (5′-GCCCATCGCTTAAACATCA-3′ and 5′-TGCATCGGGGTCAGTAAAT-3′) were used for quantification of genomic DNA, pTOW plasmids, and pA6R plasmids, respectively. Data are averages of at least two independent experiments.
The copy number determined by PCR using the ura4-3 primer is directly associated with the plasmid copy number in the cell because no sequence on the genomes of FY7652 or Sp286h+ is amplified by the ura4-3 primer set. In contrast, the copy number determined by PCR using the ade6-1 primer is one copy more than the plasmid copy number in the cell because an ade6 sequence on the genome of Sp286h+ is amplified by the primer set. The plasmid copy number is shown in all figures and tables. The copy number of a target gene in the wild-type cell is one copy more than the plasmid copy number as a result of one endogenous copy on the genome.
Analysis of S. pombe cells by flow cytometry
Cells expressing EGFP were directly analyzed by flow cytometry (FACScalibur; Becton, Dickinson and Company). EGFP fluorescence was detected as FL-1, and cell size was monitored as FSC. The data were analyzed using the FlowJo7 software (http://www.flowjo.com).
Microscopic observation of S. pombe cells
Cells were fixed by 70% ethanol for >10 min, pelleted, and resuspended in the VECTASHIELD mounting medium with DAPI (1/2 diluted with water, Vector Laboratories) and Fluorescent Brighter 28 (final concentration 10 μg/ml; Sigma). The cell suspension (2 μl) was spotted onto a glass slide and covered with an 18-mm coverslip. The coverslip was sealed with nail polish, and the slide was observed using the Leica DMI 6000B microscope (Leica Microsystems). GFP fluorescence, DAPI and Fluorescent Brighter 28 fluorescence, and RFP fluorescence, were observed with GFP, A, and RFP filter cubes (Leica Microsystems), respectively.
Computation
Development of mathematical models and their simulations results are described in Supplementary information. The model files for XPP-AUT and CellDesigner 4.2 are attached in Supplementary information. The SBML file of the gTOW model shown in Figure 7A can be obtained from BioModels database (http://www.ebi.ac.uk/biomodels-main/) (ID: MODEL1111040000).
Supplementary Material
Supplementary Figures S1–13, Supplementary Tables S1–12
This compressed zipped archive contains plasmid sequence files described below
This compressed zipped archive contains ode model files described below
CellDesigner4.2 file of the gTOW model
SBML file of the gTOW model
Time-lapse microscopic observation of gTOW experiment with mik1+ gene
Acknowledgments
We would like to thank Hiroaki Kitano (Sony CSL), Yuki Yoshida (Sony CSL), Kazunari Kaizu (RIKEN), and Koji Makanae (Okayama University) for their valuable discussions with regard to this project, to Akos Sveiczer (BUTE) for his help at initial stages of modeling. We would also like to thank the Yeast Genetic Resource Center (YGRC), Japan, which is supported by the National BioResource Project (NBRP), for providing us with the S. pombe strain FY7652. This work was supported in part by PRESTO program and Strategic International Cooperative Program of Japan Science and Technology Agency; the Special Coordination Fund for Promoting Sciences and Technology and a Grants-in-Aid for Scientific Research on Innovative Areas ‘The Physicochemical Field for Genetic Activities’ of Ministry of Education, Culture, Sports, Science, and Technology. The funders had no role in study design, data collection and analysis, decision to publish, or preparation of the manuscript.
Author contributions: HM conceived and designed the experiments. AC and HM performed the experiments and analyzed the data. OK, ACN, and BN performed the computational analysis. HM wrote the paper.
Footnotes
The authors declare that they have no conflict of interest.
References
- Albertson DG (2006) Gene amplification in cancer. Trends Genet 22: 447–455 [DOI] [PubMed] [Google Scholar]
- Alon U, Surette MG, Barkai N, Leibler S (1999) Robustness in bacterial chemotaxis. Nature 397: 168–171 [DOI] [PubMed] [Google Scholar]
- Amberg DC, Burke DJ, Strathern NJ (2005) Methods in Yeast Genetics. Cold Spring Harbor, New York: Cold Spring Harbor Laboratory Press [Google Scholar]
- Bardin AJ, Amon A (2001) Men and sin: what's the difference? Nat Rev Mol Cell Biol 2: 815–826 [DOI] [PubMed] [Google Scholar]
- Barkai N, Leibler S (1997) Robustness in simple biochemical networks. Nature 387: 913–917 [DOI] [PubMed] [Google Scholar]
- Brachmann CB, Davies A, Cost GJ, Caputo E, Li J, Hieter P, Boeke JD (1998) Designer deletion strains derived from Saccharomyces cerevisiae S288C: a useful set of strains and plasmids for PCR-mediated gene disruption and other applications. Yeast 14: 115–132 [DOI] [PubMed] [Google Scholar]
- Brun C, Dubey DD, Huberman JA (1995) pDblet, a stable autonomously replicating shuttle vector for Schizosaccharomyces pombe. Gene 164: 173–177 [DOI] [PubMed] [Google Scholar]
- Chen KC, Calzone L, Csikasz-Nagy A, Cross FR, Novak B, Tyson JJ (2004) Integrative analysis of cell cycle control in budding yeast. Mol Biol Cell 15: 3841–3862 [DOI] [PMC free article] [PubMed] [Google Scholar]
- Cross FR, Archambault V, Miller M, Klovstad M (2002) Testing a mathematical model of the yeast cell cycle. Mol Biol Cell 13: 52–70 [DOI] [PMC free article] [PubMed] [Google Scholar]
- Dekel E, Alon U (2005) Optimality and evolutionary tuning of the expression level of a protein. Nature 436: 588–592 [DOI] [PubMed] [Google Scholar]
- Egel R (2004) The Molecular Biology of Schizosaccharomyces Pombe. Berlin, Heidelberg, New York: Springer Verlag [Google Scholar]
- Furge KA, Wong K, Armstrong J, Balasubramanian M, Albright CF (1998) Byr4 and Cdc16 form a two-component GTPase-activating protein for the Spg1 GTPase that controls septation in fission yeast. Curr Biol 8: 947–954 [DOI] [PubMed] [Google Scholar]
- Jin QW, Ray S, Choi SH, McCollum D (2007) The nucleolar Net1/Cfi1-related protein Dnt1 antagonizes the septation initiation network in fission yeast. Mol Biol Cell 18: 2924–2934 [DOI] [PMC free article] [PubMed] [Google Scholar]
- Kaizu K, Moriya H, Kitano H (2010) Fragilities caused by dosage imbalance in regulation of the budding yeast cell cycle. PLoS Genet 6: e1000919. [DOI] [PMC free article] [PubMed] [Google Scholar]
- Krapp A, Simanis V (2008) An overview of the fission yeast septation initiation network (SIN). Biochem Soc Trans 36: 411–415 [DOI] [PubMed] [Google Scholar]
- Little JW, Shepley DP, Wert DW (1999) Robustness of a gene regulatory circuit. EMBO J 18: 4299–4307 [DOI] [PMC free article] [PubMed] [Google Scholar]
- Moreno S, Klar A, Nurse P (1991) Molecular genetic analysis of fission yeast Schizosaccharomyces pombe. Methods Enzymol 194: 795–823 [DOI] [PubMed] [Google Scholar]
- Moriya H, Shimizu-Yoshida Y, Kitano H (2006) In vivo robustness analysis of cell division cycle genes in Saccharomyces cerevisiae. PLoS Genet 2: e111. [DOI] [PMC free article] [PubMed] [Google Scholar]
- Morohashi M, Winn AE, Borisuk MT, Bolouri H, Doyle J, Kitano H (2002) Robustness as a measure of plausibility in models of biochemical networks. J Theor Biol 216: 19–30 [DOI] [PubMed] [Google Scholar]
- Novak B, Tyson JJ (1997) Modeling the control of DNA replication in fission yeast. Proc Natl Acad Sci USA 94: 9147–9152 [DOI] [PMC free article] [PubMed] [Google Scholar]
- Nurse P (2002) Cyclin dependent kinases and cell cycle control (nobel lecture). Chembiochem 3: 596–603 [DOI] [PubMed] [Google Scholar]
- Oldenburg KR, Vo KT, Michaelis S, Paddon C (1997) Recombination-mediated PCR-directed plasmid construction in vivo in yeast. Nucleic Acids Res 25: 451–452 [DOI] [PMC free article] [PubMed] [Google Scholar]
- Sipiczki M (2000) Where does fission yeast sit on the tree of life? Genome Biol 1: REVIEWS1011. [DOI] [PMC free article] [PubMed] [Google Scholar]
- Sveiczer A, Csikasz-Nagy A, Gyorffy B, Tyson JJ, Novak B (2000) Modeling the fission yeast cell cycle: quantized cycle times in wee1- cdc25Delta mutant cells. Proc Natl Acad Sci USA 97: 7865–7870 [DOI] [PMC free article] [PubMed] [Google Scholar]
- von Dassow G, Meir E, Munro EM, Odell GM (2000) The segment polarity network is a robust developmental module. Nature 406: 188–192 [DOI] [PubMed] [Google Scholar]
- Wagner A (2005) Energy constraints on the evolution of gene expression. Mol Biol Evol 22: 1365–1374 [DOI] [PubMed] [Google Scholar]
- Zaslaver A, Mayo AE, Rosenberg R, Bashkin P, Sberro H, Tsalyuk M, Surette MG, Alon U (2004) Just-in-time transcription program in metabolic pathways. Nat Genet 36: 486–491 [DOI] [PubMed] [Google Scholar]
Associated Data
This section collects any data citations, data availability statements, or supplementary materials included in this article.
Supplementary Materials
Supplementary Figures S1–13, Supplementary Tables S1–12
This compressed zipped archive contains plasmid sequence files described below
This compressed zipped archive contains ode model files described below
CellDesigner4.2 file of the gTOW model
SBML file of the gTOW model
Time-lapse microscopic observation of gTOW experiment with mik1+ gene


