

Abstract
In order to understand information processing in neural circuits, it is necessary to detect both electrical and chemical signaling with high spatial and temporal resolution. Although the primary currency of neural information processing is electrical, many of the downstream effects of the electrical signals on the circuits that generate them are dependent on activity-dependent increases in intracellular calcium concentration. It is therefore of great utility to be able to record electrical signals in neural circuits at multiple sites while at the same time detecting optical signals from reporters of intracellular calcium levels. We describe here a microfluidic multi-electrode array (MMEA) capable of high-resolution extracellular recording from brain slices that is optically compatible with calcium imaging at single cell resolution. We show the application of the MMEA device to record waves of spontaneous activity in developing cortical slices and to perform multi-site extracellular recordings during simultaneous calcium imaging of activity. The MMEA has the unique capability to simultaneously allow focal electrical and chemical stimuli at different locations of the surface of a brain slice.
Introduction
Waves of spontaneous electrical activity are widespread during early stages of central nervous system development and are important for processes such as circuit formation and neuronal migration1. In the cerebral cortex, these waves follow stereotyped patterns of propagation and transmitter dependence that change as a function of developmental stage2–4. Although this activity has been observed for some time, the mechanisms of spontaneous activity and its influence on development are not well understood, in part due to the difficulty of characterizing the complex temporal, spatial, and biochemical characteristics of the process.
The electrical component of neurological signaling is important because it is the most technologically relevant for interfacing with the brain. Therapies such as deep brain stimulation can alleviate neurological symptoms of disorders such as Parkinson’s disease and epilepsy, although the specific mechanisms are not understood5–7. Direct reading of electrophysiological signals through implanted or external electrodes is highly relevant for applications such as neural prosthetics and brain-computer interfacing8–10. Traditional electrophysiological methods utilize electrolyte-filled glass electrodes or micropatterned metal multi-electrode arrays (MEA) to detect electrical signals from neurons or apply electrical stimuli11–13. Glass recording pipettes can be precisely positioned and can be used to obtain single-cell or multi-cellular signals in extracellular or intracellular modes. The glass pipettes are limited in that they require a skilled operator and that it is difficult to make large numbers of simultaneous measurements at different anatomical positions. MEAs can be utilized to take simultaneous measurements from hundreds of sites simultaneously, however the metal/cell interface introduces artifacts such as voltage drift13,14. Although transparent MEAs exist, they are optically inferior to glass, which complicates imaging. Recent advances in MEA technology on flexible and conformable substrates suggest that soft materials such as polymers have advantages for electrophysiology devices compared with traditional glass substrates15. Microscopy is widely used to characterize neurological circuits through the use of voltage- and calcium-sensitive dyes. Although these methods are powerful for visualizing activity, they are indirect reporters of the activity itself. The kinetics of the dye response is often slow with respect to the speed of the neurological signals that are being detected, and the actual intracellular calcium transients themselves depend on only a subset of the ion channels that underlie the electrical activity. It is of interest to record activity both electrophysiologically, because propagation of signals within neural circuits is essential electrical in nature, and by detection of intracellular calcium transients, because these often represent the first step in the transduction of electrical signals into various forms of neural plasticity and development.
Neurological processes have important biochemical components in addition to the electrical components of signaling. Traditionally, the chemical environment in brain slice experiments is controlled only by bath perfusion, which limits the experimental conditions to homogeneous physiochemical environments. Focal stimulation has been achieved by using glass micropipettes to puff small quantities of factors in or on the tissue. The micropipette stimulation approach has many of the same drawbacks as pipette recording. An additional limitation of micropipettes is the difficulty of applying complex sequences of factors. The only way to apply multiple factors with a single-barrel pipette is to load the pipette sequentially with the solutions of interest prior to the experiment. The temporal resolution of the sequential loading technique is fundamentally limited by the diffusion and mixing of factors within the pipette. Multi-barrel pipettes can be utilized to deliver multiple factors with spatiotemporal precision, however they are bulky, can induce substantial tissue damage, and are difficult to fabricate. In order to overcome the limitations of pipette technology, several microfluidic devices have been developed for focal chemical application on tissue slice preparations. These devices include laminar flow perfusion chambers16,17, devices with fluid ports18,19, and microfluidic probes20. Another approach to focal biochemical manipulation is the use of optogenetic constructs and focal optical stimulation to activate specific biochemical processes with high spatial and temporal resolution21. All of the chemical stimulation methods rely on traditional electrophysiology measurements with pipettes or MEAs17,16,22 or microscopy with indicator dyes23 to detect changes elicited by the stimulus. Microfluidic devices such as patch clamp chips have been successfully developed and used for simultaneous electrophysiological and chemical characterization and manipulation of dissociated cells24–26, however this approach has not yet been applied to organotype tissue samples.
Combining high quality imaging with the ability to control and measure the electrical and chemical environment of brain slice preparations with high spatial and temporal resolution enables experiments that will help us understand the complex electrochemical processes underlying neural function27. We present a transparent microfluidic MEA (MMEA) that is compatible with high-resolution fluorescence microscopy and that combines multi-site electrical recording and multi-site focal chemical stimulation. We use this device to study spontaneous waves of activity (SWA) in developing mouse cortex.
Experimental
Device fabrication
Microfluidic multi-electrode-array devices were fabricated using photolithographic patterning and poly-dimethylsiloxane (PDMS) molding techniques. Masks were designed using AutoCAD version 2010 educational edition (http://usa.autodesk.com/autocad/) software and printed on transparencies with a high-resolution laser printer by Fineline Imaging (http://www.fineline-imaging.com/). The nominal resolution for all photomasks was 40,000 dpi and the minimum feature size was 20 μm.
Masters were fabricated using photolithography. Silicon wafers were spin-coated with SU8 2075 (Microchem) epoxy resin photoresist using a headway spinner at speeds of 2000 and 3000 for the channel and aperture layers, respectively. This results in nominal film thicknesses of 110 and 80 μm. The wafers were softbaked on a hotplate at 95 °C for four hours. The patterns were aligned and exposed using a mask aligner at energies of 240 and 215 mJ/cm2 for the channel and aperture layers. The wafers were then post exposure-baked on a hotplate at 95 °C. The patterns were developed using Baker BTS220 edge bead remover. The masters were hard baked at 200 °C for 2 hours to fully cure the photoresist. Trichloro perfluorooctosilane (Aldrich) was applied by vacuum desiccation for one hour to facilitate the removal of the PDMS after molding.
PDMS (Dow Corning, Sylgard 184 kit) was mixed in a 10:1 ratio. The uncured PDMS was then degassed in a desiccator. PDMS was spin-coated on the fluidic channel layer at a speed of 500 RPM to form a 200 μm-thick layer. The aperture layer was exclusion molded. The chamber layer was fabricated by manually cutting/punching features in a thick (approximately 3mm) slab of PDMS. All PDMS layers were cured in an oven at 70°C for at least four hours.
The fully cured PDMS layers were bonded together using plasma bonding. PDMS and glass surfaces were plasma treated at a power of 10 mW in 75 mTorr oxygen for 20 seconds using a Diener Zepto (http://www.plasma.de/en/plasmasystems/zepto.html). First the fluidic channel layer was bonded to a glass coverslip. The aperture layer was then aligned and bonded, followed by the chamber layer.
Polyethylene terapthelate (PET) microporous membrane were bonded to some of the completed device using aminopropyltriethoxysilane (APTES) treatment28. The PET membrane was plasma treated at 60 mW in 670 mTorr oxygen for 60 seconds and then soaked in 2% APTES in methanol with 5% water for 30 minutes. The membranes were then thoroughly rinsed in DI water. APTES treated membranes readily bond to freshly plasma treated PDMS.
Animals
All animal procedures were approved by the Institutional Animal Care and Use Committee of the University of Washington, and were performed in accordance with guidelines of the National Institutes of Health and the Association for Assessment and Accreditation of Laboratory Animal Care (AAALAC). Swiss Webster mice obtained from Harlan (Indianapolis, IN, USA) and time-mated. Pregnant females were euthanized on gestational day 17 by trained personnel using CO2 inhalation followed by cervical dislocation. Individual mice were placed in a sanitized euthanasia chamber which was then filled with 100% carbon dioxide from a 20psi source. Animals were kept in the charged chamber for a minimum of 5 min plus 1 minute beyond apparent clinical death. Fetuses were removed from the uteri, decapitated and brains were placed into ice-cold artificial cerebral spinal fluid (ACSF; see below) equilibrated with carbogen gas (95% O2 - 5% CO2).
Solutions
Cell culture medium contained 75% sterile Neurobasal-A Medium (1X) (Invitrogen), 25% horse serum (Sigma-Aldrich), Penicillin (100 IU ml−1), streptomycin (0.1 mg ml−1) and 2 mM L-glutamine (Sigma-Aldrich). Artificial cerebral spinal fluid (ACSF) contained (mM): 140 NaCl, 3 KCl, 2 MgCl2, 2 CaCl2, 1.25 NaHPO4, 26.5 NaHCO3 and 20 D-glucose.
Tissue preparation
Brains were mounted in the holder of a Leica VT1200 S semiautomatic vibrating blade microtome. Brains were sliced into 300 μm coronal slices from an area anterior to the hippocampus, but within the extent of the lateral ventricles (corresponding to gestational day 18 coronal)29. These sections include cortex, corpus callosum, septal nuclei, and basal ganglia structures (caudate-putamen and globus pallidus). Slices were then placed on Millicell sterilized culture inserts in culture medium and cultured in a water-jacketed incubator at 36-37°C in 5% CO2 for 2 to 5 days. Previous experiments have shown that cultured slices reproduce the time course of several physiological properties of cortical neurons (voltage-gated sodium and potassium currents, capacitance, resting conductance), the onset and disappearance of spontaneous waves30.
Prior to measurement, slices were removed from the incubator and held in warmed, oxygenated ACSF for 1-2 hours. Slices were then immersed in oxygenated ACSF containing the [Ca2+]i-indicating dye Fluo-4 (1.25 μM, Invitrogen) and 0.07% Pluronic F-127 (Sigma-Aldrich) for 30–45 min, rinsed and placed into the recording chamber.
Electrical recording and stimulation
Electrical recordings were performed using AM Systems differential ac amplifiers (model 1700) connected to an Axon digidata 1440A digitizer/data acquisition system. The digitizer is interfaced with a computer and controlled using pClamp 10. Electrical traces were recorded at a sampling rate of 10 kHz with an amplification of 10,000. The amplifier notch filter cutoffs were set to 10 Hz and 5 kHz for the lowpass and highpass portions, respectively. All traces are shown as-recorded with no post-measurement filtering or processing. Electrical stimulation was performed using an AM Systems Model 2100 Isolated Pulse Stimulator connected to the ac amplifiers. All stimuli were biphasic single pulses.
Microscopy
Images were captured at on a CoolSnap ES / QuantEM512SC camera (Photometrics, Tucson, AZ, USA) attached to a Nikon AZ100 microscope and a Hamamatsu ImageEM Enhanced high dynamic range EM-CCD or Orca-flash2.8 CMOS camera attached to an Olympus DSU spinning disk confocal microscope. Images were recorded using either NIS Elements AR software (Nikon USA, Melville, NY, USA) or MetaMorph Premier Software (7.7) (Molecular Devices, Sunnyvale, CA, USA).
Data processing
We plotted and analyzed traces using custom MatLab scripts based on the SigTOOL open source electrophysiology platform31. Scripts were written using MatLab to process images. All time lapse data was processed by baseline correction, Δf/f calculation, thresholding, pseudocoloring, and overlaying the images.
In all cases, the overall fluorescence intensity decreased during the experiment due to photobleaching of the fluo-4 indicator dye. In the low-magnification images, there were also fluctuations in illumination intensity. The bleaching was corrected by taking the mean intensity of the image or portion of the image containing tissue and plotting the fluorescence intensity as a function of time. Cursors were used to manually select regions containing synchronous activity to exclude those regions from the curve fitting. The data was fitted with a single exponential. Each image in the stack was multiplied by a correction factor resulting in a series of background-corrected images with a uniform level of baseline fluorescence intensity.
The initial three to five frames of the timelapse series were inspected to make sure that no significant spontaneous activity was occurring, and then the mean value of the images was calculated to form a base image. Changes in fluorescence intensity relative to the base image intensity were calculated, resulting in a series of images showing percentage change in fluorescence intensity over baseline as a function of time.
In order to visualize activity, the Δf/f images were thresholded, pseudocolored, and overlaid on the baseline-corrected fluorescence images. A threshold in Δf/f is applied and the portions of the image that fall below the threshold are shown as the raw fluorescence signal in greyscale. Portions of the image that fall above the threshold are shown as Δf/f using a rainbow colormap.
Results and Discussion
Microfluidic chip and interface design
We designed a microfluidic chip for simultaneous electrical recording, focal chemical stimulation, and optical characterization of tissue slice preparations. The device consists of an array of microfluidic channels and a perfusion chamber, as shown in Figure 1. Each of the channels has a well at one end, an aperture that contacts the perfusion chamber in the middle, and a port to connect with the pressure and electronic controls at the other end. Each aperture may be used either as an electrical recording site, or as a pore for delivering focal chemical stimulation. The microfluidic device is mounted in a plexiglass holder that renders it compatible with standard microscope stage inserts for 75×50 mm slides.
Fig. 1.
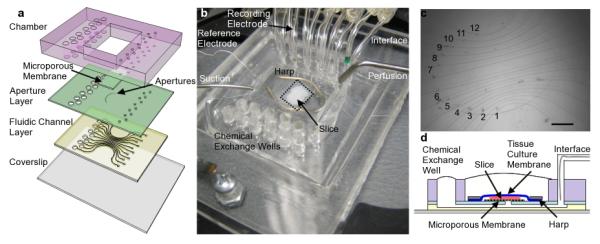
(a) Schematic of MMEA device showing the different layers. The microporous membrane is not necessary for the electrical functioning of the device, but it is necessary for focal chemical application. (b) Photograph of MMEA during operation. The dotted line indicates the region shown in the optical micrograph in (c). The scalebar in (c) is 500 Î1/4m. The oval is the approximate dimension of a typical slice and the tissue is placed on apertures 1-6 in the ventral region and apertures 7-12 in the dorsal aspect of one hemisphere. (d) shows a cross section of the device during operation. The slice sits on the microporous membrane and is only contacted by the solution in the microchannel where the aperture is present.
The geometry of the apertures is designed to probe an array of anatomically relevant sites. We are using the chip to study SWA in coronal slices of mouse cortex, therefore the apertures are placed in a semi-oval array corresponding to a spatial sequence of sites on one hemisphere of the cortex in our slice preparations. The apertures are 20 or 50 μm in diameter and have a spacing of 300 μm. The relatively large aperture size and spacing were chosen because they are appropriate for the anatomical features in our particular study. Work is ongoing to develop different geometric configurations with higher aperture density for other studies.
When delivering factors using the microfluidic channels, it is important that the fluidic resistance of the aperture is large compared with the channel fluidic resistance to ensure that the flow is restricted to the channel. Considerable fluid flow through the recording/stimulation aperture would cause the position of the tissue to shift and would potentially damage the slice. A transparent track-etched PET membrane (AR Brown) with 1μm pores is bonded to over the PDMS to increase the fluidic resistance of the apertures by reducing their effective cross sectional area.
The electronic and fluidic controls are contained in a simple plug-and-play interface. The user simply fills the interface tubing with ACSF using a syringe, plugs the glass interface tubes into ports in the microfluidic device, and applies pressure using the syringe to fill the microfluidic channels. Ag/AgCl electrodes are integrated in the interface and wired to BNC electrical connectors that can be attached to an external amplifier using standard coaxial cables. The electrodes extend as far as possible within the interface towards the aperture in order to minimize the signal path length.
Electrical recording
During device operation, a slice of tissue is placed over the aperture array, manually positioned, and held down using a harp as is done in standard brain slice experiments. The slice is continuously superfused with warm (31° C) ACSF bubbled with a 95% O2/5% CO2 mixture. Extracellular signals are recorded using differential amplifiers.
We measured spontaneous activity in developing mouse cortex using the microfluidic MEA chip. SWA can take the form of local or propagating waves with stereotyped propagation characteristics. Local and propagating activity can be clearly measured, as shown in Figure 2a. Typically, the waves originate in a pacemaker region in the ventral aspect of the cortex and propagate towards the dorsal aspect. Local waves stop near the rhinal fissure and propagating waves continue to the midline2. Sometimes a wave initiated in the hemisphere contralateral to the recording array will cross the midline and continue propagating in the reverse (dorsal – ventral) direction across the recording array (Fig. 2b). All of these stereotyped wave propagation patterns are clearly discernable by observing the sequence of activity detected by the recording apertures.
Fig. 2.
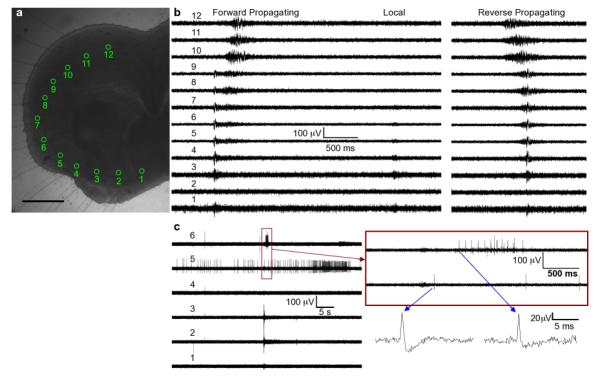
Examples of neural activity recorded using the MMEA with a cortical slice positioned as shown in (a). The scalebar is 500 Î1/4m. (b) shows local field potential-type signals associated with forward propagating, local and reverse propagating SWA. (c) shows examples of single-unit activity from a different experiment. The neuron detected with aperture 5 is spiking asynchronously from the SWA. The burst from the neuron in aperture 6 occurs within a few hundred milliseconds of the SWA, suggesting that this particular neuron could be responding to inputs associated with the SWA. Plots of individual spikes show the characteristic biphasic waveform associated with action potentials.
Single neuron action potentials can also clearly be resolved using the chip, as shown in Figure 2c. The first set of traces at low temporal resolution shows asynchronous spiking in channel 5 and SWA signals in the other channels. Looking at channel 6 at higher temporal resolution, a burst of single spikes that occurs just after the SSA is clearly visible. In this way, recordings from the chip can distinguish individual neurons that do, or do not, participate in spontaneous waves.
The MMEA device presented here is versatile and easy to operate. Tissue is introduced into the device just prior to measurement and the device is top-loadable (i.e. the slice is loaded into a well), therefore it is not necessary to modify any tissue preparation or slice culture protocols. The devices are packaged to fit in standard microscope stages. The devices are reusable and can be cleaned by flushing the microfluidic channels with ethanol. We have used a device to record from more than ten slices (with each recording session lasting multiple hours) with no apparent degradation in performance.
Once a cortical slice is placed on the chip, the measurement is very stable. The MMEA uses electrochemically stable Ag/AgCl electrodes, therefore artifacts such as voltage drift that can occur with polarizable metal electrodes are not a concern. Unlike separately mounted glass pipets, our system has excellent mechanical stability because the apertures are integrated with the perfusion chamber. We routinely record from slices for periods of more than 8 hours with no degradation in electrical signal or apparent changes in activity. The fluid in the microfluidic channels is static during the measurement, however a pulse of flow can be introduced at any time during the experiment to flush out bubbles in the channels in the uncommon event that they occur.
The specific electrical signal that is measured in a given recording aperture at any time is a weighted sum of the signals from individual neurons in the proximity of the aperture opening. We took measurements using devices with 20 and 50 μm apertures with and without the microporous membrane. In general, the larger aperture size yields higher local field potentail (LFP) signal strength, as one would expect given the larger number of cells that are being interrogated. The microporous membrane effectively reduces the size of the recording aperture to an array of 1 μm apertures randomly distributed over the area defined by the PDMS aperture. For the porosity of our membranes, the apertures contain approximately 5 and 30 pores for the 20 and 50 μm openings, respectively. With the porous membrane, we observe that the LFP signal strength is much lower than for the open apertures and we obtain a larger proportion of measurements with single unit signals. In order to measure clear single unit signals, one neuron must be coupled to the recording aperture much more strongly than the surrounding cells. Collectively, these observations indicate that the measurements are strongly dependent on the cells in the immediate vicinity of the aperture opening and that the aperture and membrane geometry can be tuned to increase the probability of obtaining single-cell or ensemble measurements.
Optical Microscopy
Brightfield and fluorescence microscopy using transmission, inverted, and confocal microscopes was performed during electrical recording (see methods for details). The only materials in the optical path other than the sample are PDMS, glass, and the electrolyte. The exceptional optical clarity and optical index matching of these materials renders the devices highly microscopy-compatible. Fluorescence images of the calcium signal of a hemisphere of a Fluo4-loaded slice and simultaneous electrical traces are shown in Figure 3a,b (supplemental Video 1). The electrical signal associated with the wave is less than one second in duration, whereas fluorescence signal associated with the elevated extracellular calcium is clearly resolved more than 10 seconds later (Fig. 3c). Higher magnification calcium images show that cellular and subcellular features are easily resolved through the chip (Fig. 3d, supplemental Video 2).
Fig. 3.
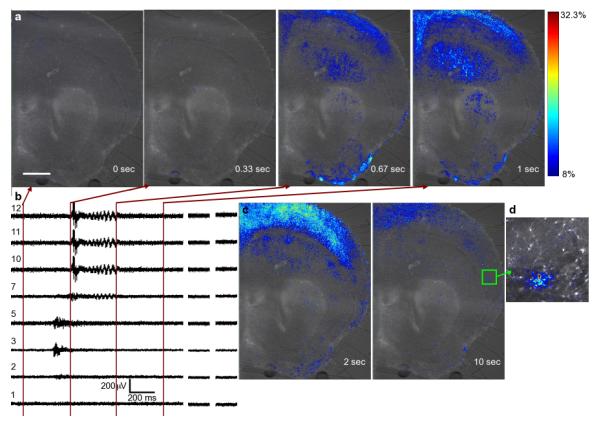
Pseudo-colored micrographs(a) and simultaneous electrical recordings of a propagating wave. The lines on the strip in (b) chart correspond to the frame acquisition times of (a). The additional images in (c) show the long persistence time of the calcium signal after the electrical activity has passed. (d) shows local activity in a higher magnification image between SWA events demonstrating that cellular and subcellular features are clearly resolved. The scalebar in (a) is 500 Î1/4m and applies to all images in (a) and (c). The colorbar in (a) applies to all images in (a), (c), and (d). (Supplement: Video 1 and Video 2)
Electrical stimulation
Electrical stimuli can be applied using the device by connecting one or more channels of the interface to a signal generator rather than an amplifier. The remaining channels can be used simultaneously for electrical recording. In the experiment shown in Fig. 4, a spontaneous wave was recorded (Fig. 4b), and the site of initiation of the wave noted (Site 4; Fig. 4a,b). Next, a stimulus was delivered to Site 4, and a propagating wave was initiated (Fig. 4b, right panel). The propagation characteristics and waveforms of the stimulated wave was remarkably similar to the spontaneous wave. Lower amplitude and shorter time electrical stimuli were insufficient to initiate waves, but they did result in local response of the neuronal circuits in the vicinity of the stimulation aperture, as shown in Figure 4c (supplemental Video 3). The influence of electrical stimuli on activity is complex and the response depends on the developmental stage of the tissue and anatomical position of the stimulus as well as the strength and waveform of the stimulus signal. A systematic study of stimulation parameters is ongoing.
Fig. 4.
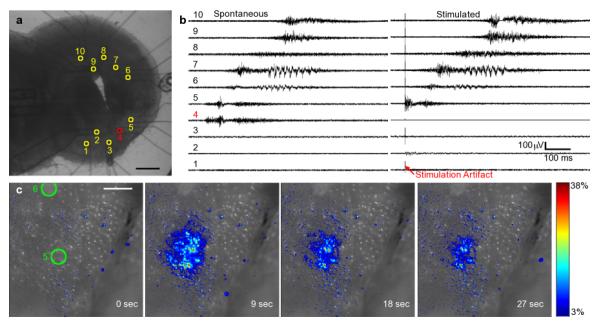
Local and propagating activity can be induced by electrical stimulation using the device. A brightfield optical micrograph of a slice on the ten-channel device is shown in (a) with the positions of the apertures indicated. (b) shows electrical traces of spontaneous and stimulated waves recorded from the slice shown in (a). The stimulated waves are induced with a 10 mA, 10 ms electrical pulse. The electrical signature of the induced waves is similar to spontaneous waves recorded in the slice prior to electrical stimulation. Local activity can be induced by low amplitude electrical stimulation, as shown in the pseudo-colored series of fluorescence micrographs in (c). This example shows the calcium response of a slice loaded with Fluo-4 to a 10 ms, 500 Î1/4A pulse. The colorbar indicates percent change in fluorescence intensity for all frames in (c). The scalebars are 500 Î1/4m and 100 Î1/4m in (a) and (c), respectively. (Supplement: Video 3)
Chemical stimulation
During device operation, the microfluidic channels and chemical exchange wells are filled with recording electrolyte, in this case ACSF. In order to apply a specific chemical stimulus, the ACSF is removed from the chemical exchange well and the factor of interest is introduced using a micropipette. Suction is then applied to the syringe attached to the interface to move the solution from the chemical exchange well to the channel beneath the tissue. The suction is released and the factor is allowed to diffuse through the porous membrane to the tissue above. Any arbitrary sequence of soluble factors can be applied by repeating this process. In our experiments, a syringe was used to manually apply suction, limiting the temporal resolution of our chemical stimuli to a few seconds, however the chip can be combined with more sophisticated valves and pumps to provide high temporal control.
In order to visualize focal chemical delivery, Calcein-AM dye (CellTrace Calcein Green AM, Molecular Probes) was applied using the device (Fig. 5, supplemental video 4). AM dye is non-fluorescent and hydrolyzes only after being taken up by live cells. The time that it takes for the stimulus to become visible depends both on the delivery of the dye to the site and time that it takes for the dye to become hydrolyzed. In our case, the dyes diffuses a very short distance so the delivery of dye is expected to happen on the order of seconds, whereas the cleavage of the acetoxymethyl ester groups happens on the order of minutes. The electrical functionality of the device is retained during focal chemical stimulation, as shown by the traces taken during dye application (Fig. 5c). The suction pulse does briefly interfere with recording. The signal to noise ratio of the recording is increased because the smaller aperture size and presence of the microporous membrane decrease the effective recording area. This data is of sufficient quality that activity can clearly be seen in the unfiltered traces and straightforward signal processing techniques can be used to further analyze the waveforms if desired. The dye is present only very locally, as seen in Figure 5d. Cells that touch the apertures and those with processes extending towards the aperture are stained, whereas surrounding areas are not, even after more than one hour of continuous dye application.
Fig. 5.
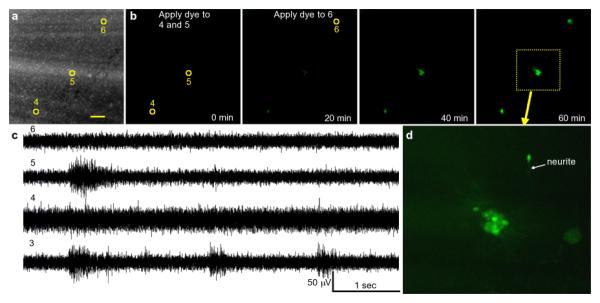
Focal chemical application was visualized using Calcein-AM dye. (a) shows a fluorescence micrograph of the device with the stimulation apertures indicated. The scalebar is 100 Î1/4m. The time series in (b) shows the fluorescence signal as the dye is applied through the apertures. The presence of dye in the aperture locations and absence in the rest of the slice clearly shows the ability of the device to apply chemical stimuli focally. Electrical traces of spontaneous activity recorded during the dye application shown in (c) demonstrate that the electrical functionality of the device is retained during focal chemical stimulation. The endpoint closeup of aperture 5 in (d) shows that cells immediately adjacent to the aperture and with processes extending to the aperture are stained, whereas cells farther away are not. (Supplement: Video 4)
We applied a high potassium (high-K) solution as an example of a stimulus that elicits an electrical response from the tissue (Fig. 6). ACSF with 100 mM and 300 mM KCl concentrations both induced depolarization of the cells in the vicinity of the stimulation aperture, as indicated by elevation of intracellular Ca (Fig. 6b). The high-K stimulus also excites a subset of the surrounding cells, either due to normal synaptic circuitry or by diffusion of potassium ions from the stimulation aperture to the surrounding tissue. When the stimulus is removed by flushing the microfluidic channel with normal ion concentration ACSF, the cells local to the aperture largely return to their resting calcium levels within a few minutes (Fig. 6d). We applied multiple high-K/normal ACSF cycles to verify that a repeatable response can be elicited.
Fig. 6.
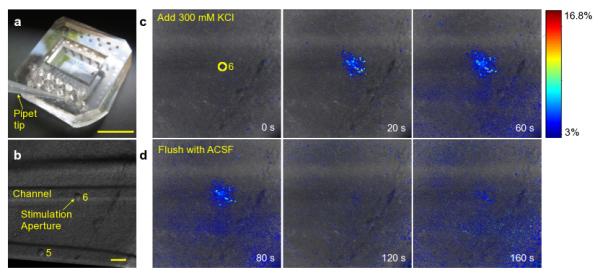
A high-potassium stimulus was focally applied to a Fluo4-loaded slice using the device. The photograph in (a) shows how a standard micropipette tip can be used to easily load stimuli into the chemical exchange wells of the device. The brightfield optical micrograph in (b) shows the position of the microfluidic channels and apertures. The high-potassium stimulus induces local depolarization and increases excitability of cells in the vicinity of the stimulation aperture within seconds, as seen in the series of pseudo-colored fluorescence micrographs in (c). The depolarization can be reversed, as seen from the time series of micrographs in (d) after flushing the channel with standard ion concentration ACSF. The colorbar indicates percent change in fluorescence intensity and is applicable to all images in (c) and (d). The scalebars are 1 cm and 100 Î1/4m in (a) and (b), respectively. (Supplement: Video 5)
The entire slice can be stimulated by changing factors in the perfusion as well as using the stimulation apertures. It has been shown that the spontaneous activity is dependent upon glutamatergic and GABAergic neurotransmission. Thus we simultaneously applied the glutamate AMPA receptor antagonist CNQX (25μM) and GABAA receptor antagonist picrotoxin (10μM by bath perfusion to verify the pharmacological behavior of the slices when used with the recording device. Spontaneous activity, as recorded electrically and optically, was completely eliminated by the application of the drug cocktail. Washing out the sample with ACSF caused the spontaneous activity to return.
There are a number of approaches to applying focal chemical stimuli to tissue such as capillary micropipettes, microfluidic probes20, laminar flow chambers17, and microfluidic devices with stimulation apertures18,19. In all of these methods, the factors are delivered using a significant amount of fluid flow. The presence of flow can cause local tissue damage, response of the cells to the local shear forces, and instability in the geometry. Our device delivers factors diffusively through a microporous membrane. The flow is confined to the microfluidic channel because the fluidic resistance of the channel is much less than that through the membrane. Our device design allows arbitrary sequences of factors to be applied through the apertures by simply pipetting solutions in and out of the exchange wells and applying suction to the interface. It is also possible to simultaneously bath deliver factors with the external perfusion, enabling the study of combinatorial effects where one or more factors are applied locally and others are applied to the entire slice.
Conclusion
We present a microfluidic MEA for multi-mode measurement and stimulation of brain slices. We demonstrate that the device is useful for controlling the slice electrical and chemical microenvironment with high spatial and temporal resolution. The exceptional optical properties of the MEA materials make it possible to combine these measurements with high quality imaging.
Supplementary Material
Acknowledgements
The authors acknowledge Chris Sip and Tim Chang for enlightening discussions. Samantha Moen and Matthew Becker prepared cultured brain slices. Wai Pang Chan provided technical assistance with microscopy. Support for this work was provided by the National Institute of Health / National Institute of Biomedical Imaging and Bioengineering (Grant # R01 EB007526-01).
Footnotes
† Electronic Supplementary Information (ESI) available: videos showing simultaneous electrical recording and calcium imaging, single-cell resolution calcium imaging, visualization of calcium response to electrical stimulus, focal dye application to tissue, and calcium response of tissue to focal high -potassium stimulus.
References
- 1.Moody WJ. Physiological Reviews. 2005;85:883–941. doi: 10.1152/physrev.00017.2004. [DOI] [PubMed] [Google Scholar]
- 2.Conhaim J, Cedarbaum ER, Barahimi M, Moore JG, Becker MI, Gleiss H, Kohl C, Moody WJ. Developmental Neurobiology. 2010;70:679–692. doi: 10.1002/dneu.20797. [DOI] [PubMed] [Google Scholar]
- 3.Lischalk JW, Easton CR, Moody WJ. Developmental Neurobiology. 2009;69:407–414. doi: 10.1002/dneu.20708. [DOI] [PubMed] [Google Scholar]
- 4.McCabe AK, Easton CR, Lischalk JW, Moody WJ. Developmental Neurobiology. 2007;67:1574–1588. doi: 10.1002/dneu.20533. [DOI] [PubMed] [Google Scholar]
- 5.Deuschl G, Schade-Brittinger C, Krack P, Volkmann J, Schäfer H, Bötzel K, Daniels C, Deutschländer A, Dillmann U, Eisner W. New England Journal of Medicine. 2006;355:896–908. doi: 10.1056/NEJMoa060281. others. [DOI] [PubMed] [Google Scholar]
- 6.Kleiner-Fisman G, Herzog J, Fisman DN, Tamma F, Lyons KE, Pahwa R, Lang AE, Deuschl G. Movement Disorders. 2006;21:S290–S304. doi: 10.1002/mds.20962. [DOI] [PubMed] [Google Scholar]
- 7.McIntyre CC, Savasta M, Kerkerian-Le Goff L, Vitek JL. Clinical neurophysiology. 2004;115:1239–1248. doi: 10.1016/j.clinph.2003.12.024. [DOI] [PubMed] [Google Scholar]
- 8.Lebedev MA, Nicolelis MAL. TRENDS in Neurosciences. 2006;29:536–546. doi: 10.1016/j.tins.2006.07.004. [DOI] [PubMed] [Google Scholar]
- 9.Wise KD, Sodagar AM, Yao Ying, Gulari MN, Perlin GE, Najafi K. Proceedings of the IEEE. 2008;96:1184–1202. [Google Scholar]
- 10.Hatsopoulos NG, Donoghue JP. Annual review of neuroscience. 2009;32:249. doi: 10.1146/annurev.neuro.051508.135241. [DOI] [PMC free article] [PubMed] [Google Scholar]
- 11.Kita JM, Wightman RM. Current Opinion in Chemical Biology. 2008;12:491–496. doi: 10.1016/j.cbpa.2008.06.035. [DOI] [PMC free article] [PubMed] [Google Scholar]
- 12.Zhao Y, Inayat S, Dikin DA, Singer JH, Ruoff RS, Troy JB. Proceedings of the Institution of Mechanical Engineers, Part N: Journal of Nanoengineering and Nanosystems. 2008;222:1–11. [Google Scholar]
- 13.Cogan SF. Annu. Rev. Biomed. Eng. 2008;10:275–309. doi: 10.1146/annurev.bioeng.10.061807.160518. [DOI] [PubMed] [Google Scholar]
- 14.Fejtl M, Stett A, Nisch W, Boven KH, Möller A. Advances in Network Electrophysiology. 2006:24–37. [Google Scholar]
- 15.Kim D-H, Ghaffari R, Lu N, Rogers JA. Annual Review of Biomedical Engineering. 2012;14:113–128. doi: 10.1146/annurev-bioeng-071811-150018. [DOI] [PubMed] [Google Scholar]
- 16.Blake AJ, Rodgers FC, Bassuener A, Hippensteel JA, Pearce TM, Pearce TR, Zarnowska ED, Pearce RA, Williams JC. Journal of neuroscience methods. 2010;189:5–13. doi: 10.1016/j.jneumeth.2010.02.017. [DOI] [PMC free article] [PubMed] [Google Scholar]
- 17.Blake AJ, Pearce TM, Rao NS, Johnson SM, Williams JC. Lab on a Chip. 2007;7:842. doi: 10.1039/b704754a. [DOI] [PMC free article] [PubMed] [Google Scholar]
- 18.Mohammed JS, Caicedo HH, Fall CP, Eddington DT. Lab on a Chip. 2008;8:1048. doi: 10.1039/b802037j. [DOI] [PubMed] [Google Scholar]
- 19.Tang YT, Kim J, López-Valdés HE, Brennan KC, Ju YS. Lab on a Chip. 2011;11:2247. doi: 10.1039/c1lc20197b. [DOI] [PMC free article] [PubMed] [Google Scholar]
- 20.Queval A, Ghattamaneni NR, Perrault CM, Gill R, Mirzaei M, McKinney RA, Juncker D. Lab on a Chip. 2010;10:326. doi: 10.1039/b916669f. [DOI] [PubMed] [Google Scholar]
- 21.Mattis J, Tye KM, Ferenczi EA, Ramakrishnan C, O’Shea DJ, Prakash R, Gunaydin LA, Hyun M, Fenno LE, Gradinaru V, Yizhar O, Deisseroth K. Nature Methods. 2011;9:159–172. doi: 10.1038/nmeth.1808. [DOI] [PMC free article] [PubMed] [Google Scholar]
- 22.Anikeeva P, Andalman AS, Witten I, Warden M, Goshen I, Grosenick L, Gunaydin LA, Frank LM, Deisseroth K. Nature Neuroscience. 2011;15:163–170. doi: 10.1038/nn.2992. [DOI] [PMC free article] [PubMed] [Google Scholar]
- 23.Tang Y, López-Valdés H, Brennan K, Ju Y. 15th International Conference on Miniaturized Systems for Chemistry and Life Sciences; Seattle, WA. 2011. [Google Scholar]
- 24.Klemic KG, Klemic JF, Sigworth FJ. Pflügers Archiv - European Journal of Physiology. 2004;449:564–572. doi: 10.1007/s00424-004-1360-8. [DOI] [PubMed] [Google Scholar]
- 25.Chen C, Folch A. Lab on a Chip. 2006;6:1338. doi: 10.1039/b607913j. [DOI] [PubMed] [Google Scholar]
- 26.Lau AY, Hung PJ, Wu AR, Lee LP. Lab on a Chip. 2006;6:1510. doi: 10.1039/b608439g. [DOI] [PubMed] [Google Scholar]
- 27.Huang Y, Williams J, Johnson SM. Lab on a Chip. 2012 doi: 10.1039/c2lc21142d. [DOI] [PubMed] [Google Scholar]
- 28.Sunkara V, Park D-K, Hwang H, Chantiwas R, Soper SA, Cho Y-K. Lab on a Chip. 2011;11:962. doi: 10.1039/c0lc00272k. [DOI] [PubMed] [Google Scholar]
- 29.Schambra UB, Lauder JM, Silver J. The Atlas of the Prenatal Mouse Brain. Academic Press; San Diego, CA USA: 1992. [DOI] [PubMed] [Google Scholar]
- 30.McCabe AK, Chisholm SL, Picken-Bahrey HL, Moody WJ. The Journal of physiology. 2006;577:155–167. doi: 10.1113/jphysiol.2006.117523. [DOI] [PMC free article] [PubMed] [Google Scholar]
- 31.Lidierth M. Journal of neuroscience methods. 2009;178:188–196. doi: 10.1016/j.jneumeth.2008.11.004. [DOI] [PubMed] [Google Scholar]
Associated Data
This section collects any data citations, data availability statements, or supplementary materials included in this article.