

Abstract
The vision of using a single therapeutic agent with sufficient generality to allow application to a wide variety of diseases, yet specific enough to permit intervention at single molecular stages of the pathology, is rapidly becoming a reality through the emergence of RNA interference. RNA interference can be used to inhibit the expression of virtually any gene and, at the same time, has single-nucleotide specificity. Major challenges in applying RNA interference in vivo are adequate delivery of the siRNA molecule to the tissue of interest and methods of monitoring this delivery in a noninvasive manner. With this in mind, we have developed an approach not only to deliver siRNA to tumors, but also to track the success of the delivery by noninvasive imaging. To accomplish this, we designed a dual-function probe, MN-NIRF-siRNA, which consists of magnetic nanoparticles (MN) for magnetic resonance imaging (MRI), labeled with Cy5.5 dye for near-infrared in vivo optical imaging (NIRF), conjugated to myristoylated polyarginine peptides (MPAPs) for translocation of the complex into the cytosol, and carrying siRNA targeting tumor-specific genes. Administration of MN-NIRF-siRNA to tumor-bearing mice allowed us to monitor the delivery of the agent to tumors by MRI and NIRF imaging and resulted in efficient silencing of the target genes. This approach can significantly advance the therapeutic potential of RNA interference by providing a way not only to effectively shuttle siRNA to target sites but also to noninvasively assess the bioavailability of the siRNA molecule.
Keywords: RNA interference, magnetic resonance imaging, near-infrared optical imaging, magnetic nanoparticles, myristoylated polyarginine
1. Introduction
RNA interference is an innate cellular mechanism for post-transcriptional regulation of gene expression in which double-stranded ribonucleic acid inhibits the expression of genes with complementary nucleotide sequences. Its potential for tumor therapy is indisputable, considering that one can use this mechanism to silence virtually any gene, including genes implicated in tumorigenesis, with single-nucleotide specificity (1). Major obstacles in applying RNA interference in vivo are presented by the short circulation half-life of the siRNA molecule, its vulnerability to degradation by nucleases (elimination half-life 2–6 min (2, 3)), and the need to translocate the siRNA into the cytosol, where the RNA interference process takes place. Various approaches have been explored to overcome these obstacles. These include, but are not limited to, chemical modification, conjugation, and/or complexing of the siRNA (2–6).
An essential element in the development and optimization of an siRNA delivery method is the ability to measure the bioavailability and functionality of the siRNA molecule after administration into the body. Noninvasive imaging provides the necessary set of tools to accomplish this in authentic physiologic environments and across time. The recent past has witnessed several reports describing the coupling of siRNA to contrast agents that can be used for noninvasive imaging (4, 6–12).
Here, we describe the methodology behind the development and testing of a dual-purpose nanoparticle platform (MN-NIRF-siRNA) for the concurrent delivery of siRNA to tumors and assessment of the delivery by magnetic resonance imaging (MRI) and near-infrared optical imaging (NIRF). MN-NIRF-siRNA consists of a magnetic nanoparticle (MN) core, as an MRI contrast agent, labeled with Cy5.5 dye, for near-infrared in vivo optical imaging (NIRF), and conjugated to myristoylated polyarginine peptides (MPAPs) for cytosolic delivery. This complex is conjugated to an siRNA targeting model (e.g., gfp) or therapeutic (e.g., birc5) tumor-specific genes of interest. The described approach involves three major steps: (1) synthesis of the MN-NIRF-siRNA complex, (2) noninvasive imaging by MRI and NIRF imaging to assess the delivery of MN-NIRF-siRNA after in vivo administration, and (3) assessment of the silencing efficacy of MN-NIRF-siRNA.
2. Materials
2.1. Synthesis and Testing of MN-NIRF-siRNA
Dextran T10 (Pharmacosmos, Holbaek, Denmark).
FeCl3•6H2O.
FeCl2.
NH4OH.
5 M NaOH.
Epichlorohydrin.
30% NH4OH.
Cy5.5 NHS ester, 1 mg (GE Healthcare, Piscataway, NJ).
0.5 M Sodium bicarbonate, pH 9.6.
G-25 Sephadex PD-10 columns (GE Healthcare, Piscat-away, NJ).
20 mM Sodium citrate, 0.15 M NaCl, pH 7, 7.5, 8.
N-Succinimidyl 3-(2-pyridyldithio) propionate, SPDP (Pierce Biotechnology, Rockford, IL).
Myristoylated polyarginine peptides (MPAPs, Myr-Ala-(Arg)7-Cys-CONH2).
50 mM Sodium phosphate, 150 mM sodium chloride, 10 mM EDTA, pH 7.0.
15 mg/mL Dithiothreitol (DTT).
Dimethyl sulfoxide (DMSO).
siRNA custom-modified with a thiol moiety via a hexyl spacer for bioconjugation (Ambion, Inc., Austin, TX).
3% Tris-(2-carboxyethyl)phosphine hydrochloride (TCEP) (Sigma, St. Louis, MO).
3-Maleimidobenzoic acid N-hydroxysuccinimide ester (MBS) (Sigma, St. Louis, MO).
Quick Spin Column G-50 Sephadex column (Roche Applied Science, Indianapolis, IN).
QuixStand benchtop filtration system with a 0.1-μm cartridge and a 100-kDa cartridge (GE Healthcare, Piscat-away, NJ).
Bruker MQ20 Minispec NMR spectrometer (Bruker Biospin Co., Billerica, MA).
Sub-micron particle size analyzer (Coulter N-4, Hialeah, FL).
Standard tube shaker/rotator.
Standard spectrophotometer.
Standard benchtop centrifuge.
2.2. Imaging the Delivery of MN-NIRF-siRNA to Tumors
Five- to six-week-old female nu/nu mice.
Tuberculin syringes, 1 cc (Becton Dickinson, Franklin Lakes, NJ).
Tumor cell line of interest.
Animal anesthesia system Isotec 4 (Surgivet/Anesco, Waukesha, WI).
9.4 T GE magnet with Bruker Biospin Avance console equipped with ParaVision 3.0.1 software and a 3 × 4 cm elliptical surface coil to transmit and receive (Bruker BioSpin, Billerica, MA).
Whole-body optical imaging system (Imaging Station IS2000MM, Kodak, New Haven, CT), equipped with a band-pass filter at 630 nm and a long-pass filter at 700 nm (Chroma Technology Corporation, Rockingham, VT).
2.3. Assessment of Target Gene Silencing
Animal anesthesia system Isotec 4 (Surgivet/Anesco, Waukesha, WI).
-
Whole-body optical imaging system (Imaging Station IS2000MM, Kodak, New Haven, CT), equipped with the following filters (Chroma Technology Corporation, Rockingham, VT):
for imaging of GFP: excitation, 465 nm; emission, 535 nm.
for imaging of RFP: excitation, 535 nm; emission, 600 nm.
Sodium pentobarbital injected intraperitoneally (200 mg/kg, intraperitoneal) (Sigma, St. Louis, MO).
Standard surgery kit (scissors, forceps) (Roboz Surgical Instrument Co., Inc., Gaithersburg, MD).
3. Methods
The synthesis of MN-NIRF siRNA consists of four distinct steps: synthesis of MN; conjugation of the fluorescent dye Cy5.5 to MN; conjugation of the membrane translocation peptide, MPAP, to MN(Cy5.5); and conjugation of siRNA to MN(Cy5.5)(MPAP). These steps are outlined in Fig. 1.1 and described in Sections 3.1–3.4.
Fig. 1.1.
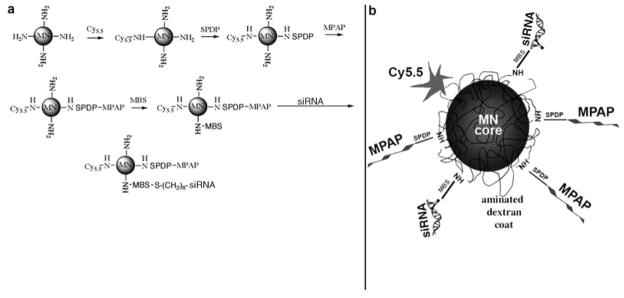
(a) Step-by-step synthesis of the MN-NIRF-siRNA probe, by the sequential conjugation of three different entities onto magnetic nanoparticles. (b) The resultant probe consists of magnetic nanoparticles labeled with near-infrared Cy5.5 dye (NIRF) and linked through two different linkers to membrane translocation peptides (MPAPs) and siRNA molecules. (Reproduced with minor changes from Medarova et al. (6), with permission from Nature Publishing Group).
Since MN-NIRF-siRNA carries both an MRI component (MN) and a near-infrared fluorescent dye (Cy5.5), the delivery of the agent is assessed by both MRI and NIRF imaging (Sections 3.5–3.8).
In proof-of-principle experiments, the target gene may encode a fluorescent protein (GFP, RFP), in which case silencing can be assessed by noninvasive optical imaging or by other routine fluorescence assays, e.g., flow cytometry and fluorescence microscopy. When the target gene does not encode a fluorescent protein, silencing cannot be directly assessed by noninvasive optical imaging. Instead, alternative assays, such as quantitative RT-PCR (qRT-PCR), Western blotting, or immunohistology, can be used. In either case, validation of the silencing effect by qRT-PCR is essential. In Sections 3.9 and 3.10, we are restricting ourselves to a description of noninvasive optical imaging for the assessment of target gene silencing, since the other methods can vary with application and their implementation is routine.
3.1. Synthesis of MN (See Note 1)
The synthesis of dextran-coated MN has been described previously (13).
A desired amount of dextran T10 is dissolved in hot (70°C) water and incubated for 2 h. At the end of the incubation, FeCl3•6H2O is added to the dextran solution and the resultant mixture is cooled down to 2–4°C.
Freshly prepared FeCl2 in H2O is added to the dextran–FeCl3 solution, followed by neutralization with NH4OH.
The resultant suspension is heated to 80°C over 1 h and then incubated at this temperature for 75 min.
The suspension is then passed through the QuixStand filtration system to remove large particles, free dextran, ionic iron, NH4Cl, and NH4OH using first a 0.1-μm cartridge and then a 100-kDa cartridge.
Five volumes of 5 M NaOH and two volumes of epichlorohydrin are added with constant stirring, followed by incubation for 8 h. This is done under a fume hood.
Eight and a half volumes of 30% NH4OH is added followed by an overnight incubation at room temperature with vigorous stirring.
Free epichlorohydrin and NH4OH are removed by ultrafiltration on QuixStand with a 100-kDa cartridge, and six washes with 20 mM sodium citrate, 0.15 M NaCl, pH 8 (8–12 l).
The resulting colloid is tested for free dextran (caramelization), material concentration, particle size by light scattering using a submicrometer particle size analyzer, and magnetic properties by using a Minispec NMR spectrometer.
3.2. Conjugation of Cy5.5-NHS Ester to MN
The pH of MN is adjusted to 9.6 with 0.5 M sodium bicarbonate.
The product (~10 mg Fe) is added to 1 mg of Cy5.5-NHS ester dye, followed by incubation on a rotator overnight at room temperature.
The mixture is purified from nonreacted dye on a Sephadex G-25, PD-10 column equilibrated with 20 mM sodium citrate buffer, 0.15 M NaCl, pH 7.5.
3.3. Conjugation of MPAP to MN-(Cy5.5)
The synthesis of the myristoylated polyarginine membrane translocation module (MPAP) has been described previously (14). MPAP consists of a hydrophobic 14-carbon moiety of myristic acid, in combination with a hepta-arginine peptide. For conjugation of MPAP to MN-(Cy5.5):
MN-(Cy5.5) is conjugated to a heterobifunctional crosslinker N-succinimidyl 3-(2-pyridyldithio) propionate, SPDP, via the N-hydroxy succinimide ester, by co-incubation of an excess of SPDP, dissolved in DMSO, with MN-(Cy5.5) for 15 min at room temperature.
The conjugation is followed by purification using a Sephadex G-25, PD-10 column equilibrated with 20 mM sodium citrate and 0.15 M sodium chloride, pH 8.0.
The delivery module, MPAP (Myr-Ala-(Arg)7-Cys-CONH2), is then coupled to the linker via a sulfhydryl-reactive pyridyl disulfide residue in 20 mM sodium citrate and 0.15 M sodium chloride, pH 8.0 (see Note 2).
The double-labeled MN-(Cy5.5)(MPAP) is then purified by size exclusion chromatography using a Sephadex G-25, PD-10 column using a buffer containing 20 mM sodium citrate and 0.15 M sodium chloride, pH 7.0.
3.4. Conjugation of siRNA to MN-(Cy5.5)(MPAP)
MN-(Cy5.5)(MPAP) is coupled to an excess of MBS crosslinker.
The intermediate is purified using a Sephadex G-25, PD-10 column using a buffer containing 50 mM sodium phosphate, 150 mM sodium chloride, 10 mM EDTA, pH 7.0.
The custom-synthesized siRNA duplex is provided by the manufacturer (Ambion, Austin, TX), modified with a thiol moiety via a hexyl spacer for bioconjugation. Prior to labeling, the disulfide protecting group on 5′-S-S-(CH2)6 is deprotected using 3% tris-(2-carboxyethyl)phosphine hydrochloride (TCEP).
The free thiol-siRNA is then allowed to react with MN-(Cy5.5)(MPAP) via the MBS crosslinker in 50 mM sodium phosphate, 150 mM sodium chloride, 10 mM EDTA, pH 7.0 at 4°C for 1 h.
The product is then purified using a Quick Spin Column G-50 Sephadex column (Roche Applied Science, Indianapolis, IN).
The labeling ratio of Cy5.5 per MN crystal is determined spectrophotometrically as the number of Cy5.5 dye molecules attached to a single particle. The dye-to-particle ratio is obtained from concentrations of Cy5.5 and iron. Iron concentration is determined spectrophotometrically (15). For the Cy5.5 dye, the number of dyes per particle is obtained from absorption at 678 nm and an extinction coefficient of 250,000 M−1 cm−1. The labeling of MPAP per crystal is determined based on the release of pyridine-2-thione at 343 nm (e = 8.08 × 10³ M−1cm−1) after the addition of the reducing agent, TCEP (35 mM in DMSO).
The R1 and R2 relaxivities of the sample are determined at 37°C using a Minispec NMR spectrometer. These relaxivity values are measures of the longitudinal (R1) and transverse (R2) magnetization properties of a sample and are represented as mmol−1 s−1 for a given temperature.
Nanoparticle size is measured by light scattering.
3.5. Tumor Model
Five- to six-week-old female nu/nu mice are injected subcutaneously with a tumor cell line of interest (~3 × 10⁶ tumor cells). The cell line may be stably transformed with a gene encoding a fluorescent protein (GFP, RFP), in which case target gene silencing can be assessed using noninvasive optical imaging. Animals are imaged on days 10–14 after inoculation, when the tumors are ~0.5 cm in diameter.
3.6. Magnetic Resonance Imaging
MRI is performed before as well as 24 h after injection of MN-NIRF-siRNA (10 mg Fe/kg; ~440 nmol siRNA/kg) into the tail vein of the mouse (see Note 3).
For imaging, the mouse is anesthetized using isofluorane, 1.25% in 33% O2, balance N2O and placed prone in the magnet (9.4 T GE magnet with a Bruker Biospin Avance console equipped with ParaVision 3.0.1 software).
A 3 × 4 cm elliptical surface coil is used to transmit and receive.
-
The mouse is imaged using the following protocols:
Spin echo axial T2-weighted imaging. Parameters: TR/TE = 6000/60.49 ms, FOV = 3.2 × 3.2 cm2, matrix size 128 × 128, resolution 250 × 250 μm2, slice thickness = 0.5 mm (see Note 4).
MSME axial T2-weighted imaging (T2 map). Parameters: 3000/8, 16, 24, 32, 40, 48, 56, 64 ms; FOV = 3.2×3.2 cm2, matrix size 128×128, resolution 250× 250 μm2, and slice thickness = 0.5 mm (see Note 5).
-
After the pre-contrast (before injection of MN-NIRF-siRNA) and post-contrast (after injection of MN-NIRF-siRNA) images have been acquired, the data are analyzed using Marevisi 3.5 software (Institute for Biodiagnostics, National Research Council, Canada): MSME T2-weighted images are analyzed on a voxel-by-voxel basis by fitting the T2 measurements from the eight echo times (TE) to a standard exponential decay curve, defined by the formula y = A*exp(−t/T2).
Examples of MR images and T2 relaxation times are shown in Fig. 1.2a.
The tumors and adjacent muscle tissue are manually segmented out on these images. Their T2 relaxation times (ms) are computed by averaging the T2 relaxation times of the voxels within the tumor/muscle region of interest (ROI) from all of the slices incorporating tumor/muscle tissue (see Note 6).
Fig. 1.2.
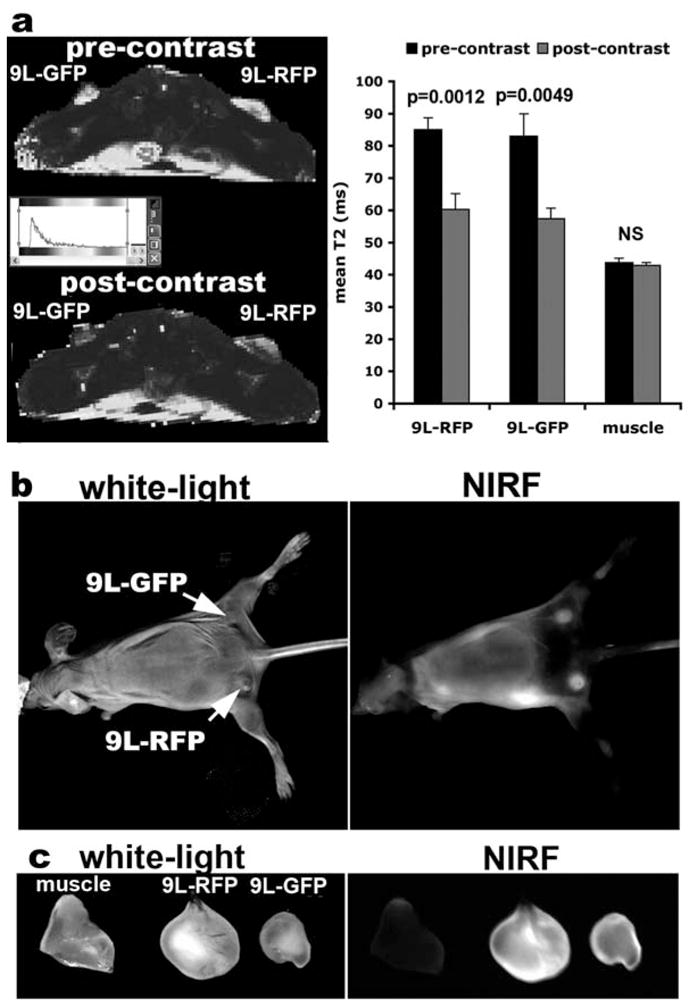
(a) In vivo MRI of mice bearing bilateral 9L rat gliosarcoma tumors stably transfected with either GFP or RFP before and 24 h after MN-NIRF-siGFP administration. After injection of the probe, there is a significant drop in tumor T2 relaxation times, whereas the T2 relaxation times of muscle tissue remain unchanged. (b) In vivo NIRF optical imaging of the same mice as in (a) produces a high-intensity NIRF signal associated with the tumors. (c) Ex vivo NIRF optical imaging demonstrates a higher fluorescence in tumors than in muscle tissue. This confirms the delivery of the MN-NIRF-siGFP probe to these tissues. (Reproduced from Medarova et al. (6), with permission from Nature Publishing Group).
3.7. In Vivo Near-Infrared Optical Imaging
Near-infrared optical imaging is performed immediately after each MRI session.
The mouse is anesthetized using isofluorane, 1.25% in 33% O2, balance N2O.
The animal is placed supine into a whole-body optical imaging system (Imaging Station IS2000MM, Kodak Scientific Imaging System, New Haven, CT, see Note 7).
For in vivo imaging, the following parameters are used: exposure time, 30.05 s; F-stop, 2.8; FOV, 100 mm; resolution, 260 dpi.
Examples of NIRF images are shown in Fig. 1.2b.
3.8. Ex Vivo Near-Infrared Optical Imaging
The animals are sacrificed with a high dose of sodium pentobarbital injected intraperitoneally (200 mg/kg IP).
The tumors and adjacent muscle tissue are excised and placed in the optical imaging system.
Tumor and muscle tissue are imaged using the following imaging parameters: exposure time, 30.05 s; F-stop, 2.8; FOV, 36.67 mm; resolution, 856 dpi.
3.9. Assessment of Target Gene Silencing: In Vivo Fluorescence Optical Imaging
Time-course in vivo fluorescence optical imaging is performed first at the same time as NIRF imaging, immediately after the pre-contrast MRI session, and after that every 12–24 h for a time period defined by the half-life of the target protein (see Note 8).
The mouse is anesthetized using isofluorane, 1.25% in 33% O2, balance N2O.
The animal is placed supine into a whole-body optical imaging system (Imaging Station IS2000MM, Kodak Scientific Imaging System, New Haven, CT).
For in vivo imaging, the following parameters are used: exposure time, 30.05 s; F-stop, 2.8; FOV, 100 mm; resolution, 260 dpi. For imaging of GFP, the following filters are used: excitation, 465 nm; emission, 535 nm. For imaging of RFP, the following filters are used: excitation, 535 nm; emission, 600 nm (see Notes 9 and 10).
Examples of in vivo fluorescence optical images are shown in Fig. 1.3a.
Fig. 1.3.
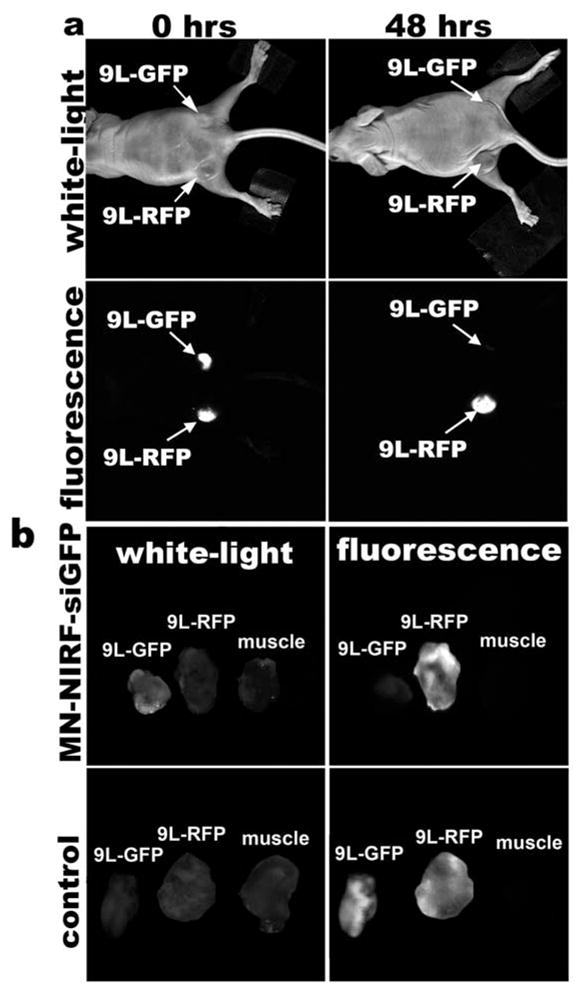
(a) In vivo NIRF optical imaging of mice bearing bilateral 9L-GFP and 9L-RFP tumors 48 h after intravenous probe injection. There is a marked decrease in 9L-GFP-associated fluorescence and no change in 9L-RFP fluorescence. To generate GFP/RFP reconstructions, GFP and RFP images are acquired separately and then merged. (b) Correlative ex vivo fluorescence optical imaging shows a drop in fluorescence intensity in 9L-GFP tumors. There is no evidence of silencing in saline-injected controls. (Reproduced from Medarova et al. (6), with permission from Nature Publishing Group).
3.10. Assessment of Target Gene Silencing: Ex Vivo Fluorescence Optical Imaging
-
Ex vivo fluorescence optical imaging is performed at the same time as NIRF imaging.
Tumor and muscle tissue are imaged using the following imaging parameters: exposure time, 30.05 s; F-stop, 2.8; FOV, 36.67 mm; resolution, 856 dpi. Filters for GFP and RFP are used, as specified above.
Examples of ex vivo fluorescence optical images are shown in Fig. 1.3b.
Acknowledgments
The authors would like to acknowledge Pamela Pantazopoulos (Martinos Center for Biomedical Imaging, MGH) for excellent technical support. This work was partially supported by K99 CA129070 to Z.M.
Footnotes
Considering that the MN-NIRF-siRNA agent incorporates ribonucleic acid molecules, the entire synthesis has to be completed under RNase-free conditions. All buffers and glassware need to be autoclaved or treated with RNaseZap® (Ambion, Austin, TX). Only sterile barrier pipette tips need to be used.
The advantage of this linker is the affordable chromophore of pyridine-2-thione, which was released after the sulfhydryl exchange between the cysteine side chain on MPAP and 2-pyridyl-disulfide group.
A dose of 10 mg Fe/kg is a standard dose of iron oxide contrast agent used in animal MRI studies. The amount of siRNA delivered depends on the coupling ratio of siRNA to MN achieved during synthesis. In our experience, a ratio of five siRNA molecules per MN crystal is sufficient for imaging and delivery.
The spin echo sequence is used for initial visualization of the ROI within the context of T2 relaxation.
The MSME sequence allows accurate measurement of the T2 relaxation time parameters of the tissues of interest.
Muscle tissue is used to define a reference T2 relaxation time to which to compare tumor relaxation time in order to determine if there is tumor-selective accumulation of the contrast agent.
The IS2000MM Kodak Scientific Imaging System is equipped with a 150-watt high-intensity halogen illuminator, which emits broadband white light. As recommended by the supplier (Eastman Kodak Company, New Haven, CT) for detection of Cy5.5 fluorescence, an optical bandpass excitation filter (X625, Eastman Kodak Company, New Haven, CT) is used to supply photons at 630 nm, with an attenuation of 0.5 OD at 700 nm, which is the wavelength characterizing the long-pass emission filter (e700WA, Eastman Kodak Company, New Haven, CT). Emitted light is collected using a thermoelectrically cooled CCD camera.
Time-course optical imaging is necessary in order to identify the time point associated with the maximum silencing as well as the longevity of the silencing effect. This is determined by the balance between the half-life of the target protein and the proliferation rate of the target cell. For rapidly dividing tumor cells stably expressing the firefly luciferase protein, for instance, the silencing effect typically persists for 7–10 days, whereas for non-dividing cells, this time period can extend for 3–4 weeks (16). For GFP/EGFP, whose half-life is about 26 h (17, 18), efficient silencing (70–95%) has been reported as early as 24–48 h after transfection (http://www.ambion.com/techlib/spec/sp4626.pdf).
Native tissue is associated with high absorption of visible light (~400–650 nm), reducing the sensitivity of detection of in vivo imaging studies within this range of wavelengths. Therefore, it is essential that the transgene is expressed by tumor cells at high enough levels for in vivo detection.
To generate GFP/RFP reconstructions based on the in vivo or ex vivo fluorescence optical images, GFP and RFP images are acquired separately without repositioning the animal and then merged using the Kodak 1DTM 3.6.3 Network software.
References
- 1.Brummelkamp TR, Bernards R, Agami R. Stable suppression of tumorigenicity by virus-mediated RNA interference. Cancer Cell. 2002;2:243–247. doi: 10.1016/s1535-6108(02)00122-8. [DOI] [PubMed] [Google Scholar]
- 2.Soutschek J, Akinc A, Bramlage B, Charisse K, Constien R, Donoghue M, Elbashir S, Geick A, Hadwiger P, Harborth J, John M, Kesavan V, Lavine G, Pandey RK, Racie T, Rajeev KG, Rohl I, Toudjarska I, Wang G, Wuschko S, Bumcrot D, Koteliansky V, Limmer S, Manoharan M, Vornlocher HP. Therapeutic silencing of an endogenous gene by systemic administration of modified siRNAs. Nature. 2004;432:173–178. doi: 10.1038/nature03121. [DOI] [PubMed] [Google Scholar]
- 3.Morrissey DV, Lockridge JA, Shaw L, Blanchard K, Jensen K, Breen W, Hartsough K, Machemer L, Radka S, Jadhav V, Vaish N, Zinnen S, Vargeese C, Bowman K, Shaffer CS, Jeffs LB, Judge A, MacLachlan I, Polisky B. Potent and persistent in vivo anti-HBV activity of chemically modified siRNAs. Nat Biotechnol. 2005;23:1002–1007. doi: 10.1038/nbt1122. [DOI] [PubMed] [Google Scholar]
- 4.Bartlett DW, Su H, Hildebrandt IJ, Weber WA, Davis ME. Impact of tumor-specific targeting on the biodistribution and efficacy of siRNA nanoparticles measured by multimodality in vivo imaging. Proc Natl Acad Sci USA. 2007;104:15549–15554. doi: 10.1073/pnas.0707461104. [DOI] [PMC free article] [PubMed] [Google Scholar]
- 5.Kumar P, Wu H, McBride JL, Jung KE, Kim MH, Davidson BL, Lee SK, Shankar P, Manjunath N. Transvascular delivery of small interfering RNA to the central nervous system. Nature. 2007;448:39–43. doi: 10.1038/nature05901. [DOI] [PubMed] [Google Scholar]
- 6.Medarova Z, Pham W, Farrar C, Petkova V, Moore A. In vivo imaging of siRNA delivery and silencing in tumors. Nat Med. 2007;13:372–377. doi: 10.1038/nm1486. [DOI] [PubMed] [Google Scholar]
- 7.Chen AA, Derfus AM, Khetani SR, Bhatia SN. Quantum dots to monitor RNAi delivery and improve gene silencing. Nucleic Acids Res. 2005;33:e190. doi: 10.1093/nar/gni188. [DOI] [PMC free article] [PubMed] [Google Scholar]
- 8.Derfus AM, Chen AA, Min DH, Ruoslahti E, Bhatia SN. Targeted quantum dot conjugates for siRNA delivery. Bioconjug Chem. 2007;18:1391–1396. doi: 10.1021/bc060367e. [DOI] [PubMed] [Google Scholar]
- 9.Liu N, Ding H, Vanderheyden JL, Zhu Z, Zhang Y. Radiolabeling small RNA with technetium-99m for visualizing cellular delivery and mouse biodistribution. Nucl Med Biol. 2007;34:399–404. doi: 10.1016/j.nucmedbio.2007.02.006. [DOI] [PubMed] [Google Scholar]
- 10.Chang E, Zhu MQ, Drezek R. Novel siRNA-based molecular beacons for dual imaging and therapy. Biotechnol J. 2007;2:422–425. doi: 10.1002/biot.200600257. [DOI] [PubMed] [Google Scholar]
- 11.Bakalova R, Zhelev Z, Ohba H, Baba Y. Quantum dot-conjugated hybridization probes for preliminary screening of siRNA sequences. J Am Chem Soc. 2005;127:11328–11335. doi: 10.1021/ja051089h. [DOI] [PubMed] [Google Scholar]
- 12.Viel T, Kuhnast B, Hinnen F, Boisgardi R, Tavitian B, Dollé F. Fluorine-18 labelling of small interfering RNAs (siRNAs) for PET imaging. J Labelled Comp Rad. 2007;50:1159–1168. [Google Scholar]
- 13.Medarova Z, Evgenov NV, Dai G, Bonner-Weir S, Moore A. In vivo multimodal imaging of transplanted pancreatic islets. Nat Protoc. 2006;1:429–435. doi: 10.1038/nprot.2006.63. [DOI] [PubMed] [Google Scholar]
- 14.Pham W, Zhao BQ, Lo EH, Medarova Z, Rosen B, Moore A. Crossing the blood–brain barrier: a potential application of myristoylated polyarginine for in vivo neuroimaging. Neuroimage. 2005;28:287–292. doi: 10.1016/j.neuroimage.2005.06.007. [DOI] [PubMed] [Google Scholar]
- 15.Moore A, Basilion JP, Chiocca EA, Weissleder R. Measuring transferrin receptor gene expression by NMR imaging. Biochim Biophys Acta. 1998;1402:239–249. doi: 10.1016/s0167-4889(98)00002-0. [DOI] [PubMed] [Google Scholar]
- 16.Bartlett DW, Davis ME. Insights into the kinetics of siRNA-mediated gene silencing from live-cell and live-animal bioluminescent imaging. Nucleic Acids Res. 2006;34:322–333. doi: 10.1093/nar/gkj439. [DOI] [PMC free article] [PubMed] [Google Scholar]
- 17.Corish P, Tyler-Smith C. Attenuation of green fluorescent protein half-life in mammalian cells. Protein Eng. 1999;12:1035–1040. doi: 10.1093/protein/12.12.1035. [DOI] [PubMed] [Google Scholar]
- 18.Ward CM, Stern PL. The human cytomegalovirus immediate-early promoter is transcriptionally active in undifferentiated mouse embryonic stem cells. Stem Cells. 2002;20:472–475. doi: 10.1634/stemcells.20-5-472. [DOI] [PubMed] [Google Scholar]