

Abstract
We analyzed ultrastructural changes and markers of fission/fusion in hepatocyte mitochondria from mice submitted to 40% calorie restriction (CR) for 6 months versus ad-libitum-fed controls. To study the effects of dietary fat under CR, animals were separated into three CR groups with soybean oil (also in controls), fish oil, and lard. CR induced differential changes in hepatocyte and mitochondrial size, in the volume fraction occupied by mitochondria, and in the number of mitochondria per hepatocyte. The number of cristae per mitochondrion was significantly higher in all CR groups compared with controls. Proteins related to mitochondrial fission (Fis1 and Drp1) increased with CR, but no changes were detected in proteins involved in mitochondrial fusion (Mfn1, Mfn2, and OPA1). Although many of these changes could be attributed to CR regardless of dietary fat, changing membrane lipid composition by different fat sources did modulate the effects of CR on hepatocyte mitochondria.
Key Words: Calorie restriction, Dietary fat, Hepatocyte, Mice, Mitochondrial ultrastructure, Mitochondrial fission and fusion
IT has been demonstrated in a large number of experimental models that calorie restriction (CR), a reduction in the amount of dietary energy intake without malnutrition, is one of the best known experimental interventions, which leads to an increase in life extension under laboratory conditions (1–3). Although a life-span-extending effect of CR in nonhuman primates still remains controversial (1,4), it is firmly established that CR prevented cancer, diabetes, hypertension, and other age-related diseases in a wide range of animals including nonhuman primates and humans (1,4,5). Due to its beneficial effect on health, CR has been widely used as a model that could provide insights into the delay of the aging process and on the underlying mechanisms of aging.
Currently, the free radical theory of aging (6) is among the most accepted theories to explain the positive effects of CR on health and life-span extension, and CR has been demonstrated to decrease reactive oxygen species (ROS) generation and oxidative injury (2). Thus, decreased damage to proteins and DNA (especially mitochondrial DNA) has been reported in CR animals (7–10). Moreover, an inverse correlation between life span and the degree of membrane phospholipid unsaturation has been proposed (10,11). The assumption has been made that polyunsaturated fatty acids are more susceptible to peroxidation and other modifications that result in the accumulation of oxidative injury in membranes containing these fatty acids. This idea is supported by a decreased content of polyunsaturated fatty acids in mitochondria isolated from different organs after CR (12). As one of the major ROS-producing constituents of the cell, special attention has been paid to the role of the mitochondria on these phenomena, and the proposal has been made that a combination of both “mitochondrial” and “membrane” theories of aging can explain the life-span extension effect of CR (13,14).
As highly dynamic organelles, mitochondria undergo continuous changes of morphology that include fusion, fission, and biogenesis processes (15). Thus, changes in the “mitochondrial cycle” and/or in its morphology and physiology have been reported in most tissues studied under different experimental conditions, as well as under pathological processes and aging (15–18). In this respect, it has been shown in different organs that CR reduces mitochondrial ROS generation (7,13,19–23), establishing a strong correlation between beneficial effects of CR and decreased oxidative damage at the mitochondrial level.
In an attempt to establish the precise role of the unsaturation degree of membrane phospholipids and the effects of CR, experiments have been carried out feeding animals with diets in which the composition of the dietary fat was controlled. Thus, Cha and Jones (24) found that changes in rat liver cell membrane phospholipid composition depended on the fatty acid saturation degree of dietary fat. However, these changes were diluted in animals fed diets with identical composition but under 25%–30% CR by decreasing carbohydrate intake. More recently, we reported changes in lipid composition and some physiological parameters of skeletal muscle mitochondria isolated from mice fed for 1 month with 40% CR diets with different dietary fat sources (soybean oil, fish oil, and lard) compared with controls fed ad libitum (AL) although few changes were detected between different fat sources under CR (25). On the other hand, following an identical feeding protocol, we found in liver significant differences in mitochondrial membrane composition and several measures of mitochondrial function depending on dietary fat under CR (26).
As the primary organ for fat, carbohydrate, and protein interconversion between storage and metabolizable forms, as well as for its multiplicity of functions (27,28), liver—more specifically, the hepatocyte—has been extensively used as a model to study the effects of CR and aging. The purpose of this study was to analyze changes in the ultrastructure and markers of mitochondrial fission and fusion in hepatocytes from mice submitted to 40% CR for 6 months. Furthermore, animals submitted to CR were fed different dietary fats to determine whether different degrees of fatty acid unsaturation play a role in the protective effects of CR on animal health. We used electron microscopy combined with planimetric and stereological techniques to achieve the first objective and the expression analysis of proteins involved in mitochondrial fission and fusion by Western immunoblotting to determine possible alterations of markers of these processes induced by CR and/or dietary fat.
Methods
Animals and Diets
A cohort of 64 ten-week-old male C57BL/6 mice was used (Charles River Laboratories, MA). Mice were bred and raised in a vivarium at the Centro Andaluz de Biología del Desarrollo (Sevilla, Spain) under a 12-h light/dark cycle (8:00 am to 8:00 pm) under controlled conditions of temperature (22±3°C) and humidity. The animals were fed an AIN-93G diet (Research Diets, NJ). Food intake was measured during 1 month to determine the average amount of food consumed per day. At 3 months of age, animals were randomly divided into four different experimental groups: AL (95% of average diary intake and using soybean oil as the fat source) and CR (60% average diary intake), which was further separated into three dietary groups depending on the fat source included in the diet. Soy diet contained soybean oil as the fat source. This diet is, therefore, enriched in linoleic acid. The Fish group was fed with the AIN-93G diet but containing fish oil, with a high content of polyunsaturated n-3 fatty acids, as the main fat source. Finally, the Lard group consisted of mice fed with the same diet but containing animal lard (rich in saturated fatty acids) as the fat source. We have published the whole composition of diets used for feeding each experimental group in recent reports (25,26). Filtered and acidified water was available AL for all groups, and food was replaced every day between 8:00 and 9:00 am.
Animals were handled in accordance with the Pablo de Olavide University Ethical Committee rules, and the 86/609/EEC Directive on the protection of animals used for experimental and other scientific purposes. Animals were fed for 6 months under these conditions, sacrificed after an 18-hour fast by cervical dislocation, and quickly dissected to obtain liver samples that were used for ultrastructural analysis, as well as for cytosolic and mitochondria-enriched fractions isolation for studies of fission/fusion markers.
Tissue Processing for Microscopy
Once the organs were removed and quickly washed, they were cut in small pieces of about 1mm3. For each animal, we processed about five to six liver pieces taken from the different lobules of the organ. About five to seven animals were processed in every dietary group. Samples were fixed in a mixture of 2.5% glutaraldehyde–2% paraformaldehyde in sodium cacodylate buffer (0.1M) for 4 hour and then postfixed in 1% osmium tetroxide for 1 hour at 4°C in the same buffer. After dehydration in an ascendant series of ethanol, the pieces were transferred to propylene oxide and sequentially infiltrated in EMbed 812 resin. We used the sequence propylene oxide–resin 2:1; 1:1, and 1:2 throughout 24 hour. Afterwards samples were transferred to pure resin for 24 hour. Blocks were formed in fresh resin contained in silicon molds, and the resin was then allowed to polymerize for 48 hour at 65°C. After sculpting, blocks were sectioned in an Ultracut Reicher ultramicrotome to get both semithick (0.5–1 μm width) and ultrathin (40–60nm width) sections for different purposes as follows.
Hepatocyte Size
Semithick sections were mounted on glass slides and stained with 1% toluidine blue in a 1% borax aqueous solution for 2 minutes. Micrographs were obtained using a Leica DME light microscope. On this material, we measured planimetric parameters of whole hepatocytes using the ImageJ software (N.I.H.). Cells were selected on the basis of showing a central nucleus and a circularity coefficient ranging from 0.85 to 1.0. About 1,000 hepatocytes from five animals per diet were measured. Final volumes were calculated assimilating hepatocyte shape to spheroids (29).
Mitochondrial Ultrastructure and Stereology
Ultrathin sections were mounted on nickel grids. After staining in aqueous 4% uranyl acetate and modified Sato’s lead citrate (30), the sections were viewed and photographed in a Philips CM-10 electron microscope. From this material, we obtained low-magnification micrographs (originally at ×5,800) to evaluate cell sizes (as a reference for further calculations), as well as the number of mitochondria profiles per cell. Higher magnification pictures of mitochondria (originally ×25,000) were used to obtain several ultrastructural parameters (area, maximum and minimum diameters, and circularity coefficients). These pictures were taken randomly from 35 to 40 hepatocytes per experimental group. We also measured cristae length on these pictures using planimetric techniques. In these cases, mitochondria were selected on the basis of showing a well-defined cristal ultrastructure. The number of cells, mitochondria, and/or cristae scored in each case is included in the corresponding table or figure caption.
In addition to the planimetric measurements, we performed a stereological analysis of the samples in order to get information on volumetric parameters of mitochondria. Thus, volume density (Vv) and numerical density (Nv) values were obtained following a point analysis according to previously described methods (31). Briefly, we selected 20 pictures of hepatocytes and performed a point-counting method (31) using a simple square-lattice test system of 5mm spacing (equivalent to 0.4 μm), which was applied to obtain Vv of mitochondria.
The numerical density of mitochondria (Nv) was obtained using the formula
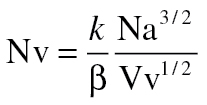 |
where “Na” is the numerical profile density (number of mitochondria/μm2 of cell) and k and β the mitochondrial size distribution and shape coefficient, respectively. These coefficients were calculated using the results of the previous planimetric measurements in hepatocytes and assimilating mitochondrial shape to regular prolate spheroids (31). Planimetric measurements on mitochondria were performed using ImageJ software (N.I.H.).
Total Mitochondrial Mass and Number of Mitochondria Per Cell
These parameters were calculated by multiplying Vv and Nv by mean hepatocyte volume. For comparisons, standard deviations were accumulated.
Isolation of Cytosolic and Mitochondria-Enriched Fractions From Liver
Liver samples were homogenized at 4°C in ice-cold isolation buffer containing 5mM Tris–HCl pH 7.4, 0.225M mannitol, 0.075M sucrose, 0.5mM ethylene glycol tetraacetic acid, 1mM phenylmethylsulfonyl fluoride, and 20 μg/μl each chymostatin, leupeptin, antipain, and pepstatin with the aid of a Teflon-glass tissue homogenizer. Samples were centrifuged at 600g for 5 minutes and the pellet was discarded. Additional centrifugation steps were performed until no pellet at 600g was observed. The final supernatant was then centrifuged for 15 minutes at 6,500g to obtain a mitochondrial-enriched fraction. Mitochondria were resuspended in 200 μl of isolation buffer and stored frozen at −80°C until further analysis. Supernatants were centrifuged again at 80,000g for 45 minutes to separate a cytosolic fraction.
Polyacrylamide Gel Electrophoresis and Western Blot Immunodetection of Mitochondrial Fission- and Fusion-Related Proteins
About 50 μg of mitochondrial protein was denatured by heating in sodium dodecyl sulfate (SDS)–dithiothreitol loading buffer containing 10% sucrose, 2mM ethylenediaminetetraacetic acid, 1.5% (w/v) SDS, 20mM dithiothreitol, 0.01% (w/v) bromophenol blue, and 60mM Tris–HCl pH 6.8; separated by SDS–polyacrylamide gel electrophoresis (12.5% acrylamide); and then blotted onto nitrocellulose sheets. Blots were stained with Ponceau S for visualization of protein lanes. For polypeptide detection, we used rabbit polyclonal sera against Fis1, Drp1, Mfn1, or Mfn2 (obtained from Santa Cruz Biotech) diluted at a range of 1:2000–1:3000. For OPA1 detection, we used a goat polyclonal antiserum (Santa Cruz Biotech) at a 1:2000 dilution. Drp1 was also immunodetected in blots obtained after eletrophoretic separation of 50 μg cytosolic protein. The corresponding secondary IgG antibodies (diluted from 1:200 to 1:5000) coupled to horseradish peroxidase (Sigma) were used to reveal binding sites by enhanced chemiluminescence (ECL-Plus, GE Healthcare Life Sciences).
Photographic films and Ponceau S-stained blots were scanned in a GS-800 calibrated densitometer (Bio-Rad) to obtain digital images. Quantification of reaction intensity was carried out using Quantity One software (Bio-Rad). Data obtained from quantification of stained bands (in arbitrary units) were normalized to those of the corresponding lane stained with Ponceau S in order to correct any difference in protein loading between samples, as previously validated by our group (32). In order to have an accurate estimation of changes produced by CR per se and by alterations of dietary fat in CR animals, the effects of these two dietary manipulations were assessed in separate electrophoresis gels and blots carried out under optimized conditions for each case. Thus, results of protein levels measured by Western blotting were also represented in separate plots: one for CR effects (AL-Soy vs CR-Soy) and the other one for dietary fat effects in CR animals (CR-Lard, CR-Soy, and CR-Fish).
Statistic Analysis
All values are expressed as mean ± SEM. Variables were tested for normality by using D’Agostino-Pearson test. Differences among diets were assessed by Student’s t test. In case data did not pass the normality test, the nonparametric Mann–Whitney test was followed. Post hoc analysis of linear trend was also performed to investigate putative alterations of tested parameters among CR diets ordered as CR-Lard → CR-Soy → CR-Fish, which resulted in a progressive decrease of n-6/n-3 ratio in phospholipids HUFA (25). Means were considered statistically different when p < .05. All statistical analyses were performed using Graphpad Prism 5.03 (Graphpad Software Inc, San Diego, CA).
Results
Mouse hepatocytes from the different dietary groups showed a typical morphology nearly identical to that described for these cell types in classical textbooks. However, after planimetric measurements of the cells, we did find some differences among dietary groups for several structural parameters. Although cell shapes remained fairly constant, major and minor diameters exhibited some variations in the different dietary groups, and consequently both section area and volume of hepatocytes changed with relation to the diet. In this way, 6 months of CR induced a slight but statistically significant increase of cell size in those animals fed diets containing soybean and fish oil (CR-Soy and CR-Fish groups). However, this increase of mean hepatocyte size was abolished when animals were subjected to CR with lard as the fat source (CR-Lard group; Table 1).
Table 1.
Hepatocyte Planimetric Parameters Measured in Semithick Sections Stained With Toluidine Blue
| AL | CR-Lard | CR-Soy | CR-Fish | |
|---|---|---|---|---|
| Area (µm2) | 357.4±3.4* | 348.7±3.9* | 381.2±4.6 | 387.0±3.8 |
| Major diameter (µm) | 23.9±0.12* | 23.6±0.14* | 24.8±0.13 | 25.1±0.13 |
| Minor diameter (µm) | 18.6±0.10* | 18.4±0.10* | 19.2±0.10 | 19.3±0.09 |
| Circularity | 0.89±0.0007 | 0.89±0.0008 | 0.89±0.0008 | 0.89±0.0008 |
| Cell volume (µm3) | 4666.8±68.1* | 4562.2±81.5* | 5113.5±73.8 | 5200.4±76.4 |
| n | 1,200 | 1,056 | 1,070 | 931 |
Note: Data are mean values ± SE. AL = ad libitum; CR = calorie restriction.
*p < .001 vs RC-Soy and RC-Fish groups. No differences were found when comparing AL with RC-Lard diets or RC-Soy with RC-Fish.
In spite of these changes, no striking differences concerning hepatocyte ultrastructural architecture were detected in AL- versus CR-fed animals (see Figure 1A and B as examples). Mitochondria occupied a high proportion of cells independent of the experimental group (described subsequently). Mitochondria could be found in different sizes and forms, but most of them exhibited a spherical to prolate ellipsoid shape with short cristae perpendicular to the longer axis of the organelle (Figure 2A–D). Although mitochondria were spread out over the cytoplasm, they frequently appeared as clusters of four to eight mitochondrial profiles surrounded by different cellular constituents (RER, lipid droplets, vesicles, etc.; Figure 2A–D).
Figure 1.

Electron micrographs of hepatocytes from mice submitted to an ad libitum diet (A) or to 6 months 40% CR with fish oil as the main fat source (B; CR-Fish) showing the general ultrastructure and preservation of the materials used for the quantitative analysis. Mitochondria (arrowheads) were found surrounding the nuclei (N). LD, lipid droplet; arrows, rough endoplasmic reticulum. The bars are equal to 2 μm.
Figure 2.

Ultrastructural details of mitochondria (M) from mice fed ad libitum (A) or subjected to 6 months caloric restriction (CR) with different fat sources (B, CR-Soy; C, CR-Fish; and D, CR-Lard). Quantitative changes were detected after the exhaustive planimetric study of the samples (see text). N, nucleus; LD, lipid droplet; arrows, rough endoplasmic reticulum. The bars are equal to 1 μm.
The mere observation of mitochondria under the electron microscope did not allow the detection of conspicuous ultrastructural changes among different experimental groups (compare Figure 1A and B). However, a quantitative planimetric analysis of the micrographs did reveal changes in several parameters related to mitochondrial morphology (Table 2). Thus, we detected changes in both major and minor diameters which consequently affected the mean section surface and volume of this organelle. We found that mitochondria from CR-Lard group showed increased section area compared with all other diets. However, this parameter remained unaltered in CR-Fish and CR-Soy compared with AL group (Table 2). An estimation of mean mitochondrial volume using the planimetric results and assimilating the mitochondrial shape to prolate spheroids yielded the result of an increased mitochondrial volume in those animals fed the CR-Lard compared with all other diets (Table 2). Finally, CR also induced changes in mitochondrial shape, with a decrease of circularity coefficients in all CR groups compared with the AL control. However, this effect was especially evident for CR-Fish, which displayed mitochondria with significantly decreased circularity coefficient compared with the other CR groups (Table 2).
Table 2.
Planimetric Parameters of Mitochondria Ultrastructure Measured in Micrographs of Hepatocytes From Animals Fed AL or Subjected to CR With Different Fat Sources
| AL | CR-Lard | CR-Soy | CR-Fish | |
|---|---|---|---|---|
| Mean mitochondrial section area (µm2) | 0.68±0.017 | 0.81±0.024a | 0.67±0.016 | 0.66±0.015 |
| Major diameter (µm) | 1.06±0.012b | 1.18±0.020 | 1.12±0.018 | 1.13±0.017 |
| Minor diameter (µm) | 0.78±0.009c | 0.83±0.011d | 0.74±0.008 | 0.72±0.008 |
| Circularity | 0.90±0.002e | 0.88±0.004 | 0.87±0.005 | 0.85±0.005f |
| Mean mitochondrial volume (µm3) | 0.406±0.020 | 0.512±0.024g | 0.361±0.014 | 0.344±0.012 |
| n | 500 | 394 | 388 | 425 |
Notes: Data are expressed as mean values ± SE. AL = ad libitum; CR = calorie restriction. Mitochondrial volumes were calculated assimilating mitochondrial shape to regular prolate spheroids and using the formula vol = 4/3π (major diameter/2) (minor diameter/2)2.
a*** vs AL and CR-Fish and ** vs CR-Soy.
b*** vs CR-Lard and ** vs CR-Fish.
c*** vs CR-Fish and * vs CR-Lard and CR-Soy.
d*** vs CR-Soy and CR-Fish.
e***vs CR-Soy and CR-Fish and ** vs CR-Lard.
f*** vs CR-Lard and * vs CR-Soy.
g*** vs CR-Soy and CR-Fish and ** vs CR-AL.
In addition to the planimetric analysis on individual mitochondria, we also measured the total surface occupied by this organelle in relation to the sectioned hepatocyte surface, and the results are included in Figure 3. In this case, we detected significant increases in the area ratio occupied by mitochondria in all of the CR-fed animals in comparison to those fed AL although no statistically significant changes were detected when comparing the different CR groups among them (Figure 3).
Figure 3.

Surface occupied by mitochondria in sections of hepatocytes from mice maintained on different diets. Data are referred as μm2 of mitochondria per μm2 cell. Data represent mean values ± SE. ***p < .001 vs ad-libitum-fed animals.
Mitochondrial cristae were also analyzed, and the results are summarized in Table 3. We found similar mean cristae lengths (ranging from 0.209 to 0.220 μm) when comparing all the dietary groups. However, our statistical analysis did reveal that cristae were significantly longer in hepatocyte mitochondria from CR-Fish compared with all other groups (Table 3). Remarkably, the mean number of cristae per mitochondrion was significantly increased in all CR groups compared with AL controls (Table 3).
Table 3.
Planimetric Analysis of Mitochondrial Cristae From Mice Fed an AL Diet and Submitted to Calorie Restriction With the Different Fat Sources (Lard, Soy, and Fish Oil)
| AL | RC-Lard | RC-Soy | RC-Fish | |
|---|---|---|---|---|
| Mean cristae length (µm) | 0.2195±0.002 | 0.2099±0.001 | 0.2100±0.001 | 0.2204±0.001a |
| Scored cristae (n) | 3,200 | 2,675 | 3,375 | 4,800 |
| Mean number of cristae/mitochondrion | 17.05±0.47b | 21.42±0.68 | 20.86±0.62 | 21.56±0.65 |
| Scored mitochondria (n) | 185 | 246 | 163 | 215 |
Note: AL = ad libitum; CR = calorie restriction.
a*** vs CR-Soy and CR-Lard and * vs AL.
b*** vs all other diets.
Next, we applied stereological methods to obtain information on the fraction of cell volume occupied by mitochondria (ie, volume density; Vv), and the results are shown in Figure 4. In general, cell volume occupied by mitochondria ranged from 14% to 22% depending on the group. As observed in Figure 4, all CR groups showed a significant increase in this parameter compared with AL-fed animals (Figure 4), whereas no differences among the three CR groups were observed. The numerical density (ie, number of mitochondria per cell volume unit, Nv) was also increased in animals under CR regardless of the predominant dietary fat source, with no differences among CR groups (Figure 5). Our results of the estimation of total volume occupied by mitochondria and the total number of mitochondria per cell are shown in Table 4. As observed, both parameters increased significantly in all of the CR groups compared with the AL group although no differences were found when comparing among the different CR groups (Table 4).
Figure 4.

Changes in Volume density (Vv) of mitochondria in mouse hepatocytes from the different experimental groups. As observed, the volume fraction of mitochondria referred to the cellular volume increased under CR compared with ad-libitum-fed animals. The highest values were found in CR-Lard groups. Data are expressed in μm3 of mitochondria per μm3 of cell ± SE. ***p < .001 vs ad libitum group.
Figure 5.

Numerical density (Nv) of hepatocyte mitochondria from mice maintained on different diets. This parameter was increased under CR compared with ad-libitum-fed animals. Data are expressed as number of mitochondria per μm3 of cell ± SE. ***p < .001; **p < .01 vs ad-libitum-fed animals.
Table 4.
Mitochondrial Mass (in µm3 Per Cell) and Number of Mitochondria Per Cell in Hepatocytes From AL-Fed Mice and Mice Subjected to CR With Different Dietary Fats
| AL | CR-Lard | CR-Soy | CR-Fish | |
|---|---|---|---|---|
| Total mitochondrial mass | 658.6±28.3* | 969.6±72.4 (47%) | 1023.4±38.9 (55%) | 1011.8±61.5 (53%) |
| Number of mitochondria per cell | 1,334±55* | 1,997±174 (49%) | 2,127±84 (59%) | 1950±157 (46%) |
Notes: AL = ad libitum; CR = calorie restriction. Data (mean values) were obtained multiplying each Vv or Nv by its corresponding mean cell volume. The relative increase (in %) in relation to AL-fed animals is indicated within parentheses.
*p < .001 vs all the other diets.
In order to establish a possible relationship between the ultrastructural changes and the differences in mitochondrial mass with fission/fusion processes in this organelle, we performed an analysis on the expression of proteins related to these events. Unlike Drp1 that resides mostly in the cytosol and that is recruited to mitochondria to promote fission events, Fis1, Mfn1, Mfn2, and OPA1 are mitochondrial intrinsic proteins (17,33–36). Therefore, Drp1 was determined in both cytosolic and mitochondria-enriched fractions, whereas Fis1, Mfn1, Mfn2, and OPA1 were only determined in the latter. As depicted in Figure 6A and B, the levels of Drp1 in cytosol did not show statistically significant differences either due to CR (Figure 6A) or due to dietary fat under CR conditions (Figure 6B). However, when Drp1 expression was evaluated in mitochondria-enriched fractions, we detected a significant increase in liver mitochondria isolated from the CR-Soy group compared with its AL counterpart (Figure 6C). In addition, when the different CR conditions were compared, a significant decrease was found in the CR-Fish group compared with CR-Lard. Furthermore, post hoc analysis of linear trend among CR diets ordered as CR-Lard, CR-Soy, and CR-Fish was statistically significant (Figure 6D).
Figure 6.

Levels of proteins related to mitochondrial fission Drp1 and Fis1. In cytosolic fractions, Drp1 expression remained unaltered in calorie restricted animals vs their ad-libitum-fed counterparts (panel A). In this fraction, dietary fat did not induce any additional change in Drp1 (panel B). In mitochondria-enriched fractions, both Drp1 and Fis1 protein levels were increased with calorie restriction (CR, *p < .05; see panels C and E). When different CR diets were compared, a significant linear trend (#) was observed for levels of Drp1 protein (panel D), giving CR-Lard dietary group the highest value and CR-Fish the lowest one. In addition, levels in CR-Fish mice were significantly lower than those in CR-Lard and CR-Soy groups (*p < .05). The same linear trend was observed for Fis1 (panel F), with CR-Lard exhibiting again significantly higher protein levels that CR-Fish (*p < .05).
Interestingly, nearly identical results were obtained when the expression levels of the Fis1 protein were compared among the different experimental groups. Thus, CR induced increased expression levels of Fis1 in relation to the AL-fed animals (Figure 6E). Also, when comparing the CR groups, we found a significant decreased expression of Fis1 in those animals fed the Fish diet compared with Lard-fed animals. As indicated for Drp1, a statistical significant linear trend of Fis1 expression was found in CR-fed animal ordered as Lard, Soy, and Fish (Figure 6F).
Unlike the results obtained for fission proteins, the three fusion proteins examined (Mfn1, Mfn2, and OPA1) did not exhibit changes when comparing AL- and CR-fed animals (Figure 7A, C, and E) or the different CR groups (Figure 7B, D, and F). Thus, neither CR nor dietary fat seemed to induce changes in the expression levels of the evaluated fusion proteins.
Figure 7.

Levels of proteins related to mitochondrial fusion: Mfn1 (A and B), Mfn2 (C and D), and OPA1 (E and F). Protein levels remained unaltered either under calorie restriction or due to dietary fat source variations.
Discussion
Life-span extension in animals fed diets in which the energy intake has been reduced (ie, caloric restriction, CR) has been correlated with a decrease in cell oxidative injury which, in turn, affects macromolecular structure and function (5,37). Furthermore, an inverse relationship between maximal life span and the degree of fatty acid unsaturation has been observed in interspecies comparisons (10,11), and a proposal has been made that CR could act by modulating fatty acid composition in tissue phospholipids (12). Because membrane lipid composition depends in part on the specific dietary fat (38,39), the possibility exists that changing the predominant dietary fat under CR conditions could modify the effects of CR on animal physiology and aging. In this sense, Mattison et al. (4) have very recently pointed out the diet composition as one of the major causes to explain the contrasting results on life-span investigation in rhesus monkeys (1,4). Thus, this study was set to evaluate the possible effects of 6-month 40% CR- versus AL-fed animals using soybean oil (enriched in n-6 fatty acids) as fat source in both diets, as well as to test the effect of different dietary fats, such as fish oil (enriched in n-3) and lard (enriched in saturated fatty acids), on liver mitochondrial structure, mass, and fission/fusion markers.
In this article, we report changes in relative and absolute parameters related to mitochondrial morphology and morphometry in mouse hepatocytes. It is important to mention that our quantitative data on hepatocyte and mitochondria structure fit well with those reported in classical and more recent studies carried out with both mice and rats (29,40–44). Thus, we are confident that our methodology has been applied with accuracy and success.
After 6 months CR, we found a slight but significant increase in hepatocyte size in those animals fed the CR-Soy in comparison to those fed AL. These changes were also observed in mice submitted to the Fish diet, but in those animals in which the dietary fat was lard (Lard group) the hepatocyte size was similar to that found in AL-fed mice. It is well known that body weight decreases with CR and so do different organs including liver, but in some cases an increased liver size relative to body mass has been reported as well (25,26,41). On the other hand, liver volume decreases during aging although hepatocyte size increases 60% during development and maturation and declines during senescence (45), indicating an accommodation of cellular size to the different physiological status of the animal. Also, Díaz-Muñoz et al. (46) found increased hepatocyte size in rats submitted to restricted feeding schedules in parallel with decreased body and liver weight. In our experiments, we have found differences in cell sizes depending on the dietary fat, indicating differential regulatory mechanisms of hepatic physiology after 6 months of CR.
Ultrastructural changes in mitochondria have been described in rodents submitted to different diets and under CR conditions. For example, Kiki et al. (47) found an increase in the number of mitochondria and number of “long length” mitochondria in rats submitted to high-fat diets, and Eagles and Chapman (27) reported increases of mitochondrial size in rats submitted to 10% CR and ketogenic diets (high-fat enriched). However, in these articles, no information was provided about the actual size neither of mitochondria nor about absolute or relative amounts of mitochondria per cell. On the other hand, using electron microscopy and morphometric techniques, Meijer and Afzelius (48) had previously reported increases of both mean mitochondrial area and relative cellular area occupied by mitochondria in mice subjected to 15 hour starvation. In that article, the authors provided information on actual sizes of mitochondria and, interestingly, our data concerning mitochondrial size in AL versus the different CR conditions fit well with data reported there.
The number and morphology of cristae likely reflect the response of the mitochondria to the energy demands of the cell (15,49). Our results showed increased cristae length in CR-Fish although these changes represented less than 5% of variation versus the other experimental groups. However, remarkable differences were found in the mean number of cristae per mitochondrion. Thus, CR induced a significant increase (about 25% as average) of this parameter compared with AL-fed mice although dietary fat did not induce any additional change. Although some changes in cristae number and morphology have been reported under several experimental conditions, to our knowledge this is the first time that increased number of cristae per mitochondrion under CR is reported. Because cristae membrane has been suggested to be the preferential site of oxidative phosphorylation (50), the increased number found under CR conditions could represent a metabolic adaptation to the low-energy state under these conditions.
Changes in mitochondrial mass of hepatocytes from mice subjected to CR have been described as well. López-Lluch et al. (23) using different approaches that also included electron microscopy reported a significant increase in the number of mitochondria per cell in animals fed under 40% CR. In our experiments, 6 months of CR produced increases in relative mitochondrial mass, measured as volume and numerical densities, in mice subjected to CR independent of the dietary fat.
The estimation of cell size on each experimental group gave us the possibility to calculate absolute parameters such as total volume of cell occupied by mitochondria (which can be assimilated to mitochondrial mass) and mean number of mitochondria per hepatocyte (Table 4). Of note, our absolute values were close to those reported previously for liver tissue (40,42,43). Our data clearly show a significant increase of mean number of mitochondria per cell in animals fed under CR, which is in agreement with a previous quantitative study (23). Furthermore, the mitochondrial mass was independent of the dietary fat, which indicates that this cellular modification is independent of level of fatty acid unsaturation.
Similar changes to those reported previously were also observed in mice fed a diet supplemented with resveratrol, a molecule widely used as a partial mimetic of CR; see (50,51) for recent reviews. Baur et al. (52) investigated the effect of resveratrol in middle-aged mice fed a high caloric diet, and they found improved health and survival consistent with a shift toward the physiology of mice fed a standard diet. Among the changes associated with longer life span, an increase in hepatocyte mitochondrial number was reported (52). In a similar way, hepatocytes from senescence-accelerated mice SAMP10 fed diets enriched in resveratrol exhibited a significant increase in the mean number of mitochondria per cell and a decrease in lipids droplets (53).
We have studied possible changes in expression levels of mitochondrial fission and fusion proteins with our dietary interventions. Drp1 levels did not show changes among dietary groups when measured in cytosol, but did increase in animals fed under CR, especially in CR-Lard and CR-Soy groups when measured in mitochondria-enriched fractions. This fact could indicate an increased capacity of mitochondria from CR-fed animals to recruit Drp1 being this phenomenon relatively independent of the dietary fat.
In general, our results on Drp1 and Fis1 are in accordance with those reported by Nisoli et al. (54) and López-Lluch et al. (23) who showed an increased number of mitochondria together with an increase in parameters related to mitochondrial biogenesis in animals submitted to CR, as also found in animals fed a resveratrol-supplemented diet (52). Because mitochondria cannot be made de novo (55), fission is the postulated mechanism for mitochondrial proliferation (15). Therefore, in spite of the objection recently reported (56,57), our results showing significant increases of Fis1 and Drp1 expression and the mean number of mitochondria per hepatocyte in CR-fed animals clearly support the idea of increased mitochondrial biogenesis under CR conditions (23,54).
Unlike the results obtained for mitochondrial fission proteins, no changes in the expression level of fusion proteins were found in any of our experimental groups. These results could be related to the physiological effects of these proteins on membrane fusion processes that can result in longer and branched mitochondria (33,58). Despite discrete changes in some morphometric parameters, the mitochondrial morphology remained basically unaltered in hepatocytes from the different dietary groups, and no large or branched mitochondria were found in a significant amount.
Fission and fusion protein control the morphology and number of mitochondria in the cell, and changes in the equilibrium between both processes are important in development and disease (17,34,35). In this sense, our results are compatible with the significant increase of mitochondrial mass after 6 months of CR without increasing the number of irregular mitochondria. Although the increase in the levels of fission proteins was observed for all three CR groups, some changes were detected in their expression levels depending on the dietary fat. Thus, we found a decreasing trend in levels of fission proteins from the saturated fat–enriched diet (Lard) toward the n-3 fatty acid–enriched diet (Fish), indicating a specific effect of dietary fat on mitochondrial fission.
Also, the presence of higher fission factors may indicate the adaptation of mitochondria to bioenergetic changes induced by CR in hepatocytes. In fact, the removal of damaged mitochondria by mitophagy has been related to the prolongevity effect of CR (18,59). CR induces a higher amount of low ΔΨm mitochondria in cells (23) probably indicating a population selected to be eliminated by mitophagy, because ΔΨm in daughter mitochondria can be different after fission. As an alternative fate, low ΔΨm mitochondria can remain in a resting state for further adaptation, whereas high ΔΨm siblings can fuse with others or grow by incorporation of new proteins (60,61).
Following the assumption that the degree of unsaturation affects membrane susceptibility to ROS, different attempts have been made to modify membrane composition by dietary fat in liver (24,26) and skeletal muscles (25) and thus to determine the precise role that specific dietary fats play on in the actions of CR. In a previous article focused on liver from mice following 1 month of CR with the same dietary fat sources used in this study, we found changes in mitochondrial phospholipid fatty acids on each experimental group that depended on the dietary fat and also differences in several mitochondrial processes such as ROS production, proton leak, and electron transport chain activities (26). We concluded that some effects of CR may be modulated by the dietary fat, and according to these results, it is possible to assume that dietary fat could modulate the effects of CR by inducing changes in membrane fatty acid composition. In this sense, our results showing differences in ultrastructure and fission/fusion markers of hepatocyte mitochondria could also be explained on the basis of changes in mitochondrial membrane composition due to the different experimental diets. However, further experiments including long-term treatments of CR and different dietary fats are needed to test this hypothesis.
In summary, 6 months of CR with different dietary fats induced changes in mouse hepatocytes which included morphometric features of individual mitochondria (such as area, volume, and number of cristae) and stereological parameters, as well as in proteins involved in mitochondrial fission and fusion processes. Dietary fat alterations in animals subjected to CR also had important effects on hepatocyte size in such a way that the achieved mitochondrial mass (total volume occupied by mitochondria and mean number of mitochondria per cell) was nearly identical in all the CR animals. This could indicate the existence of different regulatory mechanisms modulated by dietary fat to reach an optimal mitochondrial mass and physiology in hepatocytes from animals fed under CR.
Funding
This work was supported by NIH grant 1R01AG028125-01A1 (to J.J.R., P.N., and J.M.V.), Ministerio de Economía y Competitividad BFU2011-23578 (to J.M.V.), Junta de Andalucía Proyectos de Excelencia grant P09-CVI-4887 (to J.M.V.), Junta de Andalucía Proyectos Internacionales grant (to J.M.V.), and BIO-276 (Junta de Andalucía and the University of Córdoba, to J.M.V.). H.K. was funded by a predoctoral fellowship of the Agencia Española de Cooperación Internacional al Desarrollo and BIO-276. J.A.L.D. was funded by a predoctoral fellowship of the Spanish Ministerio de Educación and BIO-276.
References
- 1. Colman RJ, Anderson RM, Johnson SC, et al. Caloric restriction delays disease onset and mortality in rhesus monkeys. Science 2009; 325: 201–204 [DOI] [PMC free article] [PubMed] [Google Scholar]
- 2. Sohal RS, Weindruch R. Oxidative stress, caloric restriction, and aging. Science 1996; 273: 59–63 [DOI] [PMC free article] [PubMed] [Google Scholar]
- 3. Weindruch RH, Walford RL. The Retardation of Aging and Disease by Dietary Restriction. Springfield, IL: Charles C. Thomas; 1988. [Google Scholar]
- 4. Mattison JA, Roth GS, Beasley TM, et al. Impact of caloric restriction on health and survival in rhesus monkeys from the NIA study. Nature 2012; 489: 318–321 [DOI] [PMC free article] [PubMed] [Google Scholar]
- 5. Weindruch R, Sohal RS. Seminars in medicine of the Beth Israel Deaconess Medical Center. Caloric intake and aging. N Engl J Med 1997; 337: 986–994 [DOI] [PMC free article] [PubMed] [Google Scholar]
- 6. Harman D. Aging: a theory based on free radical and radiation chemistry. J Gerontol 1956; 11: 298–300 [DOI] [PubMed] [Google Scholar]
- 7. Sohal RS, Agarwal S, Candas M, Forster MJ, Lal H. Effect of age and caloric restriction on DNA oxidative damage in different tissues of C57BL/6 mice. Mech Ageing Dev 1994; 76: 215–224 [DOI] [PubMed] [Google Scholar]
- 8. Youngman LD, Park JY, Ames BN. Protein oxidation associated with aging is reduced by dietary restriction of protein or calories. Proc Natl Acad Sci USA 1992; 89: 9112–9116 [DOI] [PMC free article] [PubMed] [Google Scholar]
- 9. Kaneko T, Tahara S, Matsuo M. Retarding effect of dietary restriction on the accumulation of 8-hydroxy-2’-deoxyguanosine in organs of Fischer 344 rats during aging. Free Radic Biol Med 1997; 23: 76–81 [DOI] [PubMed] [Google Scholar]
- 10. Pamplona R, Barja G, Portero-Otín M. Membrane fatty acid unsaturation, protection against oxidative stress, and maximum life span: a homeoviscous-longevity adaptation? Ann N Y Acad Sci 2002; 959: 475–490 [DOI] [PubMed] [Google Scholar]
- 11. Hulbert AJ. Life, death and membrane bilayers. J Exp Biol 2003; 206(Pt 14):2303–2311 [DOI] [PubMed] [Google Scholar]
- 12. Yu BP, Lim BO, Sugano M. Dietary restriction downregulates free radical and lipid peroxide production: plausible mechanism for elongation of life span. J Nutr Sci Vitaminol 2002; 48: 257–264 [DOI] [PubMed] [Google Scholar]
- 13. Bevilacqua L, Ramsey JJ, Hagopian K, Weindruch R, Harper ME. Effects of short- and medium-term calorie restriction on muscle mitochondrial proton leak and reactive oxygen species production. Am J Physiol Endocrinol Metab 2004; 286: E852–E861 [DOI] [PubMed] [Google Scholar]
- 14. Hagopian K, Harper ME, Ram JJ, Humble SJ, Weindruch R, Ramsey JJ. Long-term calorie restriction reduces proton leak and hydrogen peroxide production in liver mitochondria. Am J Physiol Endocrinol Metab 2005; 288: E674–E684 [DOI] [PubMed] [Google Scholar]
- 15. Scheffler IE. Structure and morphology. Integration into the cell. In: Mitochondria. Hoboken, NJ: John Wiley and Sons; 2008: 18–59 [Google Scholar]
- 16. Arismendi-Morillo G. Electron microscopy morphology of the mitochondrial network in human cancer. Int J Biochem Cell Biol 2009; 41: 2062–2068 [DOI] [PubMed] [Google Scholar]
- 17. Chan DC. Mitochondria: dynamic organelles in disease, aging, and development. Cell 2006; 125: 1241–1252 [DOI] [PubMed] [Google Scholar]
- 18. López-Lluch G, Irusta PM, Navas P, de Cabo R. Mitochondrial biogenesis and healthy aging. Exp Gerontol 2008; 43: 813–819 [DOI] [PMC free article] [PubMed] [Google Scholar]
- 19. Bevilacqua L, Ramsey JJ, Hagopian K, Weindruch R, Harper ME. Long-term caloric restriction increases UCP3 content but decreases proton leak and reactive oxygen species production in rat skeletal muscle mitochondria. Am J Physiol Endocrinol Metab 2005; 289: E429–E438 [DOI] [PubMed] [Google Scholar]
- 20. Gredilla R, Barja G, López-Torres M. Effect of short-term caloric restriction on H2O2 production and oxidative DNA damage in rat liver mitochondria and location of the free radical source. J Bioenerg Biomembr 2001; 33: 279–287 [DOI] [PubMed] [Google Scholar]
- 21. Judge S, Judge A, Grune T, Leeuwenburgh C. Short-term CR decreases cardiac mitochondrial oxidant production but increases carbonyl content. Am J Physiol Regul Integr Comp Physiol 2004; 286: R254–R259 [DOI] [PubMed] [Google Scholar]
- 22. Sanz A, Caro P, Ibañez J, Gómez J, Gredilla R, Barja G. Dietary restriction at old age lowers mitochondrial oxygen radical production and leak at complex I and oxidative DNA damage in rat brain. J Bioenerg Biomembr 2005; 37: 83–90 [DOI] [PubMed] [Google Scholar]
- 23. López-Lluch G, Hunt N, Jones B, et al. Calorie restriction induces mitochondrial biogenesis and bioenergetic efficiency. Proc Natl Acad Sci USA 2006; 103: 1768–1773 [DOI] [PMC free article] [PubMed] [Google Scholar]
- 24. Cha MC, Jones PJ. Energy restriction dilutes the changes related to dietary fat type in membrane phospholipid fatty acid composition in rats. Metab Clin Exp 2000; 49: 977–983 [DOI] [PubMed] [Google Scholar]
- 25. Chen Y, Hagopian K, McDonald RB, et al. The influence of dietary lipid composition on skeletal muscle mitochondria from mice following 1 month of calorie restriction. J Gerontol A Biol Sci Med Sci 2012; 67: 1121–1131 [DOI] [PMC free article] [PubMed] [Google Scholar]
- 26. Chen Y, Hagopian K, Bibus D, et al. The influence of dietary lipid composition on liver mitochondria from mice following 1 month of calorie restriction. Biosci Rep. 10.1042/BSR20120060 [DOI] [PMC free article] [PubMed] [Google Scholar]
- 27. Eagles DA, Chapman GB. A light- and electron-microscope study of hepatocytes of rats fed different diets. C R Biol 2007; 330: 62–70 [DOI] [PubMed] [Google Scholar]
- 28. Malhi H, Guicciardi ME, Gores GJ. Hepatocyte death: a clear and present danger. Physiol Rev 2010; 90: 1165–1194 [DOI] [PMC free article] [PubMed] [Google Scholar]
- 29. Uhal BD, Roehrig KL. Effect of dietary state on hepatocyte size. Biosci Rep 1982; 2: 1003–1007 [DOI] [PubMed] [Google Scholar]
- 30. Sato T. A modified method for lead staining of thin sections. J Electron Microsc (Tokyo) 1968; 17: 158–159 [PubMed] [Google Scholar]
- 31. Weibel ER. Stereological Methods. Vol 1. Practical Methods for Biological Morphometry. New York, NY: Academic Press; 1979. [Google Scholar]
- 32. Bello RI, Alcaín FJ, Gómez-Díaz C, López-Lluch G, Navas P, Villalba JM. Hydrogen peroxide- and cell-density-regulated expression of NADH-cytochrome b5 reductase in HeLa cells. J Bioenerg Biomembr 2003; 35: 169–179 [DOI] [PubMed] [Google Scholar]
- 33. Seo AY, Joseph AM, Dutta D, Hwang JC, Aris JP, Leeuwenburgh C. New insights into the role of mitochondria in aging: mitochondrial dynamics and more. J Cell Sci 2010; 123(Pt 15):2533–2542 [DOI] [PMC free article] [PubMed] [Google Scholar]
- 34. Mai S, Klinkenberg M, Auburger G, Bereiter-Hahn J, Jendrach M. Decreased expression of Drp1 and Fis1 mediates mitochondrial elongation in senescent cells and enhances resistance to oxidative stress through PINK1. J Cell Sci 2010; 123(Pt 6):917–926 [DOI] [PubMed] [Google Scholar]
- 35. Huang P, Galloway CA, Yoon Y. Control of mitochondrial morphology through differential interactions of mitochondrial fusion and fission proteins. PLOS One 2011; 6(5):e20655 [DOI] [PMC free article] [PubMed] [Google Scholar]
- 36. Chan DC. Fusion and fission: interlinked processes critical for mitochondrial health. Annu Rev Genet 2012; 46: 265–287 [DOI] [PubMed] [Google Scholar]
- 37. Masoro EJ. Caloric restriction and aging: an update. Exp Gerontol 2000; 35: 299–305 [DOI] [PubMed] [Google Scholar]
- 38. Ochoa JJ, Quiles JL, Ramírez-Tortosa MC, Mataix J, Huertas JR. Dietary oils high in oleic acid but with different unsaponifiable fraction contents have different effects in fatty acid composition and peroxidation in rabbit LDL. Nutrition 2002; 18: 60–65 [DOI] [PubMed] [Google Scholar]
- 39. Ochoa-Herrera JJ, Huertas JR, Quiles JL, Mataix J. Dietary oils high in oleic acid, but with different non-glyceride contents, have different effects on lipid profiles and peroxidation in rabbit hepatic mitochondria. J Nutr Biochem 2001; 12: 357–364 [DOI] [PubMed] [Google Scholar]
- 40. Pieri C, Giuli C, Del Moro M, Piantanelli L. Electron-microscopic morphometric analysis of mouse liver. II. Effect of ageing and thymus transplantation in old animals. Mech Ageing Dev 1980; 13: 275–283 [DOI] [PubMed] [Google Scholar]
- 41. Murray AB, Strecker W, Silz S. Ultrastructural changes in rat hepatocytes after partial hepatectomy, and comparison with biochemical results. J Cell Sci 1981; 50: 433–448 [DOI] [PubMed] [Google Scholar]
- 42. Jakovcic S, Swift HH, Gross NJ, Rabinowitz M. Biochemical and stereological analysis of rat liver mitochondria in different thyroid states. J Cell Biol 1978; 77: 887–901 [DOI] [PMC free article] [PubMed] [Google Scholar]
- 43. Gray RH, Adam-Rodwell GA, Maris D, Haskins JR, Stoner GD. Quantitative microscopy of hepatic changes induced by phenethyl isothiocyanate in Fischer-344 rats fed either a cereal-based diet or a purified diet. Toxicol Pathol 1995; 23: 644–652 [DOI] [PubMed] [Google Scholar]
- 44. Fazelipour S, Kiaei SB, Tootian Z, Dashtnavard H. Histomorphometric study of hepatocytes of mice after using heroin. Int J Pharmacol 2008; 4: 496–499 [Google Scholar]
- 45. Schmucker DL. Age-related changes in liver structure and function: Implications for disease? Exp Gerontol 2005; 40: 650–659 [DOI] [PubMed] [Google Scholar]
- 46. Díaz-Muñoz M, Vázquez-Martínez O, Báez-Ruiz A, et al. Daytime food restriction alters liver glycogen, triacylglycerols, and cell size. A histochemical, morphometric, and ultrastructural study. Comp Hepatol 2010; 9: 5 [DOI] [PMC free article] [PubMed] [Google Scholar]
- 47. Kiki I, Altunkaynak BZ, Altunkaynak ME, Vuraler O, Unal D, Kaplan S. Effect of high fat diet on the volume of liver and quantitative feature of Kupffer cells in the female rat: a stereological and ultrastructural study. Obes Surg 2007; 17: 1381–1388 [DOI] [PubMed] [Google Scholar]
- 48. Meijer J, Afzelius BA. Effects of clofibrate treatment and of starvation on peroxisomes, mitochondria, and lipid droplets in mouse hepatocytes: a morphometric study. J Ultrastruct Mol Struct Res 1989; 102: 87–94 [DOI] [PubMed] [Google Scholar]
- 49. Zick M, Rabl R, Reichert AS. Cristae formation-linking ultrastructure and function of mitochondria. Biochim Biophys Acta 2009; 1793: 5–19 [DOI] [PubMed] [Google Scholar]
- 50. Agarwal B, Baur JA. Resveratrol and life extension. Ann N Y Acad Sci 2011; 1215: 138–143 [DOI] [PubMed] [Google Scholar]
- 51. Villalba JM, Alcaín FJ. Sirtuin activators and inhibitors. Biofactors 2012; 38: 349–359 [DOI] [PMC free article] [PubMed] [Google Scholar]
- 52. Baur JA, Pearson KJ, Price NL, et al. Resveratrol improves health and survival of mice on a high-calorie diet. Nature 2006; 444: 337–342 [DOI] [PMC free article] [PubMed] [Google Scholar]
- 53. Shiozaki M, Hayakawa N, Shibata M, Koike M, Uchiyama Y, Gotow T. Closer association of mitochondria with lipid droplets in hepatocytes and activation of Kupffer cells in resveratrol-treated senescence-accelerated mice. Histochem Cell Biol 2011; 136: 475–489 [DOI] [PubMed] [Google Scholar]
- 54. Nisoli E, Tonello C, Cardile A, et al. Calorie restriction promotes mitochondrial biogenesis by inducing the expression of eNOS. Science 2005; 310: 314–317 [DOI] [PubMed] [Google Scholar]
- 55. Ryan TR, Hoogenrad NJ. Mitochondrial-nuclear communications. Annu Rev Biochem. 2007; 76: 701–722 [DOI] [PubMed] [Google Scholar]
- 56. Hancock CR, Han DH, Higashida K, Kim SH, Holloszy JO. Does calorie restriction induce mitochondrial biogenesis? A reevaluation. FASEB J 2011; 25: 785–791 [DOI] [PMC free article] [PubMed] [Google Scholar]
- 57. Miller BF, Robinson MM, Bruss MD, Hellerstein M, Hamilton KL. A comprehensive assessment of mitochondrial protein synthesis and cellular proliferation with age and caloric restriction. Aging Cell 2012; 11: 150–161 [DOI] [PMC free article] [PubMed] [Google Scholar]
- 58. Rube DA, van der Bliek AM. Mitochondrial morphology is dynamic and varied. Mol Cell Biochem 2004; 256–257: 331–339 [DOI] [PubMed] [Google Scholar]
- 59. Weber TA, Reichert AS. Impaired quality control of mitochondria: aging from a new perspective. Exp Gerontol 2010; 45: 503–511 [DOI] [PubMed] [Google Scholar]
- 60. Romanello V, Sandri M. Mitochondrial biogenesis and fragmentation as regulators of protein degradation in striated muscles. J Mol Cell Cardiol. 2012.10.1016/j.yjmcc.2012.08.001 [DOI] [PubMed] [Google Scholar]
- 61. Westermann B. Bioenergetic role of mitochondrial fusion and fission. Biochim Biophys Acta 2012; 1817: 1833–1838 [DOI] [PubMed] [Google Scholar]