

Abstract
Study Objectives:
To examine neural correlates of working memory performance in patients with primary insomnia (PIs) compared with well-matched good sleepers (GSs).
Design:
Twenty-five PIs and 25 GSs underwent functional MRI while performing an N-back working memory task.
Setting:
VA hospital sleep laboratory and University-based functional imaging center.
Patients or Participants:
25 PIs, 25 GSs.
Interventions:
N/A.
Measurements and Results:
Although PIs did not differ from GSs in cognitive performance, PIs showed the expected differences from GSs in both self-reported and objective sleep measures. PIs, relative to GSs, showed reduced activation of task-related working memory regions. This manifested both as an overall reduction in activation of task-related regions and specifically as reduced modulation of right dorsolateral prefrontal cortex with increasing task difficulty. Similarly, PIs showed reduced modulation (i.e., reduced deactivation) of default mode regions with increasing task difficulty, relative to GSs. However, PIs showed intact performance.
Conclusions:
These data establish a profile of abnormal neural function in primary insomnia, reflected both in reduced engagement of task-appropriate brain regions and an inability to modulate task-irrelevant (i.e., default mode) brain areas during working memory performance. These data have implications for better understanding the neuropathophysiology of the well established, yet little understood, discrepancy between ubiquitous subjective cognitive complaints in primary insomnia and the rarely found objective deficits during testing.
Citation:
Drummond SPA; Walker M; Almklov E; Campos M; Anderson DE; Straus LD. Neural correlates of working memory performance in primary insomnia. SLEEP 2013;36(9):1307-1316.
Keywords: Default mode, functional MRI, insomnia, N-back, sleep, working memory
INTRODUCTION
Approximately 5-35% of the population report sleep disturbance problems at some point in their lives1–3 and approximately 10-15% suffer from persistent insomnia.4 Insomnia is associated with diminished quality of life,5,6 reduced work productivity,7 and increased absenteeism8; it increases vulnerability for medical disorders,8,9 psychiatric disorders,10,11 and accidents and injuries12; and is associated with increased health care utilization13,14 and decreased subjective physical and mental health.2 In addition, patients with insomnia often complain of impaired concentration, memory, and ability to accomplish daily tasks. These complaints worsen as their sleep problems increase in severity.4
Given the ubiquitous nature of daytime complaints in this population, one would expect substantial literature supporting the notion that patients with insomnia experience significant objectively measured cognitive deficits. However, data to support this concept are surprisingly sparse. Studies investigating daytime performance in patients with insomnia have focused on three main areas of performance: attention, learning, and working memory. Overall, evidence to date for overt cognitive impairment in insomnia patients is equivocal.15 Patients with insomnia exhibit slightly slower reaction times, may show more attention lapses, often show impaired declarative memory, typically (though not always) show intact working memory, and may show greater deficits on more complex versions of tasks.15–19 These findings suggest patients with insomnia may show differential vulnerability depending on the specific cognitive process examined and/ or the difficulty level of the task. However, objective cognitive performance deficits in insomnia seem to be subtle and remain in stark contrast to the level of subjective complaint about cognition in primary insomnia (PI).
The failure to find clear patterns of cognitive impairment may be due to the following factors: (1) patients have an exaggerated sense of their impairment; (2) typical cognitive tests are too insensitive to find differences; and/or (3) there are alterations in the neural substrates of cognitive performance in insomnia, and these alterations relate to the discrepancy between subjective and objective performance.15 This latter hypothesis is supported by the single functional magnetic resonance imaging (MRI) study to assess cognition in insomnia,20 as well as indirectly supported by other functional21 or structural22–24 MRI studies published dealing with insomnia, each of which reports abnormalities in insomnia relative to healthy sleepers. For example, in the one study to date using functional MRI to examine cognitive performance in insomnia, Altena et al.20 studied 21 patients with chronic insomnia and 12 normal control patients during performance of two verbal fluency tasks. On each task, patients with insomnia showed decreased cerebral responses in left inferior frontal regions typically associated with language tasks and left prefrontal regions associated with executive control. Performance was measured only indirectly (self-report of number of words generated) in that study, though no group differences were found.
Here, we seek to extend the literature by using functional MRI to examine another fundamental capacity of human cognition, working memory. Given the suggestion in the literature that patients with insomnia may be particularly vulnerable to more complex tasks, we chose an N-back task with multiple levels of difficulty. Our behavioral hypothesis was patients with insomnia would show intact performance on N-back tasks. Given the dearth of insomnia studies using functional MRI to measure cognition, functional MRI hypotheses were also informed by studies on obstructive sleep apnea, and to a lesser extent, acute sleep deprivation. Here, we hypothesized that patients with insomnia would show increased activation on N-back tasks (consistent with a compensatory response to maintain performance), and this would be most prominent on the hardest version of the task.
METHODS
Patients
Patients were recruited from advertisements on Craigslist, fliers posted on local college campuses and within the community, and word of mouth. A total of 63 individuals signed informed consent for the study. Of these, six never started the study (all were potential patients with primary insomnia (PIs) who did not meet eligibility criteria during the intake interview after signing consent), and eight withdrew before completion (reasons included anxiety during MRI, sleep study revealed occult sleep disorder, and positive drug test). A total of 50 patients (25 with insomnia and 25 control patients) provided data for this report. Demographics for each group are presented in Table 1.
Table 1.
Demographics
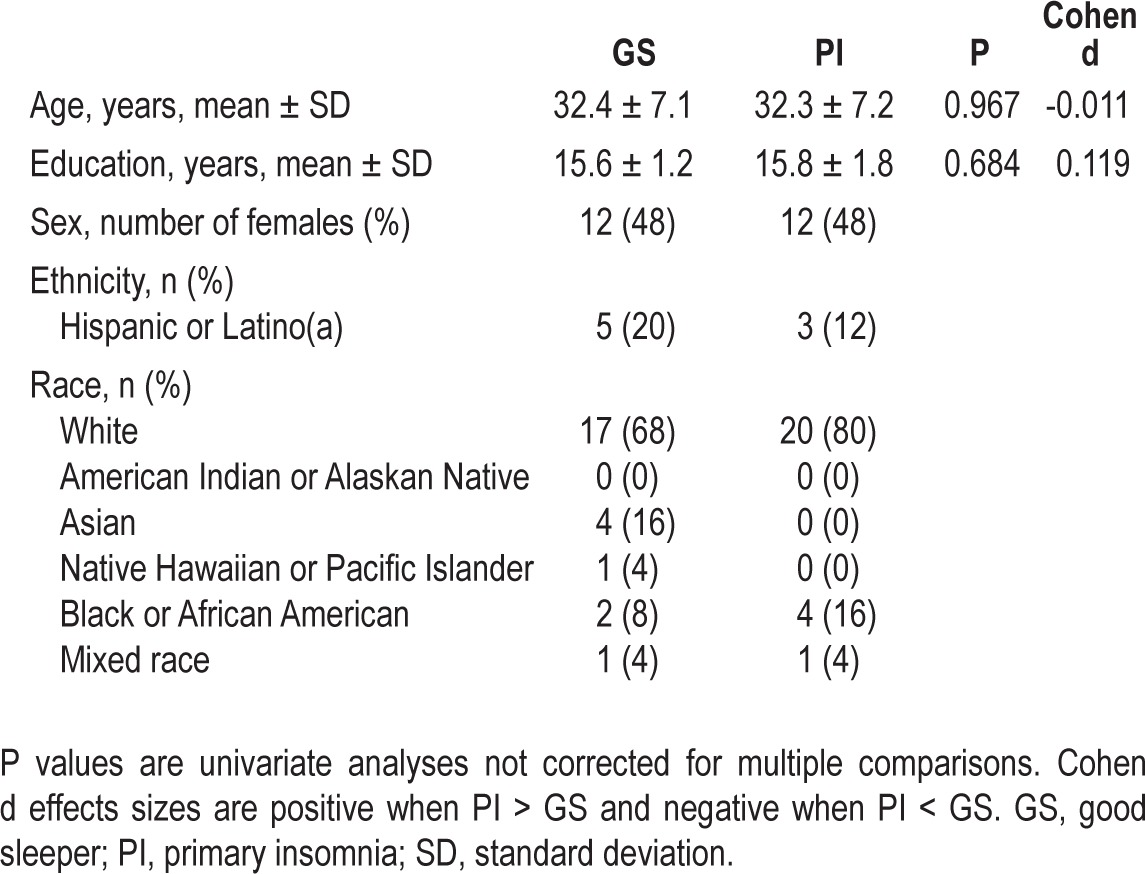
To be eligible, all patients needed to meet the following criteria: (1) have a stable sleep/wake schedule with a preferred sleep phase between 22:00 and 08:00; (2) be right handed; (3) be 25 to 50 y old; (4) not meet criteria for any Axis I disorder other than insomnia or a specific phobia and have no personal history of any Axis I disorder other than a single major depressive episode or a specific phobia; and (5) not be taking any over-the-counter sleep medication or psychotropic medication. Handedness was controlled due to potential hemispheric differences on imaging measures. Age range was restricted to minimize circadian rhythm influences on the diagnoses of PI, increase our ability to recruit a medically healthy sample, and reduce aging effects in the functional MRI measures. Patients with insomnia had to meet criteria for PI as assessed with Duke Structured Interview for Sleep Disorders, including sleep difficulties ≥ 3 nights/week for ≥ 3 months. They also had to report the following averages on 1 week of sleep diaries (see following paragraphs): ≥ 45 min total time awake after lights out (i.e., sleep latency + wake after sleep onset), and either < 6 h total sleep time or sleep efficiency < 80%. Good sleepers (GSs) had to report (in interview and on sleep diaries) 7-9 h total sleep time per night, an average sleep efficiency ≥ 90%, taking fewer than one daytime nap per week, and having no daytime performance complaints. GSs were matched one-to-one with PIs on age (± 3 y), sex, and education (± 3 y).
Procedures
Following consent, patients were (1) screened for eligibility criteria listed previously; (2) completed a series of selfreport measures assessing sleep, depression, and fatigue (these measures allowed us to better characterize and differentiate the two samples, and provided further documentation the PIs did not have comorbid depression); and (3) completed sleep diaries and wore an actigraph for 7-10 days. PI and GS status was based on interview and sleep diaries. Patients then underwent two consecutive nights of polysomnography (PSG). The first night served as an adaptation night and screen for unreported sleep disorders. Twelve hours after waking from the second night in the laboratory, patients underwent a functional MRI scanning session where they completed the N-back task. Practice effects were controlled by having patients take separate, matched versions of the task prior to sleep on night 2. Prior pilot studies indicated patients needed two administrations of the N-back task to reach asymptotic performance. Patients refrained from intake of stimulants and alcohol for 72 h prior to the functional MRI session (except for small habitual quantities of caffeine in the morning, if appropriate).
Cognitive Task
The N-back design stresses maintenance and updating of verbal information in working memory. The task is commonly used in cognitive neuroscience studies and activates a reliably replicated set of working memory brain regions.25 Although it has been used in studies of sleep deprivation26,27 and sleep apnea,28–30 this is the first report to use the task in PI. The participant saw a series of letters on the screen, one at a time, and had to determine if the letter currently displayed was the same as the one presented n-letters ago. There were four levels of difficulty in the task: 0-back, 1-back, 2-back, and 3-back. Conditions were presented in blocks, with each block containing only one N-back condition (e.g., all 1-backs). The task alternated in a pseudo-random order through four repetitions of each block type. Participants responded via a button press whenever they saw a target. For the 0-back condition, the letter “X” was the target. For the 1-, 2-, and 3-back conditions, the target was a letter that is a repeat of the letter one, two, or three letters ago, respectively. The task began with direction reminders lasting 7.5 sec. Each block began with a 2.5-sec prompt to identify the condition and then presented 11 letters, three of which were targets. Letters were presented in the middle of a projector screen for 1 sec followed by an asterisk for 1.5 sec. Targets were placed randomly throughout the sequence (with the exception that the initial stimuli, by definition, could not be targets, since nothing preceded them). The task lasted 8 min, 7.5 sec.
Scanning Procedures
Functional MRI scans were acquired at the UCSD Center for Functional Magnetic Resonance Imaging using a GE Signa EXCITE 3.0T whole-body imaging system. Sessions were scheduled 12 h after habitual wake time for each patient. Each scan session contained three primary scans: a field map, an anatomical image of the brain, and a set of functional images acquired during performance of N-back. Anatomical scans used a T1-weighted fast spoiled gradient echo (FSPGR) pulse sequence (echo time (TE) = 4 ms, flip angle = 90°, 1 mm3 resolution). The functional scans were sensitive to the T2*-weighted blood oxygenation level dependent (BOLD) signal, and 192 gradient echo, echo planar images were collected across 32 4-mm axial slices covering the whole brain (repetition time = 2,500 ms, TE = 30 ms, image matrix = 64 × 64, 4 × 4 × 4 mm resolution).
Postscan Questionnaires
Immediately after each cognitive task, patients completed a computerized questionnaire containing the Karolinska Sleepiness Scale (KSS) and a series of 10-point Likert scales asking about motivation to perform well, ability to concentrate, amount of effort required to perform the task, and perceived task difficulty. After the scan, patients were taken to a quiet room and asked to provide information on strategies and perceptions regarding their performance (100-mm VAS rating subjective sense of accuracy on each N-back condition from zero to 100%).
Sleep Data Processing
Actigraphy was scored using the bedtime and rise times reported by the patients as the boundaries of the rest interval. This was done rather than using the automatic scoring algorithm because the automatic selection of a rest interval can miss long sleep latency periods or times after the final awakening that the individual remains in bed, both common issues in PI. By matching the actigraphy rest interval to the diaries, we were able to better examine sleep within the total time in bed reported by the patients. Because of missing data, the sample size for actigraphy included 21 PIs and 24 GSs. PSG data were scored according to American Academy of Sleep Medicine procedures.
Functional MRI Data Processing
Individual functional MRI data were corrected for distortions using field maps and motion corrected by coregistering to a base image. Time series analyses applied a general linear model to the data containing parameters for the constant, linear drift, three -motion parameters, and the reference functions convolved with an idealized hemodynamic response function to account for the time course of the BOLD signal.31 Reference functions were vectors representing 1-, 2-, and 3-back blocks, respectively. 0-back blocks served as the common baseline.
Analyses
Sleep, Self-Report, and Cognitive Data
Data from sleep diaries were averaged over the 7 days prior to the first night in the sleep laboratory. Sleep diary data were analyzed with a multivariate analysis of variance (MANOVA) to examine group differences, as the diary variables were expected to correlate with one another. Planned follow-up for a significant omnibus (assessed with Wilks Lambda) included individual univariate analyses for each variable. Similar MANOVAs were conducted for self-report question-naires, actigraphy, PSG sleep continuity data, and PSG sleep architecture data. For the cognitive performance data, a group × difficulty analysis of variance (ANOVA) was conducted to parallel the functional MRI analyses (see next paragraphs). The omnibus was evaluated with the Greenhouse-Geisser correction for sphericity violations. Significant interactions were followed up by testing the effect of difficulty within each group.
Functional MRI Data
Two sets of group analyses were conducted. First, a group × difficulty ANOVA was conducted to test whether PIs showed a different cerebral response to increasing difficulty relative to GSs. For any region where the interaction term was significant, the follow-up consisted of examining the difficulty effect for each group. We also examined the main effect of group.
As a check on the internal validity of the N-back task, we also examined the main effect of difficulty in each group separately in an effort to ensure our modulation of task load produced the expected modulation of brain activation25 and that areas showing a group × difficulty interaction generally overlapped with those typically modulated by changing load in healthy sleepers. Second, a group × performance multiple regression examined whether PIs used a different set of brain regions, relative to GSs, to obtain good performance. Based on pilot data in PIs, we restricted the analysis to the most difficult (i.e., 3-back) condition.32,33 Significant interactions were followed by examining performance effects in each group separately. For all functional MRI analyses, we used a search region approach.34–36 This involves restricting the analysis to a set of brain regions known to be related to the task of interest. In this case, we chose the set of regions based on the meta-analysis of N-back tasks from functional MRI studies conducted by Owen et al.25 and supplemented those regions with areas identified in more recent studies using the N-back in either sleep deprivation26,27 or sleep apnea samples.28–30 Specific areas included in the search region included: bilateral inferior, middle, and superior frontal gyri, medial frontal gyrus, the entire cingulate gyrus, bilateral and medial superior parietal lobe, bilateral inferior parietal lobe, bilateral cerebellum, and bilateral thalamus. We identified clusters of activation as areas containing at least 11 contiguous voxels (704 mm3), each activated at the P = 0.05 level, resulting in an overall whole-brain alpha level of 0.001.37 As a post hoc analysis, postscan questionnaire data were correlated with BOLD signal data from the significant clusters found in the group × difficulty ANOVA using bivariate correlations. Due to missing data related specifically to subjective perceptions of performance, sample size for those analyses included 20 PIs and 24 GSs. We also examined the bivariate correlations among the clusters from the group × difficulty ANOVA in a post hoc analysis.
RESULTS
Sleep Data
Sleep Diaries
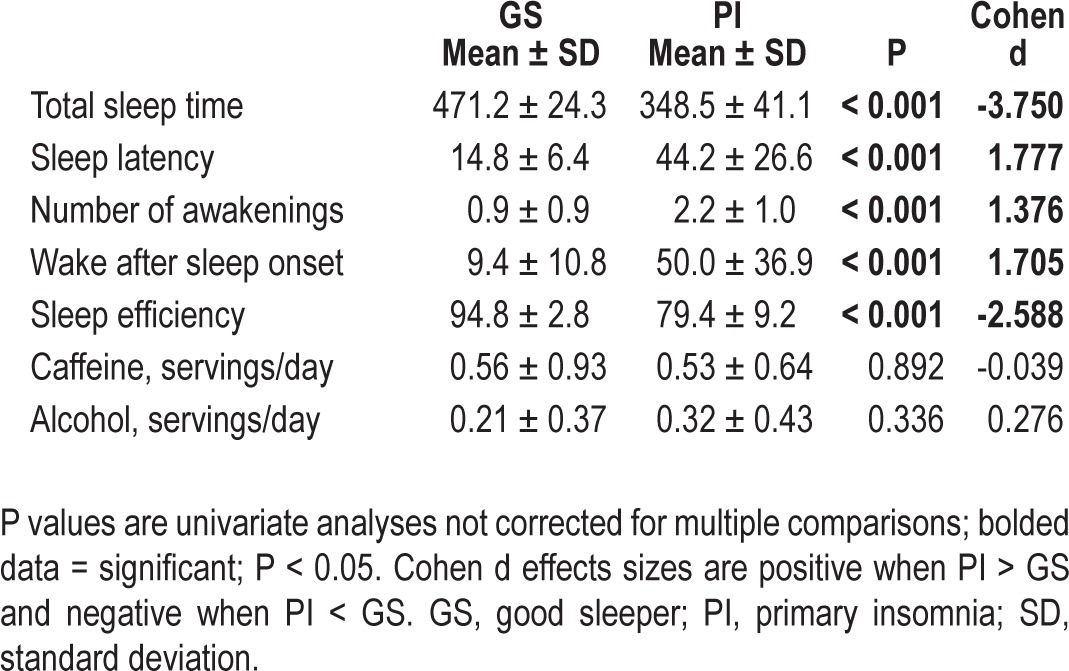
The omnibus MANOVA was significant [F(9,40) = 24.35, P < 0.001, partial eta2 = 0.846]. In addition, all diary variables showed a significant difference between groups in the expected direction. All diary measures were within the clinical range for the PIs. This information is presented in Table 2.
Table 2.
Sleep diaries (average of 1 week)
Actigraphy
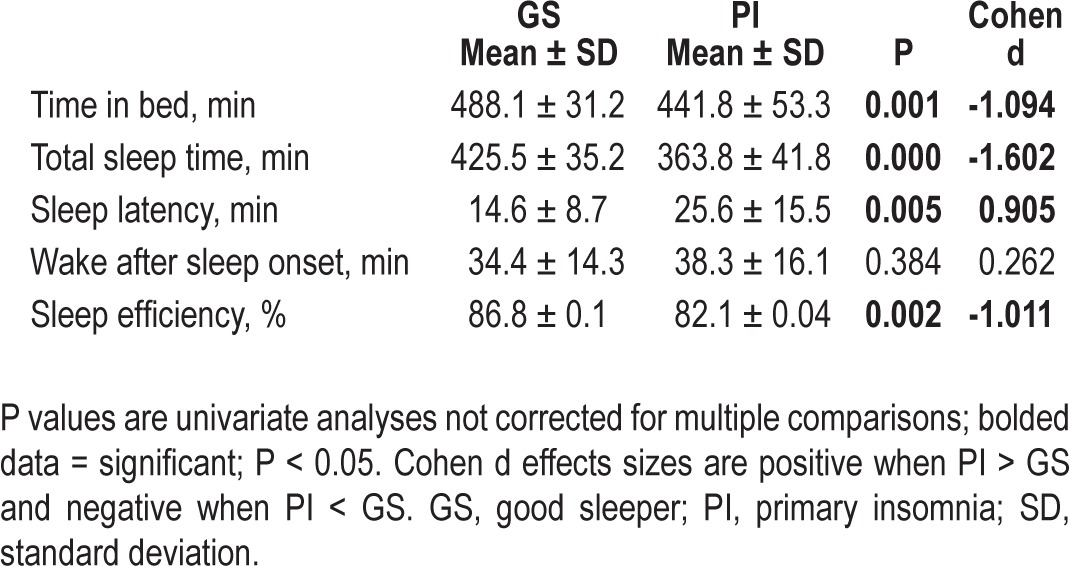
The omnibus MANOVA was significant [F(5,39) = 6.59, P < 0.001, partial eta2 = 0.458]. In addition, all actigraphy variables showed a significant difference between groups in the expected direction, except wake after sleep onset (which was nonsignificant) and time in bed (PI < GS). Generally, actigraphically measured sleep was not as impaired in PIs as diary-measured sleep, though all variables except sleep latency were still in the clinical range for PIs. This information is presented in Table 3.
Table 3.
Actigraphy (average of 1 week)
Polysomnography
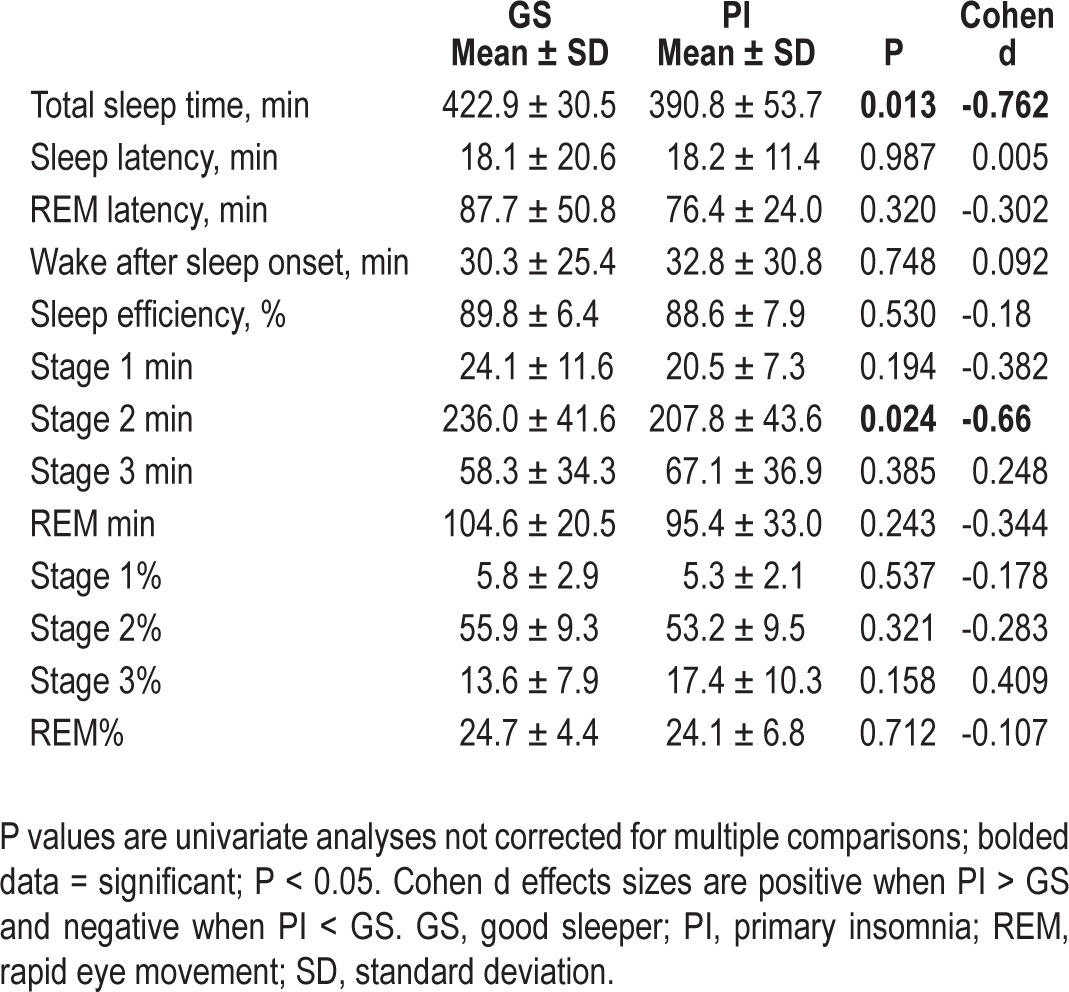
The omnibus MANOVA for sleep architecture variables was not significant [F(7,42) = 1.53, P = 0.183, partial eta2 = 0.203]. The omnibus MANOVA for sleep continuity variables was also not significant [F(5,44) = 1.77, P = 0.140, partial eta2 = 0.167]. This information is presented in Table 4.
Table 4.
Polysomnography (1 night)
Self-Report Measures
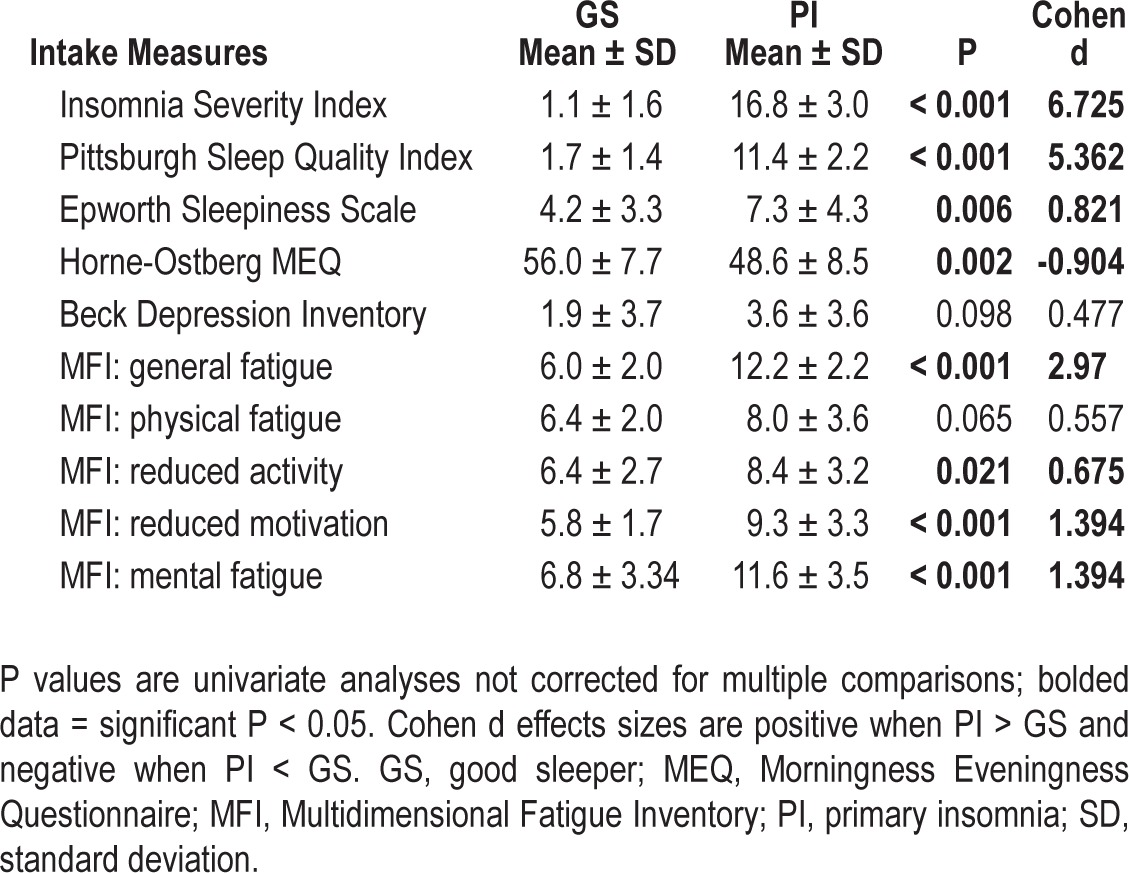
The omnibus MANOVA was significant [F(10,39) = 67.02, P < 0.001, partial eta2 = 0.945]. All self-report measures showed a significant difference between groups, except the Beck Depression Inventory and the physical fatigue subscale from the Multidimensional Fatigue Inventory (MFI). PIs reported insomnia severity in the moderate range on the Insomnia Severity Index, clinically impaired sleep on the Pittsburgh Sleep Quality Index, greater sleepiness (although not above the clinical cutoff) than GSs, more evening tendencies on the Horne-Ostberg Morningness Eveningness Questionnaire (though both groups were in the “neither morningness nor eveningness” category), and greater fatigue on all MFI subscales other than physical. This information is presented in Table 5.
Table 5.
Self-report measures
Cognitive Task Data
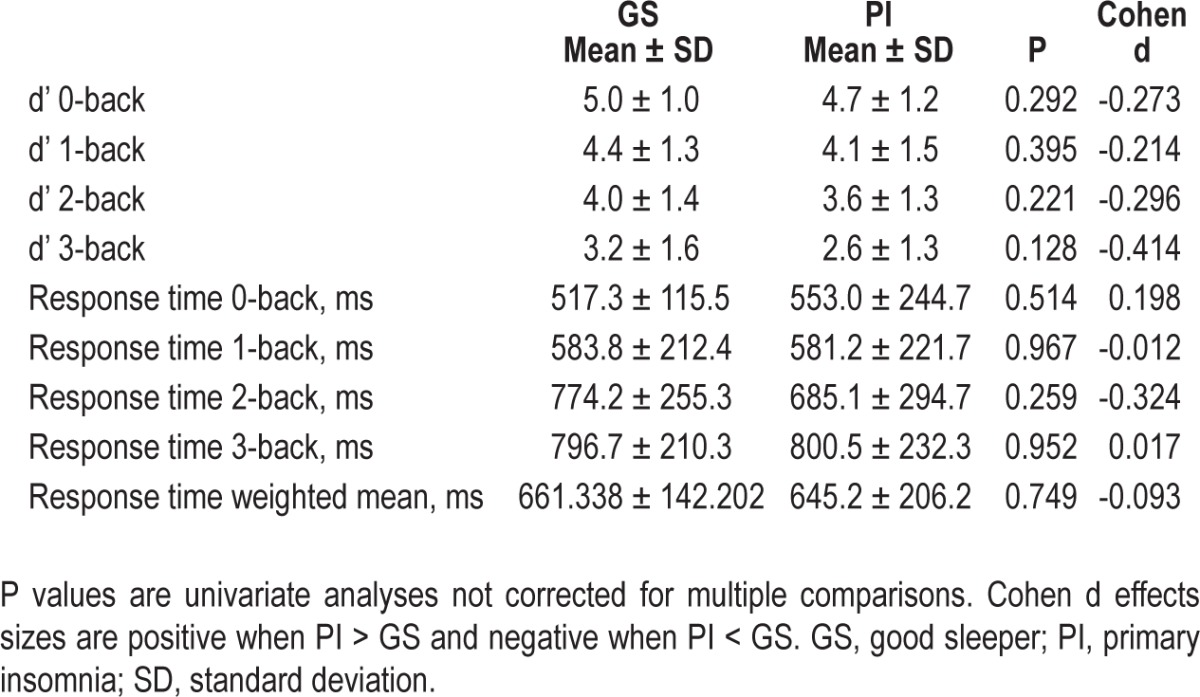
The group × difficulty interaction for accuracy on N-back was nonsignificant [F(2,96) = 0.389, P = 0.608, partial eta2 = 0.008] and there was also no main effect of Group [F(1,48) = 1.50, P = 0.227, partial eta2 = 0.030]. Similar results were found for response time interaction [F(2,96) = 1.19, P = 0.309, partial eta2 = 0.024] and main effect of group [F(1,48) = 0.278, P = 0.600, partial eta2 = 0.006]. 0-back was not evaluated as part of the previously mentioned MANOVAs in an effort to keep these analyses parallel with the imaging analyses. When examining 0-back separately, there was no group effect for either accuracy or response time. This information is presented in Table 6.
Table 6.
Cognitive performance measures
Functional MRI Data
The main effect of modulating task difficulty for each group is shown in Figure 1. The group × difficulty interaction produced five significant clusters (Table 7, Figure 2). In two right middle frontal gyrus clusters (MFG, BA46 and BA9), GSs showed increasing activation with increasing task difficulty, suggesting greater reliance on these working memory regions as the task became harder. In contrast, for three midline regions (orbital frontal gyus BA11, pregenual cingulate gyrus BA32, and posterior cingulate BA23), GSs showed greater deactivation as the task became harder. Unlike the GSs, PIs showed no modulation of these regions with increasing task difficulty. Several brain regions associated with the frontoparietal working memory network, premotor areas, visual processing regions, and the thalamus showed a significant main effect of group (Table 7, Figure 3). In all of these, GSs showed greater activation than PIs. For more than half of these regions, activation was not significantly different from zero in PIs, suggesting areas typically engaged during task performance were not engaged by PIs.
Figure 1.
Brain regions showing a significant main effect of task difficulty within each group. (A) Good sleepers. (B) Primary insomnia.
Table 7.
Significant brain regions in N-back group × difficulty analysis
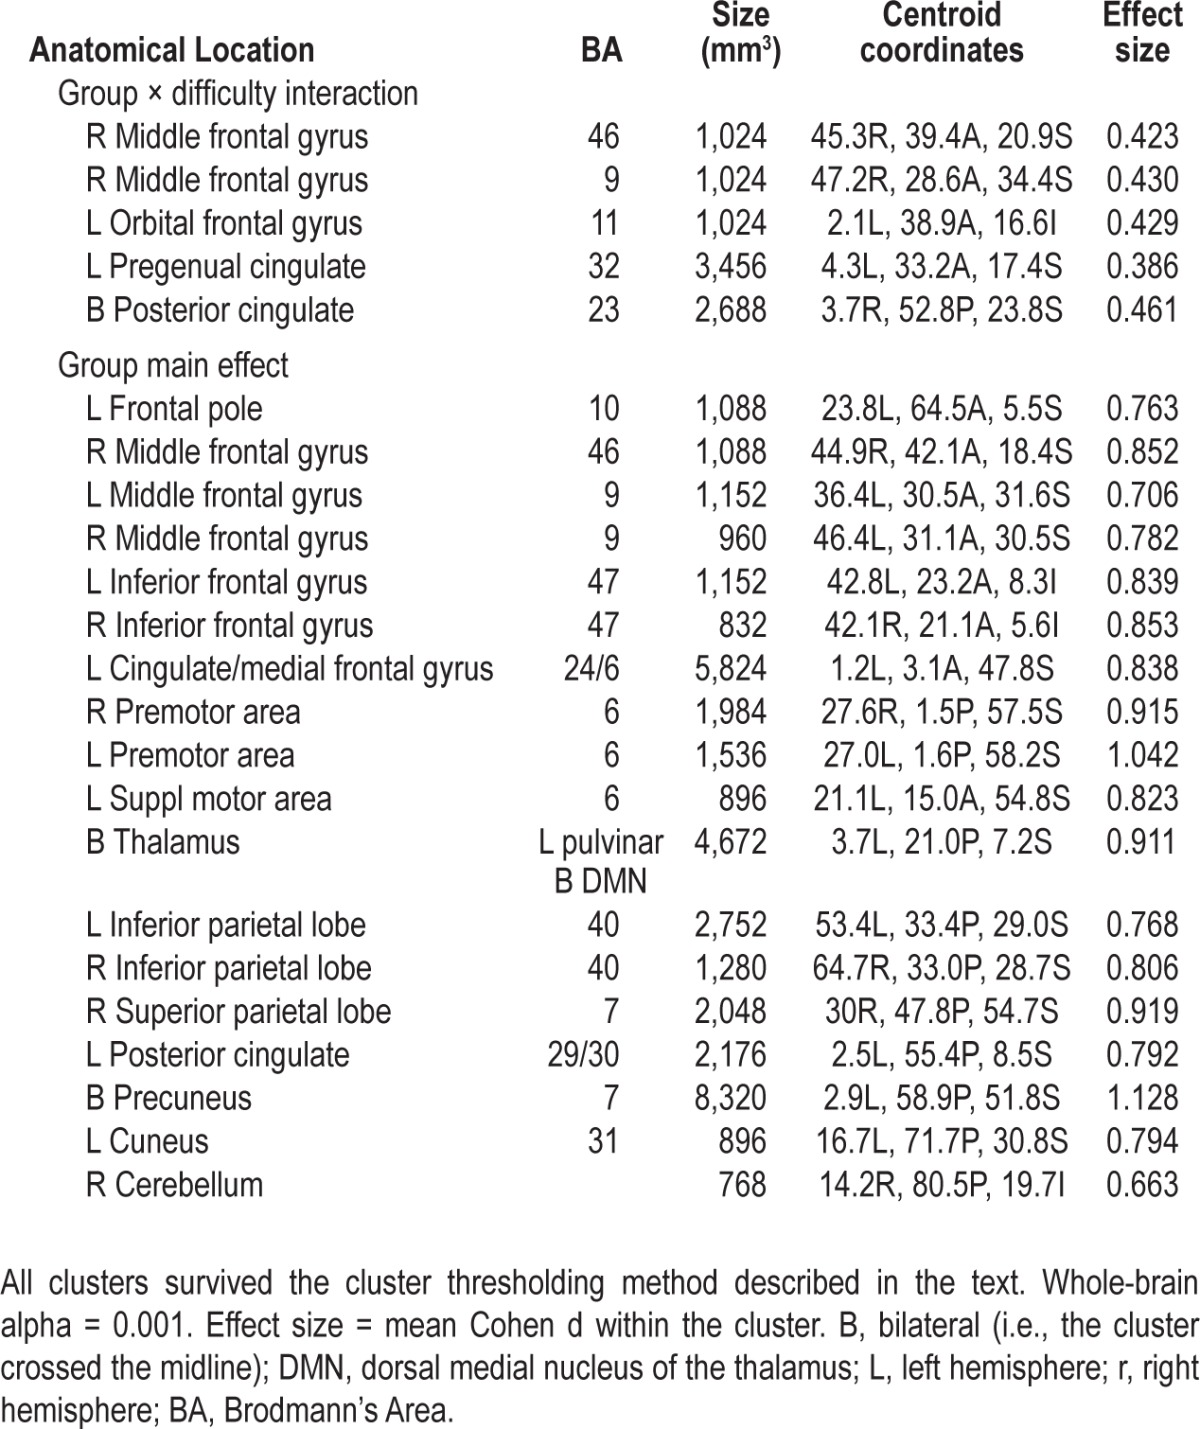
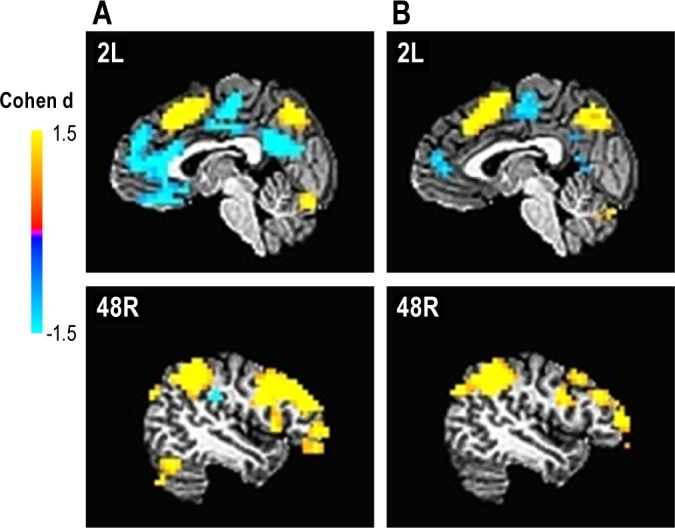
Figure 2.

Brain regions showing significant group × difficulty interaction for N-back. (A) Functional magnetic resonance images of five clusters showing a significant interaction; 1. L OFG BA11; 2. Pregenual cingulate gyrus BA32; 3. B Posterior cingulate cortex BA23; 4. R MFG BA46; 5. R MFG BA9. (B and C) Parameter estimates for clusters. (B) Regions with significantly greater deactivation in GSs as the task became harder with no significant task-related modulation in PIs. (C) Regions with significantly increasing activation in GSs as the task became harder with no significant task-related modulation in PIs. GS, good sleeper; PI, primary insomnia. Error bars indicate standard deviation.
Figure 3.
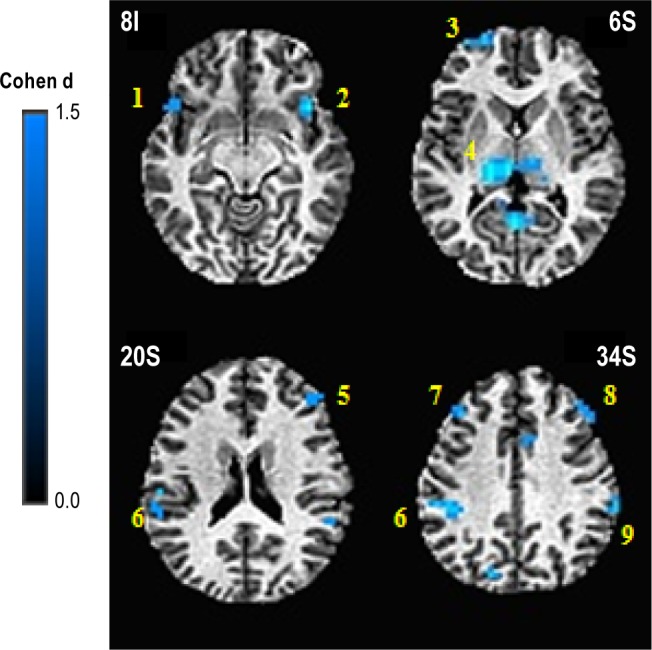
Brain regions showing significant main effect of group for N-back. 1. L IFG BA47; 2. R IFG BA47; 3. L Frontal Pole; 4. B Thalamus; 5. R MFG BA46; 6. L IPL BA40; 7. LMFG BA9; 8. R MFG BA9; 9. R IPL BA40. All regions showed greater activation in response to N-back demands in good sleepers, relative to primary insomnia.
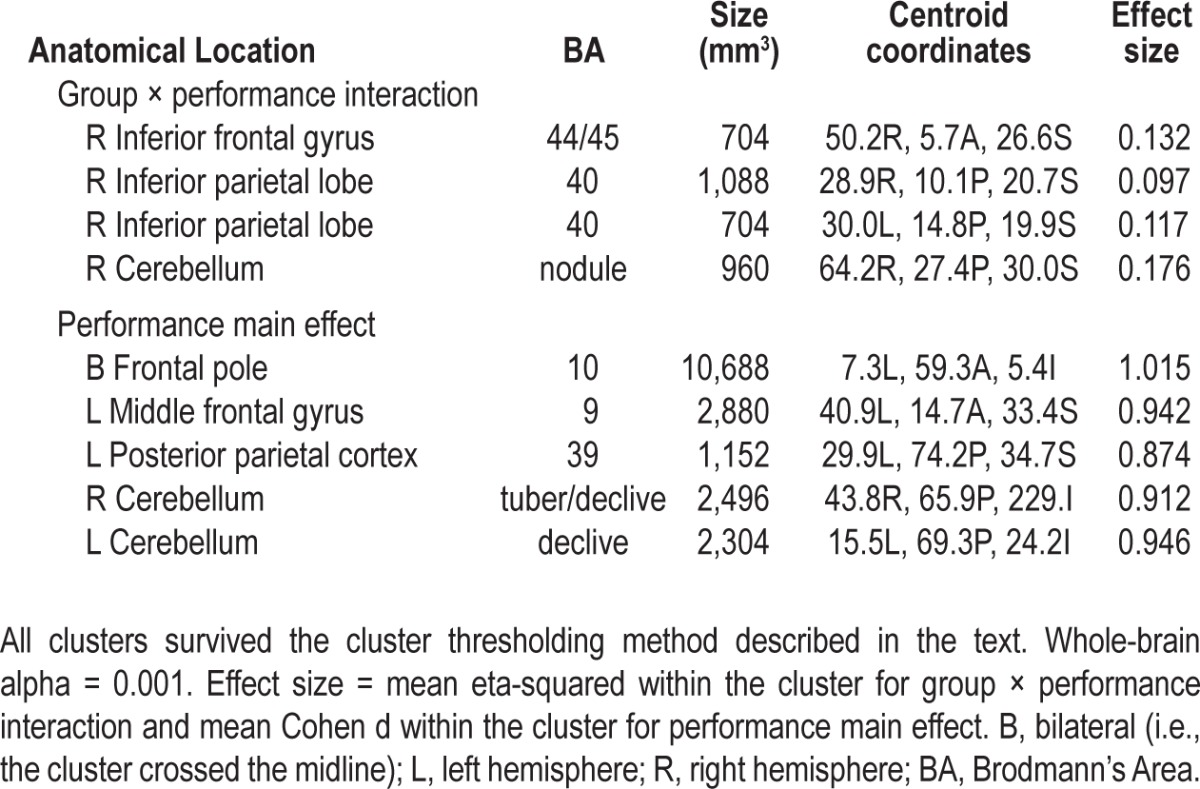
The group × performance analysis revealed four brain regions showing a significant interaction, one of which did not have a significant relationship with performance in either group on follow-up and will not be discussed further. The other three regions (right inferior frontal gyrus (IFG) BA44/45, right inferior parietal lobe (IPL) BA40, and right cerebellum) each showed a positive relationship between cerebral activation and 3-back performance in GSs and no significant relationship with performance in PIs. Five clusters showed a significant main effect of performance in this analysis, with increasing activation associated with better performance, regardless of group membership (Table 8).
Table 8.
Significant brain regions in N-back group × performance analysis
Intercluster Correlations
Within the PIs, there were several significant positive correlations, and no negative correlations, between the two task-related clusters and the three default mode clusters from the group × difficulty analysis: (1) middle frontal gyrus BA9 with orbital frontal gyrus for 1-back (r = 0.550, P = 0.004); (2) middle frontal gyrus BA9 with posterior cingulate for 2-back (r = 0.537, P = 0.006); (3) middle frontal gyrus BA46 with posterior cingulate for 2-back (r = 0.410, P = 0.042); and (4) middle frontal gyrus BA46 with posterior cingulate (r = 0.463, P = 0.020) for 3-back.
Postscan Questionnaires
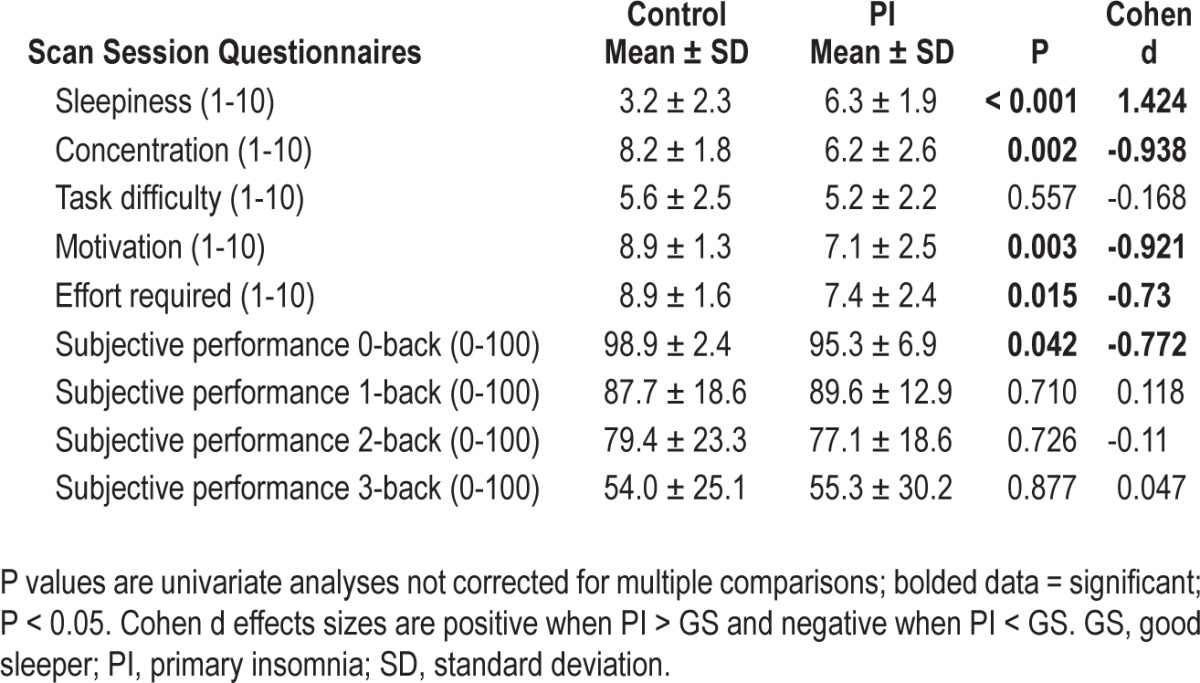
The omnibus MANOVA for self-report measures was significant [F(5,44) = 6.212, P < 0.001, partial eta2 = 0.414]. PIs reported greater levels of sleepiness and lower levels of motivation, concentration, and effort required compared with GSs. There was no difference for subjective task difficulty (Table 9). Self-reported concentration during task performance correlated significantly with BOLD signal in pregenual cingulate for 1-back (r = -0.469, P = 0.018) and 2-back (r = -0.438, P = 0.028) for PIs, and for 1-back (r = -0.417, P = 0.038) in GSs. For PIs, self-report sleepiness during task performance also correlated significantly with BOLD signal in pregenual cingulate for 1-back (r = 0.552, P = 0.004), 2-back (r = 0.410, P = 0.042), and 3-back (r = 0.415, P = 0.039). For GSs, self-report sleepiness did not correlate with any brain region. The omnibus MANOVA for subjective perceptions of performance was not significant [F(4,37) = 1.74, P = 0.162, partial eta2 = 0.158]; information presented in Table 9. Self-reported performance on 1-back correlated significantly with activation during 1-back within each of the default mode clusters in the group × difficulty analysis: orbital frontal gryus (r = -0.490, P = 0.028), posterior cingulate 1-back (r = -0.501, P = 0.024), pregenual cingulate 1-back (r = -0.538, P = 0.014). Self-reported performance on the 3-back also correlated with activation during 3-back in pregenual cingulate (r = -0.634, P = 0.003).
Table 9.
Postscan questionnaires
DISCUSSION
This is the largest study to date examining cerebral activation with functional MRI during cognitive performance in PIs, relative to well-matched GSs, and the first to characterize functional MRI differences in working memory in PI. We examined 25 young to middle-aged PIs and 25 GSs, matched one-to-one for age, sex, and level of education. Our overall aim was to compare the two groups on both performance and cerebral activation during a N-back working memory task with multiple levels of difficulty (allowing evaluation of whether PIs responded differently to increasing cognitive loads). Furthermore, we analyzed the relationship between performance and cerebral responses to examine if the better-performing PIs used the same brain regions as better-performing GSs, or whether they would require recruitment of additional or different brain regions to achieve optimal performance. Our hypotheses were that PIs would show intact performance relative to GSs, and this would be associated with increased cerebral responses representing compensatory activation. These behavioral hypotheses were supported, as PIs showed equivalent performance to GSs on all measures and all levels of difficulty for the N-back. The functional MRI hypotheses, however, were not supported.
Indeed, all of the brain regions showing a significant main effect of group during N-back performance showed diminished activation in PIs, compared with GSs (Table 7, Figure 3). These regions included widespread areas within the frontoparietal working memory network, motor and visual processing regions, thalamus (nuclei with connections to cortical working memory regions), and cerebellum. These are the brain regions most commonly reported in studies of verbal N-back tasks.25 Examining each group separately, GSs showed significantly positive activation within all but two areas showing a group main effect. In contrast, PIs only showed significantly positive activation in four of these areas (bilateral premotor cortex, bilateral MFG BA9). The other areas either showed no significant activation (10 of 18 areas) or a significant negative activation (4 of 18 areas). Thus, it appears PIs did not engage many regions of the brain typically used during performance of this working memory task, and did not activate any other areas to compensate for not activating the typical network.
In addition to not activating regions typically activated during performance of the N-back task, PIs did not show the modulation of acti-vation with increasing task difficulty one would expect and that GSs showed here (Figures 1 and 2). Specifically, GSs showed increased cerebral responses in right dorsolateral prefrontal cortex (BA46 and BA9) and classic N-back working memory areas, as the task became more difficult. In contrast, PIs did not show a modulation with task difficulty in these clusters. Similarly, GSs showed greater deactivation in the pregenual cingulate cortex, ventromedial prefrontal cortex, and posterior cingulate as the task became increasingly difficult. In contrast, PIs again failed to show this modulation of activation with task difficulty. Importantly, each of these interaction clusters overlapped entirely with regions showing a main effect of difficulty in GS (Figure 1). Thus, these interactions occurred in brain regions normally modulated by task difficulty.
Of particular interest are the three clusters showing greater deactivation in GS with increasing task difficulty. These brain regions are among those often reported as part of the default mode.38 The default mode is a set of brain regions thought to be generally activated when the brain is not otherwise engaged in task-focused behaviors. As attention is diverted to task- or goal-directed behaviors, disengagement from default mode regions is necessary for optimal goal-directed performance. As would be expected, GSs showed greater disengagement (reflected in greater levels of negative activation) of these regions as the N-back task became harder and greater attention and working memory resources were required. PIs, however, demonstrated an impoverished ability to modulate this network, showing persistent (rather than reduced) activity throughout these default mode regions during task performance. Impaired modulation of default mode network may be caused by either abnormal disengagement of the network during the baseline condition of the task or by abnormal engagement of the network during the active conditions.
An example of the first explanation for impaired default mode modulation in PI may be found in our recent study (Czisch et al.39) comparing a group of “sleep-deprived but alert” patients with those same patients after a normal night of sleep, during performance of an auditory oddball task. The sleep-deprived but alert patients also showed impaired modulation of default mode regions, including areas overlapping those reported here, with intact performance. Data suggested the findings reflected increased effort needed to focus on the task during the baseline condition. This need for increased cognitive resources after sleep deprivation therefore produced a tonic disengagement of the default mode network. That, in turn, affected the relative BOLD signal in such a way as to reduce the normal differences in default mode activation between baseline and active conditions.39 If PIs also required greater sustained cognitive resources to perform the baseline condition of the N-back task, it would also lead to tonic disengagement of default mode regions during baseline and thus less room to exhibit even greater disengagement as the task got harder. That would explain the lack of modulation by task difficulty of default mode network regions for the PIs (Figure 1B). Czisch et al.39 further reported compensatory increases in activation in task-related regions associated with intact performance in their patients Here, activation was positively correlated between default mode and task-related regions in PIs, however, unlike in Czisch et al., this tradeoff was not associated with better performance in PIs and none of these regions showing a group × difficulty effect overlapped with regions showing a group × performance interaction or main-effect performance. This observation is consistent with the idea that less relative disengagement of default mode during active conditions (perhaps due to tonic disengagement during baseline) is associated with greater task-related activation (perhaps representing compensatory activation in those subjects), although the post hoc nature of the analysis makes such a conclusion speculative at this point.
Rather than abnormally high levels of default mode disengagement during the baseline, an alternative hypothesis may be a lack of disengagement during the harder conditions. We have previously reported, in the context of a sustained attention task placing a premium on speed, acute total sleep deprivation reduces the ability to disengage default mode areas during task performance,40 again effectively reducing the normal differences in default mode activation between baseline and active conditions. This hypothesis, as opposed to the earlier one, is supported by the finding showing decreased ability to concentrate and increased sleepiness during the task correlated with greater activation of default mode regions. These subjective responses to default mode intrusions during task performance may, in turn, manifest as the subjective cognitive complaints so common in PI. Indeed, subjectively worse performance also correlated with activation of default mode regions, further supporting this hypothesis.
Finally, we must entertain a more purely physiological explanation for the PI-GS activation differences. In particular, if there are group differences in resting cerebral blood flow (CBF), they could influence the BOLD signal.41–43 Although no studies have examined resting CBF in PIs, Nofzinger et al.44 reported increased glucose metabolism in waking PIs, Huang et al.21 reported resting state functional connectivity data consistent with cerebral hyperarousal in PI, and van der Werf et al.45 reported increased cortical excitability in PI measured with transcranial magnetic stimulation. If such preliminary findings of hyperarousal extend to CBF in PI, and if CBF was increased throughout much or all of the brain in PI, one could potentially find a reduced magnitude in the relative BOLD signal (i.e., both decreased activation of task-related areas and decreased deactivation of default mode network) without necessarily affecting performance. Future studies would benefit from a direct examination of resting-state CBF and/or oxygen metabolism in PI in direct relation to BOLD signal responses during task performance.
Limitations and Future Directions
In summary, a few limitations of this study should be noted. First, we studied only PI. Given the prevalence of insomnia in psychiatric disorders, it would be potentially useful to examine how much variance is accounted for in future neuroimaging studies in psychiatric populations by the psychiatric condition, relative to by insomnia. For example, Neylan et al.23 reported insomnia severity contributed more unique variance to hippocampal volume measurements in veterans with posttraumatic stress disorder than did Clinician Administered PTSD Scale (CAPS) scores. However, it is unclear if that would be the case for any functional neuroimaging measure or even another structural imaging measure. Second, we did not recruit for specific insomnia subtypes, and thus it is unclear if our findings relate to early, middle, and/or late insomnia. Most patients reported both early and middle insomnia, making it impossible to explore this question. Although this finding may actually increase external validity of the study, future research may wish to more specifically examine insomnia subtypes. Third, our patients were, on average, in the moderate severity range according to the ISI. Only three patients scored in the severe insomnia range. Thus, it is not clear if these results would generalize to those with more severe forms of insomnia.
CONCLUSIONS
This study suggests PIs have a reduced ability to engage some task-appropriate brain regions and reduced ability to modulate task-irrelevant (i.e., default mode) brain regions during working memory performance. If either of our potential explanations for this is correct (PIs require greater attention and/or effort during baseline or PIs are unable to disengage from default mode during active conditions), these phenomena may be experienced by PIs as increased cognitive difficulties. Our post hoc analyses support this hypothesis. Moreover, both of these explanations suggest a dysfunction in the attention system in PI that has not been previously identified. Future studies should more directly address hypotheses arising from these data.
DISCLOSURE STATEMENT
This study was funded by an investigator initiated grant from Actelion Pharmaceuticals, Ltd. Dr. Drummond declares grant funding (for this study) and consulting fees from Actelion Pharmaceuticals, Ltd. Dr. Walker declares grant funding (for this study) and consulting fees from Actelion Pharmaceuticals, Ltd. The other authors have indicated no financial conflicts of interest.
ACKNOWLEDGMENTS
The authors thank Lesley Wetherell for her assistance with processing the functional MRI data. The VA San Diego Health-care System's Center for Excellence in Stress and Mental Health provided infrastructure support for this project. Work was performed at the VA San Diego Healthcare System and University of California San Diego, San Diego, CA.
Footnotes
A commentary on this article appears in this issue on page 1273.
REFERENCES
- 1.Ford DE, Kamerow DB. Epidemiologic study of sleep disturbances and psychiatric disorders. An opportunity for prevention? JAMA. 1989;262:1479–84. doi: 10.1001/jama.262.11.1479. [DOI] [PubMed] [Google Scholar]
- 2.Roth T, Coulouvrat C, Hajak G, et al. Prevalence and perceived health associated with insomnia based on DSM-IV-TR; International Statistical Classification of Diseases and Related Health Problems, Tenth Revision; and Research Diagnostic Criteria/International Classification of Sleep Disorders, Second Edition criteria: results from the America Insomnia Survey. Biol Psychiatry. 2011;69:592–600. doi: 10.1016/j.biopsych.2010.10.023. [DOI] [PubMed] [Google Scholar]
- 3.Fernandez-Mendoza J, Vgontzas AN, Bixler EO, et al. Clinical and polysomnographic predictors of the natural history of poor sleep in the general population. Sleep. 2012;35:689–97. doi: 10.5665/sleep.1832. [DOI] [PMC free article] [PubMed] [Google Scholar]
- 4.Ancoli-Israel S, Roth T. Characteristics of insomnia in the United States: results of the 1991 National Sleep Foundation Survey. I. Sleep. 1999;22:S347–53. [PubMed] [Google Scholar]
- 5.Leger D, Morin CM, Uchiyama M, Hakimi Z, Cure S, Walsh JK. Chronic insomnia, quality-of-life, and utility scores: comparison with good sleepers in a cross-sectional international survey. Sleep Med. 2011;13:43–51. doi: 10.1016/j.sleep.2011.03.020. [DOI] [PubMed] [Google Scholar]
- 6.Zammit GK, Weiner J, Damato N, Sillup GP, McMillan CA. Quality of life in people with insomnia. Sleep. 1999;22:S379–85. [PubMed] [Google Scholar]
- 7.Sarsour K, Kalsekar A, Swindle R, Foley K, Walsh JK. The association between insomnia severity and healthcare and productivity costs in a health plan sample. Sleep. 2011;34:443–50. doi: 10.1093/sleep/34.4.443. [DOI] [PMC free article] [PubMed] [Google Scholar]
- 8.Leger D, Guilleminault C, Bader G, Levy E, Paillard M. Medical and socio-professional impact of insomnia. Sleep. 2002;25:625–9. [PubMed] [Google Scholar]
- 9.Chien KL, Chen PC, Hsu HC, et al. Habitual sleep duration and insomnia and the risk of cardiovascular events and all-cause death: report from a community-based cohort. Sleep. 2010;33:177–84. doi: 10.1093/sleep/33.2.177. [DOI] [PMC free article] [PubMed] [Google Scholar]
- 10.Wright KM, Britt TW, Bliese PD, Adler AB, Picchioni D, Moore D. Insomnia as predictor versus outcome of PTSD and depression among Iraq combat veterans. J Clin Psychol. 2011;67:1240–58. doi: 10.1002/jclp.20845. [DOI] [PubMed] [Google Scholar]
- 11.Perlis ML, Giles DE, Buysse DJ, Tu X, Kupfer DJ. Self-reported sleep disturbance as a prodromal symptom in recurrent depression. J Affect Disord. 1997;42:209–12. doi: 10.1016/s0165-0327(96)01411-5. [DOI] [PubMed] [Google Scholar]
- 12.Kessler RC, Berglund PA, Coulouvrat C, et al. Insomnia, comorbidity, and risk of injury among insured Americans: results from the America Insomnia Survey. Sleep. 2012;35:825–34. doi: 10.5665/sleep.1884. [DOI] [PMC free article] [PubMed] [Google Scholar]
- 13.Bramoweth AD, Taylor DJ. Chronic insomnia and health care utilization in young adults. Behav Sleep Med. 2012;10:106–21. doi: 10.1080/15402002.2011.587067. [DOI] [PubMed] [Google Scholar]
- 14.Rosekind MR, Gregory KB. Insomnia risks and costs: health, safety, and quality of life. Am J Manag Care. 2010;16:617–26. [PubMed] [Google Scholar]
- 15.Orff HJ, Drummond SP, Nowakowski S, Perils ML. Discrepancy between subjective symptomatology and objective neuropsychological performance in insomnia. Sleep. 2007;30:1205–11. doi: 10.1093/sleep/30.9.1205. [DOI] [PMC free article] [PubMed] [Google Scholar]
- 16.Vignola A, Lamoureux C, Bastien CH, Morin CM. Effects of chronic insomnia and use of benzodiazepines on daytime performance in older adults. J Gerontol B Psychol Sci Soc Sci. 2000;55:P54–62. doi: 10.1093/geronb/55.1.p54. [DOI] [PubMed] [Google Scholar]
- 17.Hauri PJ. Cognitive deficits in insomnia patients. Acta Neurologica Belgica. 1997;97:113–7. [PubMed] [Google Scholar]
- 18.Edinger JD, Means MK, Carney CE, Krystal AD. Psychomotor performance deficits and their relation to prior nights' sleep among individuals with primary insomnia. Sleep. 2008;31:599–607. doi: 10.1093/sleep/31.5.599. [DOI] [PMC free article] [PubMed] [Google Scholar]
- 19.Fortier-Brochu E, Beaulieu-Bonneau S, Ivers H, Morin CM. Insomnia and daytime cognitive performance: a meta-analysis. Sleep Med Rev. 2011;16:83–94. doi: 10.1016/j.smrv.2011.03.008. [DOI] [PubMed] [Google Scholar]
- 20.Altena E, Van Der Werf YD, Sanz-Arigita EJ, et al. Prefrontal hypoactivation and recovery in insomnia. Sleep. 2008;31:1271–6. [PMC free article] [PubMed] [Google Scholar]
- 21.Huang Z, Liang P, Jia X, et al. Abnormal amygdala connectivity in patients with primary insomnia: evidence from resting state fMRI. Eur J Radiol. 2011;81:1288–95. doi: 10.1016/j.ejrad.2011.03.029. [DOI] [PubMed] [Google Scholar]
- 22.Riemann D, Voderholzer U, Spiegelhalder K, et al. Chronic insomnia and MRI-measured hippocampal volumes: a pilot study. Sleep. 2007;30:955–8. doi: 10.1093/sleep/30.8.955. [DOI] [PMC free article] [PubMed] [Google Scholar]
- 23.Neylan TC, Mueller SG, Wang Z, et al. Insomnia severity is associated with a decreased volume of the CA3/dentate gyrus hippocampal subfield. Biol Psychiatry. 2010;68:494–6. doi: 10.1016/j.biopsych.2010.04.035. [DOI] [PMC free article] [PubMed] [Google Scholar]
- 24.Altena E, Vrenken H, Van Der Werf YD, van den Heuvel OA, Van Someren EJ. Reduced orbitofrontal and parietal gray matter in chronic insomnia: a voxel-based morphometric study. Biol Psychiatry. 2010;67:182–5. doi: 10.1016/j.biopsych.2009.08.003. [DOI] [PubMed] [Google Scholar]
- 25.Owen AM, McMillian KM, Laird AR, Bullmore E. N-back working memory paradigm: a meta-analysis of normative functional neuroimaging studies. Hum Brain Map. 2005;25:46–59. doi: 10.1002/hbm.20131. [DOI] [PMC free article] [PubMed] [Google Scholar]
- 26.Choo WC, Lee WW, Venkatraman V, Sheu FS, Chee MW. Dissociation of cortical regions modulated by both working memory load and sleep deprivation and by sleep deprivation alone. Neuroimage. 2005;25:579–87. doi: 10.1016/j.neuroimage.2004.11.029. [DOI] [PubMed] [Google Scholar]
- 27.Lythe KE, Williams SC, Anderson C, Libri V, Mehta MA. Frontal and parietal activity after sleep deprivation is dependent on task difficulty and can be predicted by the fMRI response after normal sleep. Behav Brain Res. 2012;233:62–70. doi: 10.1016/j.bbr.2012.04.050. [DOI] [PubMed] [Google Scholar]
- 28.Aloia MS, Sweet LH, Jerskey BA, Zimmerman M, Arnedt JT, Millman RP. Treatment effects on brain activity during a working memory task in obstructive sleep apnea. J Sleep Res. 2009:404–10. doi: 10.1111/j.1365-2869.2009.00755.x. [DOI] [PubMed] [Google Scholar]
- 29.Prilipko O, Huynh N, Schwartz S, et al. Task positive and default mode networks during a parametric working memory task in obstructive sleep apnea patients and healthy controls. Sleep. 2011;34:293–301A. doi: 10.1093/sleep/34.3.293. [DOI] [PMC free article] [PubMed] [Google Scholar]
- 30.Sweet LH, Jerskey BA, Aloia MS. Default network response to a working memory challenge after withdrawal of continuous positive airway pressure treatment for obstructive sleep apnea. Brain Imaging Behav. 2010;4:155–63. doi: 10.1007/s11682-010-9095-y. [DOI] [PubMed] [Google Scholar]
- 31.Cohen MS. Parametric analysis of fMRI data using linear systems methods. Neuroimage. 1997;6:93–103. doi: 10.1006/nimg.1997.0278. [DOI] [PubMed] [Google Scholar]
- 32.Orff HJ, Almklov E, Drummond SPA. Association between subjective daytime complaint and BOLD activation in patients with primary insomnia. Sleep. 2010;33:A218. [Google Scholar]
- 33.Anderson D, Almklov E, Orff HJ, Drummond SPA. Insomnia severity level impacts cerebral activation during working memory. Sleep. 2011;34:A190–1. [Google Scholar]
- 34.Ayalon L, Ancoli-Israel S, Drummond SP. Obstructive sleep apnea and age: a double insult to brain function? Am J Respir Crit Care Med. 2010;182:413–9. doi: 10.1164/rccm.200912-1805OC. [DOI] [PMC free article] [PubMed] [Google Scholar]
- 35.Eyler Zorrilla LT, Jeste DV, Paulus M, Brown GG. Functional abnormalities of medial temporal cortex during novel picture learning among patients with chronic schizophrenia. Schizophr Res. 2003;59:187–98. doi: 10.1016/s0920-9964(01)00340-1. [DOI] [PubMed] [Google Scholar]
- 36.Jonelis MB, Drummond SP, Salamat JS, McKenna BS, Ancoli-Israel S, Bondi MW. Age-related influences of prior sleep on brain activation during verbal encoding. Front Neurol. 2012;3:49. doi: 10.3389/fneur.2012.00049. [DOI] [PMC free article] [PubMed] [Google Scholar]
- 37.Forman SD, Cohen JD, Fitzgerald M, Eddy WF, Mintun MA, Noll DC. Improved assessment of significant activation in functional magnetic resonance imaging (fMRI): use of a cluster-size threshold. Magn Reson Med. 1995;33:636–47. doi: 10.1002/mrm.1910330508. [DOI] [PubMed] [Google Scholar]
- 38.Raichle ME, MacLeod AM, Snyder AZ, Powers WJ, Gusnard DA, Shulman GL. A default mode of brain function. Proc Natl Acad Sci U S A. 2001;98:676–82. doi: 10.1073/pnas.98.2.676. [DOI] [PMC free article] [PubMed] [Google Scholar]
- 39.Czisch M, Wehrle R, Harsay H, et al. On the need of objective vigilance monitoring: effects of sleep loss on target detection and task-negative activity using combined EEG/fMRI. Front Neurol. 2012;3:1–12. doi: 10.3389/fneur.2012.00067. [DOI] [PMC free article] [PubMed] [Google Scholar]
- 40.Drummond SPA, Bischoff-Grethe A, Dinges DF, Ayalon L, Mednick SC, Meloy MJ. The neural basis of the psychomotor vigilance task. Sleep. 2005;28:1059–68. [PubMed] [Google Scholar]
- 41.Bandettini PA, Wong EC, Binder JR, et al. Functional MR imaging using BOLD the approach: dynamic characteristics and data analysis methods. In: Le Bihan D, editor. Diffusion and perfusion magnetic resonance imaging. New York: Raven Press, Ltd.; 1995. pp. 335–49. [Google Scholar]
- 42.Ogawa S, Tank DW, Menon R, et al. Intrinsic signal changes accompanying sensory stimulation: Functional brain mapping with magnetic resonance imaging. Proc Natl Acad Sci U S A. 1992;89:5951–5. doi: 10.1073/pnas.89.13.5951. [DOI] [PMC free article] [PubMed] [Google Scholar]
- 43.Brown GG, Eyler Zorrilla LT, Georgy B, Kindermann SS, Wong EC, Buxton RB. BOLD and perfusion response to finger-thumb apposition after acetazolamide administration: differential relationship to global perfusion. J Cereb Blood Flow Metab. 2003;23:829–37. doi: 10.1097/01.WCB.0000071887.63724.B2. [DOI] [PubMed] [Google Scholar]
- 44.Nofzinger E, Buysse DJ, Germain A, Price JC, Miewald JM, Kupfer DJ. Functional neuroimaging evidence for hyperarousal in insomnia. Am J Psychiatry. 2004;161:2126–9. doi: 10.1176/appi.ajp.161.11.2126. [DOI] [PubMed] [Google Scholar]
- 45.van der Werf YD, Altena E, van Dijk KD, et al. Is disturbed intracortical excitability a stable trait of chronic insomnia? A study using transcranial magnetic stimulation before and after multimodal sleep therapy. Biol Psychiatry. 2010;68:950–5. doi: 10.1016/j.biopsych.2010.06.028. [DOI] [PubMed] [Google Scholar]