

Abstract
BACKGROUND & AIMS
Expression of the SAM pointed domain containing ETS transcription factor (SPDEF or prostate-derived ETS factor) is regulated by Atoh1 and is required for the differentiation of goblet and Paneth cells. SPDEF has been reported to suppress the development of breast, prostate, and colon tumors. We analyzed levels of SPDEF in colorectal tumor samples from patients and its tumor-suppressive functions in mouse models of colorectal cancer (CRC).
METHODS
We analyzed levels of SPDEF messenger RNA and protein in more than 500 human CRC samples and more than 80 nontumor controls. Spdef−/− and wild-type mice (controls) were either bred with ApcMin/+ mice, or given azoxymethane (AOM) and dextran sodium sulfate (DSS), or 1,2-dimethylhydrazine and DSS, to induce colorectal tumors. Expression of Spdef also was induced transiently by administration of tetracycline to Spdefdox-intestine mice with established tumors, induced by the combination of AOM and DSS or by breeding with ApcMin/+ mice. Colon tissues were collected and analyzed for tumor number, size, grade, and for cell proliferation and apoptosis. We also analyzed the effects of SPDEF expression in HCT116 and SW480 human CRC cells.
RESULTS
In colorectal tumors from patients, loss of SPDEF was observed in approximately 85% of tumors and correlated with progression from normal tissue, to adenoma, to adenocarcinoma. Spdef−/−; ApcMin/+ mice developed approximately 3-fold more colon tumors than Spdef+/+; ApcMin/+ mice. Likewise, Spdef−/− mice developed approximately 3-fold more colon tumors than Spdef+/+ mice after administration of AOM and DSS. After administration of 1,2-dimethylhydrazine and DSS, invasive carcinomas were observed exclusively in Spdef−/− mice. Conversely, expression of SPDEF was sufficient to promote cell-cycle exit in cells of established adenomas from Spdefdox-intestine; ApcMin/+ mice and in Spdefdox-intestine mice after administration of AOM + DSS. SPDEF inhibited the expression of β-catenin–target genes in mouse colon tumors, and interacted with β-catenin to block its transcriptional activity in CRC cell lines, resulting in lower levels of cyclin D1 and c-MYC.
CONCLUSIONS
SPDEF is a colon tumor suppressor and a candidate therapeutic target for colon adenomas and adenocarcinoma.
Keywords: Notch Signaling, Differentiation Factor, Colon Cancer, Colitis-Associated Cancer
SAM pointed domain containing ETS transcription factor (SPDEF), also known as prostate-derived ETS factor, is a member of the ETS (E26 transformation specific) transcription factor family, which preferentially binds to a GGAT DNA motif rather than the GGAA ETS family consensus sequence.1 SPDEF was first described in prostate where it interacts with Nkx3.1 and androgen receptor to regulate prostate-specific antigen gene expression.1,2 Spdef is expressed in several other organs including airway, breast, gastric, and small and large intestinal epithelia.3 In the intestines, SPDEF drives terminal differentiation and maturation of secretory progenitors into goblet cells.4,5 Furthermore, we reported that ectopic SPDEF expression inhibited cell proliferation, suggesting that SPDEF promotes cell-cycle exit of stem and/or progenitor cells.4
In the intestines, Spdef expression is dependent on the transcription factors Atoh1 and Gfi1, both of which are important in specification of intestinal secretory cells (goblet, Paneth, and enteroendocrine cells).6,7 Spdef expression is regulated negatively by Notch activity, which functions as a gatekeeper of proliferation and differentiation in the intestinal epithelium by regulating expression of Atoh1. In mice, inhibition of Notch signaling with γ-secretase inhibitors induced Spdef expression in the intestine in an Atoh1-dependent manner.8 Similarly, in colon cancer cell lines, SPDEF expression was absent or greatly reduced in cell lines in which ATOH1 was absent or reduced, and induction of SPDEF by γ-secretase inhibitor treatment was dependent on ATOH1.8
Reduced SPDEF expression has been associated with tumor progression and invasive phenotype in breast, ovarian, prostate, and colon cancers.9–13 In these studies, SPDEF target genes such as survivin,14 plasminogen activator, urokinase (uPA),12,14 Slug,14 Maspin,10 and p2112,15 have been identified. However, the studies reported to date were performed either in vitro or obtained from analyzing tumor samples of various stages. Thus, we have focused on the analysis of SPDEF’s role in de novo tumor formation.
In this study, we used both genetic and chemically induced mouse models of colorectal cancer (CRC) to test the hypothesis that SPDEF functions as a tumor suppressor in the intestine, and to evaluate the potential of SPDEF as a therapeutic target for treatment of colorectal cancer. In addition, CRC cell lines were used to identify a novel repressive interaction between SPDEF and β-catenin, which provides a mechanism for SPDEF’s tumor-suppressive activity.
Materials and Methods
Animals, Treatments, and Analysis
Transgenic mouse lines used in this study were generated previously.4,5 Detailed protocols, mouse models, and reagents used are shown in the Supplementary Materials and Methods section. The animal use protocol for this study was approved by the Cincinnati Children’s Hospital Medical Center Institutional Animal Care and Use Committee. Methods for tissue preparation, immunohistologic, histochemical, and RNA in situ hybridization analysis followed our prior methods and are detailed in the Supplementary Materials and Methods section.16,17 Tumor grade from the 1,2-dimethylhydrazine + dextran sodium sulfate (DSS)–treated mice was determined according to a previous publication.18
Cell Culture
For cell culture, colon cancer cell lines HCT116 and SW480 were acquired from American Type Culture Collection (Manassas, VA) and cultured as recommended. Details of transfection, immunocytochemistry, luciferase, immunoblot, and immunoprecipitation are found in the Supplementary Materials and Methods section.
Tissue Microarray Analysis
Colon cancer tissue microarray was obtained from the National Cancer Institute’s Cancer Diagnosis Program and was evaluated by immunohistochemistry according to our previous methods.4
Microarray Analysis
Microarray data analysis data sets used are available in the National Center for Biotechnology Information Gene Expression Omnibus database as accession number GSE5261.19 Details of the analysis are provided in the Supplementary Materials and Methods section.
Results
SPDEF Messenger RNA and Protein Levels Are Silenced in the Majority of Human Colon Tumors
Our previous studies reported that ATOH1 is silenced in most human colon tumors, where it functions as a tumor suppressor.8,16 To identify potential targets of ATOH1 in human CRC, we re-analyzed CRC expression microarray data19 to identify genes whose expression correlated with the pattern of ATOH1 messenger RNA (mRNA) expression. As expected, most CRCs expressed lower levels of ATOH1 mRNA compared with normal colon tissue. We identified 439 gene expression probe sets that significantly matched the ATOH1 expression pattern (Figure 1A). Interestingly, this gene expression signature segregated tumors with mucinous features (mucinous and signet ring carcinomas) from nonmucinous adenocarcinomas. Among this 439-gene ATOH1 syn-expression group, 3 independent probe sets for SPDEF were among the top 10 probes sets that correlated best with ATOH1 expression (Pearson coefficient, 0.784–0.826; Figure 1A, Supplementary Table 1). To confirm these microarray data, we assessed the protein expression levels of SPDEF in human colorectal tumors obtained from the University of Cincinnati. As in mouse intestine, SPDEF was expressed in the goblet cell nuclei of the normal intestinal epithelium (Figure 1B, pink arrows). However, SPDEF expression was lost in neoplastic cells (Figure 1B), confirming the microarray data and suggesting a role for SPDEF as a tumor suppressor in the intestine. To further examine a role for SPDEF in human colon tumorigenesis and progression, we analyzed the National Cancer Institute colon cancer tissue microarray including 404 tumors and 74 nontumor controls for SPDEF expression. We quantified the intensity of SPDEF nuclear staining, and the fraction of nuclei stained (extent), and correlated these parameters with tumor stage, histologic subtype, and clinical outcome. As previously shown, SPDEF was expressed in the nucleus of normal colon tissues (Figure 1D). In adenomas, SPDEF was expressed at lower intensity and extent (Figure 1C and D). Cancer tissues at all stages (I–IV) had significantly less SPDEF expression both in intensity and extent when compared with normal colon or adenomas (Figure 1C and D). However, there was no significant difference in SPDEF expression between tumor grades I–IV (Figure 1C) because most colon cancers had already lost SPDEF expression. Similarly, SPDEF expression was not predictive of clinical outcome (death or recurrence) in colon cancer because most colon cancers had lost SPDEF expression. Of note, some mucinous and signet ring histologic subtypes retained SPDEF expression (Supplementary Figure 1), suggesting alternative molecular mechanisms of tumorigenesis and tumor progression for these rare histologically distinctive colon cancers from the more common type of colon cancer, adenocarcinoma.
Figure 1.

SPDEF is silenced in the majority of human colon cancers. (A) Microarray analysis of human colon tumors. Shown is a heat map of gene expression in 95 human colon cancers normalized to 5 nondiseased colon samples. Pink indicates reduced expression and yellow indicates increased expression compared with normal colon. Each tumor is shown as a column, which is indicated according to the histology subtype shown at the bottom (red = adenocarcinoma, green = mucinous adenocarcinoma, cyan = signet ring adenocarcinoma, and brown = normal) and each row represents a gene. Genes with a significant positive correlation to the ATOH1 expression pattern are shown in Pearson correlation rank order from top to bottom on the right-hand side. (B) Immunohistologic analysis of human colon tumors for SPDEF. Normal (top) and tumor (bottom) parts of the tissue were indicated by a black dotted line. Pink arrows point to SPDEF-positive (shown in brown) cells in normal part of the tissue. (C) Box plots show intensity and extent of SPDEF expression for different histologic types. (D) Representative images of SPDEF staining in normal, adenoma, and adenocarcinoma are shown. Scale bars, 100 μm.
Loss of Spdef Increases Colonic Adenoma Formation in ApcMin/+ Mice
To test the hypothesis that Spdef loss plays a causative role in spontaneous intestinal tumorigenesis, we assessed the susceptibility of Spdef−/− mice to the formation of intestinal tumors driven by Apc loss and activation of β-catenin in ApcMin/+ mice. Spdef-deficient mice were bred with ApcMin/+ mice, and tumor burden was assessed at 16 weeks of age. Spdef−/−; ApcMin/+ mice developed approximately 3-fold more colon tumors (12.6 ± 1.9 polyps/mouse) compared with Spdef+/+; ApcMin/+ control mice (4.38 ± 0.75 polyps/mouse; Figure 2A; P < .001). Both Spdef−/−; ApcMin/+ and Spdef+/+; ApcMin/+ control mice had tumors in the small intestine, however, no significant difference in tumor number was observed between Spdef genotypes (data not shown). In contrast to the increased colon tumor number, loss of Spdef did not affect the size or grade of colon tumors (data not shown). Tumor cell proliferation was assessed by immunohistologic examination of bromodeoxyuridine (BrdU)-incorporating cells per high-power field (Figure 2C), and revealed no significant difference in proliferation between colonic tumors from Spdef−/− and from littermate control mice (30.51 ± 2.2 vs 34.4 ± 1.9 BrdU+ cells per high-power field; Figure 2C, Supplementary Figure 2E). Similarly, no difference in apoptosis was detected in tumors from Spdef−/−; ApcMin/+ compared with Spdef+/+; ApcMin/+ control mice (Supplementary Figure 2A and C).
Figure 2.

Spdef functions as a tumor suppressor in mouse colon. Colonic polyp numbers from (A) ApcMin/+;Spdef +/+ and ApcMin/+;Spdef −/− mice, and (B) AOM + DSS–treated Spdef+/+ and Spdef−/− mice are shown. Each triangle and rectangle indicates the number of colonic polyps in each mouse. Horizontal lines indicate the average number of polyps in the group. Immunohistologic analysis for BrdU assessing cell proliferation in tumors from Spdef+/+ and Spdef−/− mice from (C) ApcMin/+ and (D) AOM + DSS models are shown. (A and B) Open triangles show data from Spdef+/+ and closed rectangles show data from Spdef−/− mice. (E) Immunohistologic analysis for MMP7 in normal crypts (upper panels) and in tumors (lower panels) from Spdef+/+ and Spdef−/− mice from the AOM + DSS model are shown. (F) In situ hybridization analysis for Ascl2 in normal crypts from 6- to 8-week-old Spdef+/+ and Spdef−/− mice are shown. Scale bars, 100 μm.
Loss of Spdef Enhances Tumor Formation in a Model of Colitis-Associated Cancer
We next tested the hypothesis that loss of Spdef would increase tumorigenesis in inflammation-related cancer, using a well-established mouse model of treatment with azoxymethane (AOM) + DSS. We found a significant approximately 3-fold increase in colonic tumor burden in Spdef−/− mice treated with AOM + DSS compared with their wild-type littermates (Figure 2B). However, there was no significant difference in the size or grade of tumors from Spdef−/− compared with Spdef+/+ mice (data not shown). Similarly, tumor cell proliferation was not different between Spdef−/− and Spdef+/+ mice (Figure 2D, Supplementary Figure 2F). Likewise, no difference in apoptosis was detected in tumors from Spdef−/− compared with Spdef+/+ control mice (Supplementary Figure 2B and D).
Loss of Spdef Leads to Abnormal Expression of Wnt Target Genes
To gain insight into potential mechanisms by which Spdef loss leads to an increase in tumor initiation, we assessed expression of matrix metalloproteinase (MMP)7, a Wnt/β-catenin target gene that normally is restricted to the small intestine and is thought to have an oncogenic function in colonic tumorigenesis.20 As previously reported,5 MMP7 expression was observed in Spdef−/− normal colon (Figure 2E, upper right) whereas it was not observed in Spdef+/+ control normal colon (Figure 2E, upper left). MMP7 was detected in colonic tumors from both Spdef−/− and Spdef+/+ at a similar level (Figure 2E, lower images). We also observed a negative correlation between SPDEF and MMP7 expression in the human CRC microarray data19 (Pearson coefficient, r2 = −0.269 between SPDEF and MMP7 probe sets). We next assessed Ascl2, a crypt base columnar stem cell marker and a Wnt/β-catenin target gene whose ectopic expression leads to crypt hyperplasia.21 No apparent difference was observed in Ascl2 mRNA level between Spdef−/− and Spdef+/+ normal colon (Figure 2F). These results indicate a potential role for SPDEF in regulating a subset of Wnt/β-catenin targets that are important in tumor initiation, either as direct transcriptional targets of SPDEF or by modulation of β-catenin activity.
Loss of Spdef Promotes Local Tumor Invasion
In vitro analysis of colon cancer cell lines suggested that SPDEF negatively regulates cell migration.12 To investigate whether Spdef plays a role in de novo tumor progression to an invasive phenotype in vivo, colonic tumors were induced in Spdef−/− and Spdef+/+ mice using 1,2-dimethylhydrazine + DSS. Twenty-one weeks after induction, all mice had developed colon tumors. Histologic analysis indicated that 5 of 9 Spdef−/− mice developed carcinomas with evidence of local invasion (Figure 3B and C). These invasive carcinomas included tumors with neoplastic cells piercing through the muscularis mucosa and invading submucosal blood vessels (Figure 3B), as well as submucosal neoplastic cells with an associated desmoplastic response (Figure 3C). In contrast to Spdef−/− mice, tumors in Spdef+/+ mice were all adenomas with high-grade dysplasia, with 2 animals showing intramucosal carcinoma, but no evidence of penetration through the muscularis mucosa (Figure 3A). Immunofluorescent analysis showed that invading tumor cells are E-cadherin+ (epithelial marker) as well as CD44v6+ and are surrounded by vimentin+ and Zeb1+ (mesenchymal marker) cells (Figure 3B and C). The difference in the frequency of invasive carcinoma in Spdef−/− (55%) vs Spdef+/+ mice (0%) was significant (P < .04), and supports the concept that loss of Spdef contributes to tumor progression and invasion in human colon cancer.
Figure 3.

Spdef loss leads to local invasion of colonic tumors. Representative images from histologic analysis of colonic tumors induced by 1,2-dimethylhydrazine + DSS treatment are shown. H&E staining of (A) tumors from Spdef+/+ and (B and C) tumors from Spdef−/−. Lower-magnification images are shown on the left. Dotted squares indicate the area shown in higher magnification presented in the second panel from left. On the right, immunofluorescent analysis for ZEB1 (stromal cell marker) and E-cadherin (epithelial cell marker) are shown. The panel shown on the second from right, immunofluorescent analysis for αSMA, CD44v6, and vimentin are shown. (B) Penetration of tumor cells through the muscularis mucosa and into a vessel. (C) Tumor cells surrounded by desmoplastic stroma. Scale bars, 100 μm.
SPDEF Expression Inhibits Tumor Cell Proliferation
To examine the potential of SPDEF as a therapeutic target, we next tested the hypothesis that induced expression of SPDEF would inhibit the growth of established colorectal tumors. We first tested this hypothesis by transiently expressing SPDEF in established tumors from ApcMin/+ mice. At 16 weeks of age, Spdefdox-intestine; ApcMin/+ and littermate SpdefWT; ApcMin/+ control mice were treated with doxycycline for 5 days to induce SPDEF expression. As shown in Figure 4A, proliferation was reduced dramatically in Spdefdox-intestine; ApcMin/+ tumors in which SPDEF was expressed, compared with tumors from SpdefWT; ApcMin/+ control mice that lacked SPDEF. We then assessed whether SPDEF could drive cell-cycle exit in a model of colitis-associated cancer. Tumors were induced in Spdefdox-intestine and SpdefWT control mice with AOM + DSS, and all mice subsequently were treated with doxycycline for 5 days before death. Similar to our observation in ApcMin/+ tumors, transient expression of SPDEF dramatically reduced tumor cell proliferation in established AOM + DSS tumors from Spdefdox-intestine mice compared with SpdefWT control mice (Figure 4B). Quantitative analysis identified 100.5 ± 13.3 BrdU-incorporating cells per high-power field in tumors from control mice, but only 26.1 ± 5.3 BrdU-incorporating cells per field in SPDEF-expressing tumors (P < .001; Figure 4C). Similar to what we previously reported in the normal intestine,4 no effect on apoptosis was noted in tumors in which SPDEF was expressed transiently (data not shown). These data indicate that re-expression of SPDEF efficiently arrested cellular proliferation in established tumors.
Figure 4.

SPDEF promotes cell-cycle exit of the intestinal tumors in mice. Immunohistologic analysis for BrdU-incorporated cells (green) and SPDEF-expressing (red) and control cells within intestinal tumors from (A) ApcMin/+ and (B) AOM + DSS models are shown. (C) BrdU-positive cells (green) were quantified under a high-power field. Representative images used for BrdU quantification from SPEF-expressing (Spdefdox-intestine) and littermate control (SpdefWT) tumors are shown on the left. White bar shows data from SpdefWT and the black bar shows data from Spdefdox-intestine. Scale bars, 100 μm. DAPI, 4′,6-diamidino-2-phenylindole.
SPDEF Expression Inhibits β-Catenin Activity
Having identified a tumor-suppressive effect of SPDEF expression in colon tumors, we next examined the potential mechanisms underlying the inhibition of proliferation by SPDEF. The Wnt/β-catenin pathway plays a critical role in regulating cell proliferation in both normal intestinal epithelium and colon cancer cells.22 Therefore, we assessed the activity of β-catenin in control and SPDEF-expressing tumors by assessing the expression level of the β-catenin downstream targets. We first assessed the effect of SPDEF expression on cyclin D1, a target of β-catenin and driver of the G1/S-phase transition of the cell cycle. As shown in Figure 5A and C (upper right panels), most tumor cells express cyclin D1 in both ApcMin/+ and AOM + DSS tumor models. However, SPDEF-expressing tumor cells showed a cell-autonomous inhibition of cyclin D1 expression in both ApcMin/+ and AOM + DSS tumors (Figure 5A and C, lower left panels). We then assessed the effect of SPDEF on MMP7, another β-catenin target whose increased expression was associated with proliferation in colon cancer.23 As shown in Figure 5B and D (upper left panels), many tumor cells express MMP7 in both ApcMin/+ and AOM + DSS tumor models. However, most SPDEF-expressing tumor cells do not express MMP7 in both ApcMin/+ and AOM + DSS tumor models (Figure 5B and D, lower left panels), consistent with prior in vitro data.12 We also assessed the effect of SPDEF on Ascl2, another β-catenin target gene and a marker of crypt base columnar (Lgr5+) stem cells.21 As shown in Figure 5E (upper 2 left panels), higher Ascl2 levels are seen within the tumors that do not express SPDEF (Figure 5E, upper 2 right panels). However, lower levels of Ascl2 (Figure 5C, black dotted lines) are seen in SPDEF-expressing tumor cells. Taken together, these data suggest that SPDEF prevents tumor cell proliferation by negatively regulating β-catenin transcriptional activity.
Figure 5.

Wnt signaling pathway was inhibited in SPDEF-expressing tumors in mouse. Left panels: immunohistologic analysis for cyclin D1 in tumors from control mice (SpdefWT) and SPDEF-expressing mice (Spdefdox-intestine) from (A) ApcMin/+ and (C) AOM + DSS models show that there is less cyclin D1+ cells (red) in tumors in which SPDEF is induced (green). White lines indicate areas of tumors expressing SPDEF. Immunohistologic analysis for MMP7 (in red) and SPDEF-expressing cells (in green) are shown in left panels for (B) ApcMin/+ and (D) AOM + DSS models. (A–D) Right panels: H&E of the tumors shown in left panels. Black dotted squares in the H&E images show the area analyzed in immunohistologic analysis. (E) In situ hybridization analysis for Ascl2 and immunohistologic analysis for SPDEF that are performed on adjacent sections on tumors from AOM + DSS–treated mice are shown. Black dotted lines indicate the area of SPDEF-expressing cells in tumors from Spdef dox-intestine mice. Red dotted lines indicate the areas shown in higher magnification on right. Scale bars: white, 50 μm; black, 100 μm. DAPI, 4′,6-diamidino-2-phenylindole.
SPDEF Inhibits β-Catenin Transcriptional Activity in Colon Cancer Cells
To gain insight into the mechanism by which SPDEF inhibits β-catenin activity, we used an in vitro model. SPDEF was transfected transiently into 2 colon cancer cell lines: HCT116 (which bears an activating mutation in β-catenin) and SW480 (which bears mutant Adenomatosis polyposis coli [APC]) (Figure 6A). β-catenin– driven transcriptional activity was measured by luciferase reporter assay; β-catenin transcriptional activity was reduced dramatically upon SPDEF co-expression (Figure 6A). This inhibitory effect of SPDEF on β-catenin– driven transcriptional activity was seen in 2 colon cancer cell lines that harbor different mutations that lead to hyperactive β-catenin. This result suggests that the effect of SPDEF on β-catenin activity is independent of APC/Glycogen synthase kinase 3 (GSK)-3–mediated degradation. To elucidate the consequences of reduced β-catenin–driven transcriptional activity observed in SPDEF-expressing cancer cells, we assessed β-catenin target genes that control cell cycle, cyclin D1 (Figure 6B), and c-MYC (Figure 6C). Quantitative analysis indicated that mean fluorescence intensity of SPDEF was more than 50-fold higher in SPDEF-expressing cells in both CRC lines. Mean fluorescence intensity of cyclin D1 was reduced by approximately 50% in both cell lines (P < .0001), and c-MYC was reduced by approximately 20% in HCT116 and 40% in SW480 (P < .0001) in SPDEF-expressing cells when compared with the control cells. This result confirms the reduction in β-catenin–driven transcriptional activity by SPDEF expression, and suggests a potential mechanism for inhibition of cell proliferation driven by SPDEF expression in cancer cells. As seen in our de novo tumorigenesis models, adjacent non–SPDEF-expressing cells expressed higher levels of cyclin D1 and c-MYC, indicating the effect of SPDEF is cell autonomous.
Figure 6.

SPDEF inhibits canonical Wnt signaling in vitro. (A) β-catenin–driven transcriptional activity was measured using TOPFALSH/FOPFLASH luciferase assay. White bars show data from control cells and black bars show data from SPDEF-expressing cells. Analysis for SPDEF using anti-flag and anti-SPDEF confirmed the induction of SPDEF in cell lines transiently transfected with flag-tagged SPDEF construct. Tubulin was used to check the total amount of protein loaded. Immunofluorescent analysis for (B) cyclin D1 and (C) c-MYC for both cell lines are shown. Arrowheads point to SPDEF-expressing cells. Arrows point to SPDEF-expressing cells that are showing signs of cell death. The mean intensity of each signal was quantified using Imaris (Bitplane, South Windsor, CT) (shown on the far right). Scale bars, 20 μm. DAPI, 4′,6-diamidino-2-phenylindole.
SPDEF Interacts With β-Catenin in Colon Cancer Cells
To assess a potential mechanism for the inhibition of β-catenin–dependent transcriptional activity by SPDEF, we analyzed the β-catenin protein level in nucleus and cytoplasm in HCT116 and SW480 and compared control vs SPDEF-expressing cells (Figure 7A). Immunoblot analysis indicated that the β-catenin protein level was not altered in nucleus or in cytoplasm when SPDEF expression was induced in both cell lines. Next, we assessed whether SPDEF and β-catenin physically interact (Figure 7B and C). Co-immunoprecipitation of SPDEF bound to β-catenin was observed in nuclear fractions of both HCT116 and SW480 cells, using both anti–β-catenin and anti-Flag (SPDEF) antibodies. Together, these results suggest that SPDEF binds β-catenin to interfere with its transcriptional activity.
Figure 7.
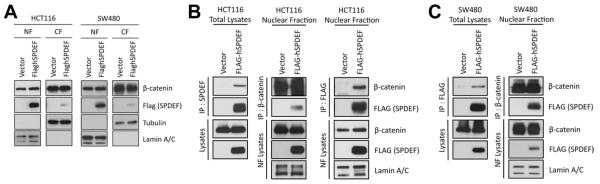
SPDEF interacts with β-catenin. (A) Immunoblot for β-catenin in the nuclear fraction (NF) and cytoplasmic fraction (CF) from SW480 and HCT116 cells. Tubulin and lamin A/C were used as protein loading controls for CF and NF, respectively. Immunoblot analysis for immunoprecipitated samples with either flag SPDEF or β-catenin are shown for (B) HCT116 and (C) SW480.
Discussion
SPDEF Loss Contributes to Colonic Tumorigenesis
In this study, we showed that SPDEF functions as a tumor suppressor in the colon using mouse in vivo models and human colon cancer tissue analysis. Our analysis of human colon cancer tissue (Figure 1) suggests that loss of SPDEF is associated with colonic tumor initiation and progression from adenoma to adenocarcinoma. Similar reduction in SPDEF expression levels were observed in the 3 mouse models of CRC used in this study (Supplementary Figure 3). Our animal model data support a paradigm in which SPDEF’s tumor-suppressive effect involves both tumor initiation (Figure 2) and progression to invasive carcinoma (Figure 3), consistent with a previous in vitro study that suggested a role for SPDEF in colon cancer cell growth and invasion.12 Thus, these data from de novo tumor models show a tumor-suppressive role for SPDEF.
These results support a role for SPDEF as a colon tumor suppressor, but the molecular mechanisms for increased tumor initiation as a result of SPDEF loss remains unclear. Analysis of intestines from Spdef−/− mice showed defects in goblet and Paneth cell maturation,5 as well as changes in expression of genes including Mmp7 and Mucin 2 (Muc2), which previously were shown to play roles in intestinal tumorigenesis.24 The increased colon tumor burden observed in ApcMin/+;Spdef−/− mice (Figure 2) was similar to ApcMin/+; Muc2-deficient mice,25 suggesting a potential mechanistic link between SPDEF and MUC2 in colon carcinogenesis. In addition, increased expression of MMP7 in Spdef−/− mouse colon is consistent with a previous study linking SPDEF with MMP7 expression in CRC cell lines,12 and may contribute to increased tumor incidence (Figure 2E). An oncogenic role for MMP7 was suggested by studies showing frequent ectopic expression of MMP7 in human colon tumors,26 and increased tumorigenicity of xenografted colon cancer cell lines with ectopically expressed MMP7.20 Because loss of SPDEF is a frequent event in colon cancer, further elucidation of the molecular mechanisms by which SP-DEF loss leads to an increase in colonic tumorigenesis will provide deeper understanding of the pathogenesis of colon cancer.
The mechanisms of SPDEF loss also remain unclear. We and others have reported that ATOH1 is a tumor suppressor that is silenced by genetic and epigenetic mechanisms in most human colon cancers.16,27 In our previous studies, we showed that Atoh1 is required for Spdef expression in normal mouse intestine.4,7 Here, we report microarray analysis showing a tight correlation between ATOH1 and SPDEF loss in human colonic adenoma and adenocarcinoma (Figure 1A). In aggregate, these data strongly suggest that SPDEF loss is caused by ATOH1 silencing.
It is noteworthy that the intensity and extent of nuclear SPDEF expression was high in signet ring carcinomas and mucinous carcinomas (Supplementary Figure 2). It has been reported that ATOH1 (HATH1) expression is also high in mucinous and signet ring carcinomas.28 Therefore, we suggest that the molecular events that lead to tumorigenesis in most adenomas and adenocarcinomas are distinct from mucinous and signet ring carcinomas, which have a common characteristic that they retain the ATOH1-SPDEF–directed program of goblet cell differentiation. The ATOH1 syn-expression group identified by our microarray analysis (Figure 1A; Supplementary Table 1) likely contains many of the genes that direct the mucinous/signet ring phenotype in CRC, and therefore provides clues to define molecular signatures that distinguish histologically distinct colon cancers.
It is intriguing that colonic polyp formation was increased significantly but there was no change in small intestinal polyp number in ApcMin/+;Spdef−/− mice (Figure 2). Although the molecular mechanism of this phenomenon is unclear, we speculate that loss of Spdef has greater impact on neoplastic transformation in the colon than in the small intestine because our previous studies elucidating a role for SPDEF in normal intestinal epithelium indicated that SPDEF expression is more abundant in colon than in small intestine.4 This shift to colon tumor formation in the Spdef−/−; ApcMin/+ mouse model is similar to what is observed in colorectal cancer patients, suggesting that Spdef−/− mice can be used as an improved model for testing compounds to prevent and treat colon cancer.
SPDEF Is a Potential Therapeutic Target for Colon Cancer
Similar to the previous reports in normal crypts,4,5 loss of Spdef did not alter cell proliferation yet SPDEF re-expression was sufficient to inhibit cell proliferation in colonic tumors. This result indicates that SPDEF is not required in induction of cell-cycle exit and redundant factors may be at work to compensate for Spdef loss. This ability of SPDEF to drive cell-cycle exit in tumor cells (Figure 4) makes this protein a good potential therapeutic target. γ-Secretase inhibitors, which inhibit Notch activation and promote secretory cell differentiation, have been proposed as a treatment for colon cancer and this approach has been explored in mice.8,29 Two obstacles to the use of γ-secretase inhibitors are drug-induced diarrhea, and the requirement for drug-induced ATOH1 expression to induce cell-cycle exit.8 Our current study provides in vivo evidence that SPDEF can be used to drive cell-cycle exit in colon cancer. Whether SPDEF can direct colon tumor cells to exit the cell cycle in the absence of ATOH1 remains to be determined. However, our in vitro data suggests that the effect of SPDEF is ATOH1 independent. The 2 colon cancer cell lines used in this study (SW480 and HCT116) have very low ATOH1 expression and SPDEF expression (Supplementary Figure 4), which is not induced by treatment with γ-secretase inhibitors.8 Despite the absence of ATOH1 expression, we show that SPDEF expression inhibits β-catenin transcriptional activity coincident with decreased expression of β-catenin target genes, which play critical roles in cell-cycle regulation (Figures 5 and 6). Thus, therapeutic expression of SPDEF is likely to have tumor-suppressive effects independent of ATOH1 expression status.
SPDEF Is a Point of Cross-Talk Between Notch and β-Catenin Pathways
In this study, we have found that SPDEF interferes with β-catenin transcriptional activity and inhibits cell proliferation (Figures 5 and 6), likely through the protein–protein interaction between SPDEF and β-catenin (Figure 7). Gregorieff et al5 identified Spdef as a target of the transcription factor (TCF)/β-catenin pathway; together our data suggest that SPDEF may be part of a negative feedback loop to modulate TCF/β-catenin activity. We previously reported that SPDEF is regulated negatively by the Notch signaling pathway.4 Thus, SPDEF is a molecular node at which Notch and TCF/β-catenin signals integrate to control stem cell fate and to maintain intestinal homeostasis. We propose that in an environment with high β-catenin activity, such as in intestinal stem cells and adenomas, SPDEF can interact with the β-catenin/TCF complex to interfere with β-catenin–mediated transcriptional activation. Thus, we suggest that SP-DEF is a novel inhibitor of TCF/β-catenin and is a key effector of the low Notch/high Atoh1 state. Several points of cross-talk between the Notch and β-catenin pathways have been identified, including regulation of Atoh1, Jag1, and Hes1 by the Wnt/GSK3-β/TCF/β-catenin pathway30–32; and local production of Wnt and Dll by Atoh1- and Wnt-dependent Paneth cells in the stem cell niche.33 Thus, this study adds another novel mechanism by which Notch and β-catenin pathways cross-talk to coordinately maintain intestinal homeostasis and impact colorectal tumorigenesis.
In conclusion, this report shows that SPDEF functions as a tumor suppressor in vivo, and shows that the mechanism of SPDEF’s tumor suppression includes directed cell-cycle exit via inhibition of β-catenin activity. We suggest that identification of pathways that can induce SP-DEF in an Atoh1-independent manner is a critical future goal to target SPDEF for colon cancer treatment.
Supplementary Material
Supplementary Figure 1. SPDEF is highly expressed in a subset of colonic carcinomas. Immunohistologic analysis for SPDEF on colonic tissue microarray (TMA) indicates that some signet ring cell and mucinous adenocarcinomas express SPDEF in the nucleus of epithelia. Scale bars, 100μm.
Supplementary Figure 2. Loss of Spdef does not alter cell death in colonic tumors. Cell death in colonic tumors was immunohistologically assessed using anti-cleaved caspase-3 antibody. Shown is quantification of cleaved caspase-3–positive cells under a high-power field in tumors from (A) ApcMin/+- and (B) AOM + DSS–treated mice. Cleaved caspase-3+ cells in tumors from Spdef+/+ and Spdef−/− are 4.03 ± 0.56 vs 5.58 ± 0.52 for ApcMin/+ and 5.74 ± 0.58 vs 6.08 ± 0.30 for AOM + DSS, respectively. The Student t test was used for the statistical analysis. Representative images of immunohistologic analysis for cleaved caspase-3 from (C) ApcMin/+- and (B) AOM + DSS–treated mice are shown. BrdU+ cells within high-power field shown in lower panels of (Figure 2C and D) were quantified for (E) ApcMin/+ and (F) AOM + DSS compared with wild-type controls. Scale bars, 100 μm.
Supplementary Figure 3. SPDEF expression levels in mouse colonic tumors are similar to human tissue array. SPDEF expression was assessed immunohistologically in normal colons from Spdef+/+ and Spdef−/− and colonic tumors from AOM + DSS, 1,2-dimethylhydrazine + DSS, ApcMin/+ models. No SPDEF expression was observed in normal colons and tumors of Spdef−/− from all the models analyzed. SPDEF expression in tumors (indicated by black arrows) from Spdef+/+ mice are lower compared with the normal expression level in the colon, which is comparable with the result we obtained from human tissue microarray (TMA) in this study (Figure 1). Black dotted squares in lower-magnification images indicate the area shown in higher magnification below. Scale bars, 100 μm.
Supplementary Figure 4. SPDEF expression levels in human cancer cell lines. SPDEF expression level was assessed by immunoblot in human colon cancer cell lines (SW480 and HCT116), human prostate cancer cell line (PC3) at baseline, as well as in cell lines that were transiently transfected with the SPDEF expression construct (SW480 Flag-SPDEF and HCT116 Flag-SPDEF). Tubulin was used as a protein loading control.
Acknowledgments
Funding Supported by National Institutes of Health grants R01 CA142826 (N.F.S.) and R03 DK084167 (N.F.S.), and National Institutes of Health/National Center for Research Resources grants 5UL1RR026314-02 and P30 DK078392.
Abbreviations used in this paper
- AOM
azoxymethane
- BrdU
bromodeoxyuridine
- CRC
colorectal cancer
- DSS
dextran sodium sulfate
- MMP
matrix metalloproteinase
- mRNA
messenger RNA
- SPDEF
SAM pointed domain containing ETS transcription factor
- TCF
transcription factor
Footnotes
Conflicts of interest The authors disclose no conflicts.
Supplementary Material Note: To access the supplementary material accompanying this article, visit the online version of Gastroenterology at www.gastrojournal.org, and at http://dx.doi.org/10.1053/j.gastro.2013.01.043.
References
- 1.Oettgen P, Finger E, Sun Z, et al. PDEF, a novel prostate epithelium-specific ets transcription factor, interacts with the androgen receptor and activates prostate-specific antigen gene expression. J Biol Chem. 2000;275:1216–1225. doi: 10.1074/jbc.275.2.1216. [DOI] [PubMed] [Google Scholar]
- 2.Chen H, Nandi AK, Li X, et al. NKX-3.1 interacts with prostate-derived Ets factor and regulates the activity of the PSA promoter. Cancer Res. 2002;62:338–340. [PubMed] [Google Scholar]
- 3.Yamada N, Tamai Y, Miyamoto H, et al. Cloning and expression of the mouse Pse gene encoding a novel Ets family member. Gene. 2000;241:267–274. doi: 10.1016/s0378-1119(99)00484-9. [DOI] [PubMed] [Google Scholar]
- 4.Noah TK, Kazanjian A, Whitsett J, et al. SAM pointed domain ETS factor (SPDEF) regulates terminal differentiation and maturation of intestinal goblet cells. Exp Cell Res. 2010;316:452–465. doi: 10.1016/j.yexcr.2009.09.020. [DOI] [PMC free article] [PubMed] [Google Scholar]
- 5.Gregorieff A, Stange DE, Kujala P, et al. The ets-domain transcription factor Spdef promotes maturation of goblet and paneth cells in the intestinal epithelium. Gastroenterology. 2009;137:1333–1345. e1–3. doi: 10.1053/j.gastro.2009.06.044. [DOI] [PubMed] [Google Scholar]
- 6.Shroyer NF, Wallis D, Venken KJ, et al. Gfi1 functions downstream of Math1 to control intestinal secretory cell subtype allocation and differentiation. Genes Dev. 2005;19:2412–2417. doi: 10.1101/gad.1353905. [DOI] [PMC free article] [PubMed] [Google Scholar]
- 7.Shroyer NF, Helmrath MA, Wang VY, et al. Intestine-specific ablation of mouse atonal homolog 1 (Math1) reveals a role in cellular homeostasis. Gastroenterology. 2007;132:2478–2488. doi: 10.1053/j.gastro.2007.03.047. [DOI] [PubMed] [Google Scholar]
- 8.Kazanjian A, Noah T, Brown D, et al. Atonal homolog 1 is required for growth and differentiation effects of notch/gamma-secretase inhibitors on normal and cancerous intestinal epithelial cells. Gastroenterology. 2010;139:918–928. 928, e1–6. doi: 10.1053/j.gastro.2010.05.081. [DOI] [PMC free article] [PubMed] [Google Scholar]
- 9.Turner DP, Findlay VJ, Kirven AD, et al. Global gene expression analysis identifies PDEF transcriptional networks regulating cell migration during cancer progression. Mol Biol Cell. 2008;19:3745–3757. doi: 10.1091/mbc.E08-02-0154. [DOI] [PMC free article] [PubMed] [Google Scholar]
- 10.Feldman RJ, Sementchenko VI, Gayed M, et al. Pdef expression in human breast cancer is correlated with invasive potential and altered gene expression. Cancer Res. 2003;63:4626–4631. [PubMed] [Google Scholar]
- 11.Johnson TR, Koul S, Kumar B, et al. Loss of PDEF, a prostate-derived Ets factor is associated with aggressive phenotype of prostate cancer: regulation of MMP 9 by PDEF. Mol Cancer. 2010;9:148. doi: 10.1186/1476-4598-9-148. [DOI] [PMC free article] [PubMed] [Google Scholar] [Retracted]
- 12.Moussa O, Turner DP, Feldman RJ, et al. PDEF is a negative regulator of colon cancer cell growth and migration. J Cell Biochem. 2009;108:1389–1398. doi: 10.1002/jcb.22371. [DOI] [PMC free article] [PubMed] [Google Scholar]
- 13.Ghadersohi A, Odunsi K, Zhang S, et al. Prostate-derived Ets transcription factor as a favorable prognostic marker in ovarian cancer patients. Int J Cancer. 2008;123:1376–1384. doi: 10.1002/ijc.23667. [DOI] [PMC free article] [PubMed] [Google Scholar]
- 14.Turner DP, Findlay VJ, Moussa O, et al. Mechanisms and functional consequences of PDEF protein expression loss during prostate cancer progression. Prostate. 2011;71:1723–1735. doi: 10.1002/pros.21389. [DOI] [PMC free article] [PubMed] [Google Scholar]
- 15.Schaefer JS, Sabherwal Y, Shi HY, et al. Transcriptional regulation of p21/CIP1 cell cycle inhibitor by PDEF controls cell proliferation and mammary tumor progression. J Biol Chem. 2010;285:11258–11269. doi: 10.1074/jbc.M109.073932. [DOI] [PMC free article] [PubMed] [Google Scholar]
- 16.Bossuyt W, Kazanjian A, De Geest N, et al. Atonal homolog 1 is a tumor suppressor gene. PLoS Biol. 2009;7:e39. doi: 10.1371/journal.pbio.1000039. [DOI] [PMC free article] [PubMed] [Google Scholar]
- 17.Gregorieff A, Clevers H. In situ hybridization to identify gut stem cells. Curr Protoc Stem Cell Biol. 2010 doi: 10.1002/9780470151808.sc02f01s12. Chapter 2:Unit 2F.1. [DOI] [PubMed] [Google Scholar]
- 18.Boivin GP, Washington K, Yang K, et al. Pathology of mouse models of intestinal cancer: consensus report and recommendations. Gastroenterology. 2003;124:762–777. doi: 10.1053/gast.2003.50094. [DOI] [PubMed] [Google Scholar]
- 19.Kaiser S, Park YK, Franklin JL, et al. Transcriptional recapitulation and subversion of embryonic colon development by mouse colon tumor models and human colon cancer. Genome Biol. 2007;8:R131. doi: 10.1186/gb-2007-8-7-r131. [DOI] [PMC free article] [PubMed] [Google Scholar]
- 20.Witty JP, McDonnell S, Newell KJ, et al. Modulation of matrilysin levels in colon carcinoma cell lines affects tumorigenicity in vivo. Cancer Res. 1994;54:4805–4812. [PubMed] [Google Scholar]
- 21.van der Flier LG, van Gijn ME, Hatzis P, et al. Transcription factor achaete scute-like 2 controls intestinal stem cell fate. Cell. 2009;136:903–912. doi: 10.1016/j.cell.2009.01.031. [DOI] [PubMed] [Google Scholar]
- 22.Fevr T, Robine S, Louvard D, et al. Wnt/beta-catenin is essential for intestinal homeostasis and maintenance of intestinal stem cells. Mol Cell Biol. 2007;27:7551–7559. doi: 10.1128/MCB.01034-07. [DOI] [PMC free article] [PubMed] [Google Scholar]
- 23.Roeb E, Arndt M, Jansen B, et al. Simultaneous determination of matrix metalloproteinase (MMP)-7, MMP-1, -3, and -13 gene expression by multiplex PCR in colorectal carcinomas. Int J Colorectal Dis. 2004;19:518–524. doi: 10.1007/s00384-004-0592-6. [DOI] [PubMed] [Google Scholar]
- 24.Wilson CL, Heppner KJ, Labosky PA, et al. Intestinal tumorigenesis is suppressed in mice lacking the metalloproteinase matrilysin. Proc Natl Acad Sci U S A. 1997;94:1402–1407. doi: 10.1073/pnas.94.4.1402. [DOI] [PMC free article] [PubMed] [Google Scholar]
- 25.Yang K, Popova NV, Yang WC, et al. Interaction of Muc2 and Apc on Wnt signaling and in intestinal tumorigenesis: potential role of chronic inflammation. Cancer Res. 2008;68:7313–7322. doi: 10.1158/0008-5472.CAN-08-0598. [DOI] [PMC free article] [PubMed] [Google Scholar]
- 26.Yoshimoto M, Itoh F, Yamamoto H, et al. Expression of MMP-7(PUMP-1) mRNA in human colorectal cancers. Int J Cancer. 1993;54:614–618. doi: 10.1002/ijc.2910540415. [DOI] [PubMed] [Google Scholar]
- 27.Leow CC, Polakis P, Gao WQ. A role for Hath1, a bHLH transcription factor, in colon adenocarcinoma. Ann N Y Acad Sci. 2005;1059:174–183. doi: 10.1196/annals.1339.048. [DOI] [PubMed] [Google Scholar]
- 28.Park ET, Oh HK, Gum JR, Jr, et al. HATH1 expression in mucinous cancers of the colorectum and related lesions. Clin Cancer Res. 2006;12:5403–5410. doi: 10.1158/1078-0432.CCR-06-0573. [DOI] [PubMed] [Google Scholar]
- 29.van Es JH, Clevers H. Notch and Wnt inhibitors as potential new drugs for intestinal neoplastic disease. Trends Mol Med. 2005;11:496–502. doi: 10.1016/j.molmed.2005.09.008. [DOI] [PubMed] [Google Scholar]
- 30.Peignon G, Durand A, Cacheux W, et al. Complex interplay between beta-catenin signalling and Notch effectors in intestinal tumorigenesis. Gut. 2011;60:166–176. doi: 10.1136/gut.2009.204719. [DOI] [PMC free article] [PubMed] [Google Scholar]
- 31.Rodilla V, Villanueva A, Obrador-Hevia A, et al. Jagged1 is the pathological link between Wnt and Notch pathways in colorectal cancer. Proc Natl Acad Sci U S A. 2009;106:6315–6320. doi: 10.1073/pnas.0813221106. [DOI] [PMC free article] [PubMed] [Google Scholar]
- 32.Tsuchiya K, Nakamura T, Okamoto R, et al. Reciprocal targeting of Hath1 and beta-catenin by Wnt glycogen synthase kinase 3beta in human colon cancer. Gastroenterology. 2007;132:208–220. doi: 10.1053/j.gastro.2006.10.031. [DOI] [PubMed] [Google Scholar]
- 33.Sato T, van Es JH, Snippert HJ, et al. Paneth cells constitute the niche for Lgr5 stem cells in intestinal crypts. Nature. 2011;469:415–418. doi: 10.1038/nature09637. [DOI] [PMC free article] [PubMed] [Google Scholar]
Associated Data
This section collects any data citations, data availability statements, or supplementary materials included in this article.
Supplementary Materials
Supplementary Figure 1. SPDEF is highly expressed in a subset of colonic carcinomas. Immunohistologic analysis for SPDEF on colonic tissue microarray (TMA) indicates that some signet ring cell and mucinous adenocarcinomas express SPDEF in the nucleus of epithelia. Scale bars, 100μm.
Supplementary Figure 2. Loss of Spdef does not alter cell death in colonic tumors. Cell death in colonic tumors was immunohistologically assessed using anti-cleaved caspase-3 antibody. Shown is quantification of cleaved caspase-3–positive cells under a high-power field in tumors from (A) ApcMin/+- and (B) AOM + DSS–treated mice. Cleaved caspase-3+ cells in tumors from Spdef+/+ and Spdef−/− are 4.03 ± 0.56 vs 5.58 ± 0.52 for ApcMin/+ and 5.74 ± 0.58 vs 6.08 ± 0.30 for AOM + DSS, respectively. The Student t test was used for the statistical analysis. Representative images of immunohistologic analysis for cleaved caspase-3 from (C) ApcMin/+- and (B) AOM + DSS–treated mice are shown. BrdU+ cells within high-power field shown in lower panels of (Figure 2C and D) were quantified for (E) ApcMin/+ and (F) AOM + DSS compared with wild-type controls. Scale bars, 100 μm.
Supplementary Figure 3. SPDEF expression levels in mouse colonic tumors are similar to human tissue array. SPDEF expression was assessed immunohistologically in normal colons from Spdef+/+ and Spdef−/− and colonic tumors from AOM + DSS, 1,2-dimethylhydrazine + DSS, ApcMin/+ models. No SPDEF expression was observed in normal colons and tumors of Spdef−/− from all the models analyzed. SPDEF expression in tumors (indicated by black arrows) from Spdef+/+ mice are lower compared with the normal expression level in the colon, which is comparable with the result we obtained from human tissue microarray (TMA) in this study (Figure 1). Black dotted squares in lower-magnification images indicate the area shown in higher magnification below. Scale bars, 100 μm.
Supplementary Figure 4. SPDEF expression levels in human cancer cell lines. SPDEF expression level was assessed by immunoblot in human colon cancer cell lines (SW480 and HCT116), human prostate cancer cell line (PC3) at baseline, as well as in cell lines that were transiently transfected with the SPDEF expression construct (SW480 Flag-SPDEF and HCT116 Flag-SPDEF). Tubulin was used as a protein loading control.