

Abstract
Aims
We performed this study to clarify natural consequences of abnormal structures (stent malapposition, thrombus, tissue prolapse, and stent edge dissection) after percutaneous coronary intervention (PCI).
Methods and results
Thirty-five patients treated with 40 drug-eluting stents underwent serial optical coherence tomography (OCT) imaging immediately after PCI and at the 8-month follow-up. Among a total of 73 929 struts in every frame, 431 struts (26 stents) showed malapposition immediately after PCI. Among these, 49 remained malapposed at the follow-up examination. The mean distance between the strut and vessel wall (S–V distance) of persistent malapposed struts on post-stenting OCT images was significantly longer than that of resolved malapposed struts (342 ± 99 vs. 210 ± 49 μm; P <0.01). Based on receiver-operating characteristic curve analysis, an S–V distance ≤260 µm on post-stenting OCT images was the corresponding cut-off point for resolved malapposed struts (sensitivity: 89.3%, specificity: 83.7%, area under the curve = 0.884). Additionally, 108 newly appearing malapposed struts were observed on follow-up OCT, probably due to thrombus dissolution or plaque regression. Thrombus was observed in 15 stents post-PCI. Serial OCT analysis revealed persistent thrombus in 1 stent, resolved thrombus in 14 stents, and late-acquired thrombus in 8 stents. Tissue prolapse observed in 38 stents had disappeared at the follow-up. All eight stent edge dissections were repaired at the follow-up.
Conclusion
Most cases of stent malapposition with a short S–V distance, thrombus, tissue prolapse, or minor stent edge dissection improved during the follow-up. These OCT-detected minor abnormalities may not require additional treatment.
Keywords: Optical coherence tomography, Stent malapposition, Thrombus, Tissue prolapse, Stent edge dissection
Introduction
The use of optical coherence tomography (OCT) in clinical practice has revealed that various types of abnormal vessel reactions associated with stent implantation (stent malapposition, thrombus, prolapse, and edge dissection) develop more frequently than expected.1,2 Given the high incidence of these abnormalities after treatment with the currently available metallic stents and the possible link between such phenomena and future clinical events, elucidation of the natural course of these findings is important regarding the safety and cost-effectiveness of percutaneous coronary intervention (PCI), because such information might help avoid unnecessary additional procedures frequently performed after stent implantation to achieve stent optimization.
In this context, several investigators including our group have reported that high-resolution OCT allows for visualization of microstructural abnormal findings before and after PCI when compared with the current gold standard, intravascular ultrasound (IVUS).2 In the present study, we performed a serial OCT examination to clarify the natural course of minor abnormalities, such as stent malapposition, thrombus, prolapse, and edge dissection.
Methods
Study population and methods
Study subjects were collected from among patients who provided written informed consent for OCT-guided PCI and follow-up OCT examination. We retrospectively selected patients implanted with sirolimus-eluting stents (SES: CypherTM, Cordis Corp., Miami Lakes, FL, USA) or paclitaxel-eluting stents (PES: Taxus LiberteTM, Boston Scientific Corp., Natick, MA, USA) having excellent OCT images immediately after stent implantation and at the 8-month follow-up. A total of 35 stable or unstable angina patients treated with SES or PES were enrolled into this study from December 2007 to September 2010. Inclusion criteria for this study were as follows: (i) native coronary arteries with diameter stenosis ≥75% and (ii) reference vessel diameter between 2.5 and 3.5 mm based on visual estimation. Exclusion criteria were as follows: (i) acute myocardial infarction, (ii) apparent congestive heart failure, (iii) contraindication to dual antiplatelet therapy, and (iv) lesions unsuitable for OCT (severe tortuous lesions and ostial lesions). All the patients were taking aspirin (100 mg/day). Ticlopidine (200 mg/day), or clopidogrel (75 mg/day) was also given for at least 8 months after stent implantation. The study was approved by the Ethics Committee of Kobe University and all enrolled study patients provided their written informed consent.
OCT examination
In this study, as frequency-domain OCT had not been approved for clinical use in Japan during the study period, time-domain OCT with coronary artery occlusion was used as previously reported.3
OCT analysis
All images were analysed by an independent observer who was blinded to the clinical presentations and lesion characteristics. Cross-sectional OCT images were analysed at every frame. Bifurcation lesions with major side branches were excluded from the analysis. To obtain identical analysis of segments at baseline and at follow-up OCT, we displayed the baseline and follow-up OCT images side-by-side and performed serial OCT analysis using information about the motorized pullback speed and landmarks such as the presence of calcium deposits, side branches, and plaque shape.
For qualitative analysis, we evaluated the presence of stent malapposition, thrombus, tissue prolapse, and stent edge dissection. Stent malapposition was defined as the distance between the centre reflection of the strut and the vessel wall greater than the actual stent thickness plus the OCT resolution limit. This resulted in stent malapposition thresholds of ≥170 µm for SES and ≥140 µm for PES.3 The malapposition length was defined as the number of consecutive frames with malapposed struts. We evaluated the maximum malapposition length for every stent. Malapposition identified after stent implantation but absent at follow-up was defined as resolved; otherwise, it was persistent. If both resolved and persistent malapposition were existed within the same stent on follow-up OCT images, it was defined as partially resolved stents. Late-acquired malapposition was defined as that not present immediately after the procedure but observed at the follow-up.4
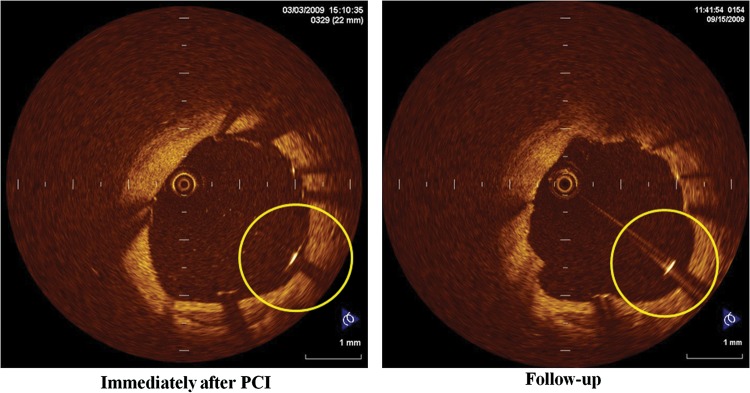
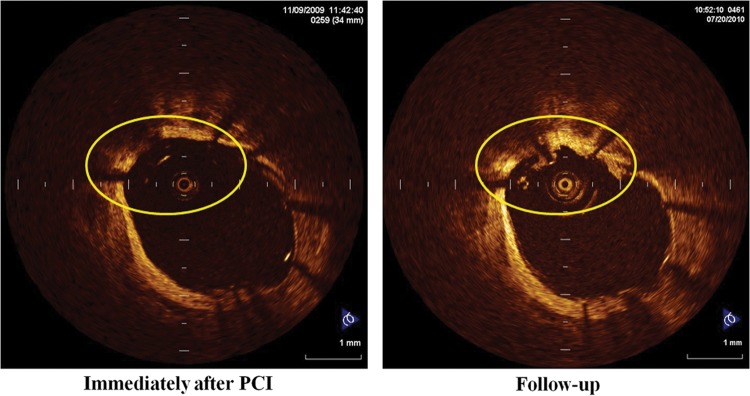
Intracoronary thrombus was defined as a mass protruding beyond the stent strut into the lumen with significant attenuation behind the mass.5,6 Resolved thrombus was defined as that observed after stent implantation, but absent at the follow-up. Persistent thrombus was defined as that still present during the follow-up period. Late-acquired thrombus was defined as that not present after the procedure, but newly appearing at the follow-up. Tissue prolapse was defined as a protrusion of tissue between the stent struts, extending inside a circular arc connecting adjacent struts in both OCT images.7 Stent edge dissection was defined as disruption of the luminal vessel surface in the edge segments.7 Representative serial OCT images of these figures are shown in Figure 1.
Figure 1.

Representative OCT images: (A) classification of malapposed struts: (a) resolved malapposition, (b) persistent malapposition, (c) late-acquired malapposition, (B) classification of thrombus: (a) resolved thrombus, (b) persistent thrombus, (c) late-acquired thrombus, (C) tissue prolapse, (D) edge dissection.
For quantitative analysis, the neointimal thickness inside each stent strut was measured for all malapposed struts. Also, we calculated the incidence of frames with malapposed struts, thrombus, and tissue prolapse on baseline and follow-up OCT images (number of frames with malapposed struts, thrombus, prolapse/total number of frames) to evaluate the changes in the longitudinal length of these abnormalities during the follow-up.
Clinical follow-up
The incidence of death, myocardial infarction, target lesion revascularization (TLR), and stent thrombosis was evaluated 8 months after the index stent procedure. TLR was defined as any reintervention (surgical or percutaneous) to treat restenosis of the analysed segment.
Statistical analysis
All statistical analyses were performed using the StatView 5.0 software (SAS Institute, Inc., Cary, NC, USA). Qualitative data are expressed as frequencies, and quantitative data are shown as mean values ± SD. Continuous variables were compared using an unpaired or paired Student's t-test or Mann–Whitney U test. Differences in categorical variables were assessed using the χ2 test and Fisher's exact tests. We performed a ROC analysis of the S–V distance to identify the optimal cut-off value for predicting the natural course of malapposed struts during the follow-up (resolved or persistent) using Medcalc (MedCalc Software, Mariakerke, Belgium). For all comparisons, a P-value <0.05 was considered statistically significant.
Results
Baseline patient demographic, lesion, and procedural characteristics are shown in Tables 1 and 2. In all stents, angiographic optimization was accomplished after PCI.
Table 1.
Baseline patient characteristics
| Variable | 35 patients (40 stents) |
|---|---|
| Age | 65.3 ± 10.3 |
| Men (%) | 28 (80) |
| Hypertension (%) | 24 (68) |
| Dyslipidaemia (%) | 26 (74) |
| Cigarette smoking (%) | 17 (49) |
| Diabetes (%) | 19 (54) |
| Renal dysfunction (%) | 7 (20) |
| Prior myocardial infarction (%) | 3 (9) |
| Prior PCI (%) | 8 (23) |
| Prior CABG (%) | 0 (0) |
| Clinical presentation (%) | |
| Stable angina pectoris | 33 (94) |
| Unstable angina pectoris | 2 (6) |
| Statin | 24 (69) |
| ACE-I, ARB | 22 (63) |
Values are presented as number of patients (%).
PCI, percutaneous coronary intervention; CABG, coronary artery bypass grafting, ACE, angiotensin-converting enzyme, ARB, angiotensin II receptor blocker.
Table 2.
Procedural characteristics
| Variable | 35 patients (40 stents) |
|---|---|
| Location, proximal/mid/distal | 8/27/5 |
| ACC/AHA classification, type A/type B/type C | 3/31/6 |
| Stent type | |
| Cypher™ | 19 |
| Taxus Liberte™ | 21 |
| Average stent diameter (mm) | 3.0 ± 0.4 |
| Average stent length (mm) | 21.9 ± 7.0 |
| Multiple overlapping stents | 2 |
| Multivessel stenting | 3 |
| Stent implantation pressure (atm) | 10.8 ± 2.1 |
| Post-dilatation | 23 |
| Largest balloon size for dilatation (mm) | 3.2 ± 0.4 |
| Maximum inflation pressure (atm) | 13.8 ± 3.2 |
| Angiographically detected dissection | 0 |
| Follow-up duration (month) | 8.1 ± 1.5 |
Values are presented as mean ± SD or number of stents.
ACC, American College of Cardiology; AHA, American Heart Association.
Incidence of persistent, resolved, and late-acquired stent malapposition
Stent malapposition was observed in 65.0% of enrolled stents (26/40 stents) immediately after stenting, and in 32.5% (13/40 stents) at the follow-up (Figure 2A). Among a total of 26 stents with post-procedural malapposition, serial OCT analysis revealed that 6 stents (6/26: 23.1%) were partially resolved with at least one persistent malapposed strut at the follow-up, and 20 stents (20/26: 76.9%) were completely resolved without any malapposed struts observed on the follow-up OCT images (Figure 2A). Late-acquired malapposition was observed in seven stents (7/40; 17.5%). According to strut-based analysis, 431 struts among a total of 73 929 struts (0.58%) were malapposed on post-procedural OCT images. Among these, serial OCT analysis revealed persistent malapposition of 49 struts, but the other 382 struts had resolved during the follow-up (resolved malapposition), and there were 108 newly appearing malapposed struts at the follow-up (late-acquired malapposition).
Figure 2.

Number of abnormal findings after stenting: (A) stent malapposition, (B) thrombus, (C) tissue prolapse, (D) edge dissection.
In most of the stents with malapposed struts after PCI, the maximum malapposition length was equal to or less than five cross-sections (Table 3). The incidences of cross-sections with malapposed struts decreased from post-procedure to the follow-up (Table 4).
Table 3.
Malapposition length analysis
| Maximum malapposition length | After PCI | At follow-up |
|---|---|---|
| ≤5 cross-sections | 19 stents | 9 stents |
| 6 ≤ 15 cross-sections | 5 stents | 3 stents |
| ≥16 cross-sections | 2 stents | 1 stent |
Table 4.
Cross-sectional OCT analysis
| Variable | Immediately after PCI |
Follow-up | P-value | ||
|---|---|---|---|---|---|
| Stent malapposition | 231 cross-sections | 2.04% | 117 cross-sections | 0.97% | 0.054 |
| Thrombus | 488 cross-sections | 5.10% | 108 cross-sections | 0.89% | 0.021 |
| Tissue prolapse | 3141 cross-sections | 28.17% | 0 cross-section | 0.00% | <0.01 |
Relation between neointimal coverage and natural course of malapposed struts
The extent of the strut coverage among the different types of malapposition differed significantly (Figure 3). The incidence of uncovered struts was significantly higher among late-acquired and persistent malapposed struts compared with resolved malapposed struts. Additionally, the mean neointimal thickness of resolved malapposed struts was significantly greater than that of the persistent and late-acquired malapposed struts.
Figure 3.

The frequency of neointimal coverage and the measurement of neointimal thickness between resolved malapposed struts, persistent malapposed struts, and late-acquired malapposed struts: (A) the incidence of struts without neointima was significantly higher in late-acquired and persistent malapposed struts compared with resolved malapposed struts. (B) The mean neointimal thickness of resolved malapposed struts was significantly thicker than that of the persistent and late-acquired malapposed struts.
Relation between S–V distance and natural course of malapposed struts
The mean S–V distance for all malapposed struts on post-procedural OCT images was 224 ± 71 μm. The mean post-procedural S–V distance of persistent malapposed struts was significantly greater than that of resolved malapposed struts (342 ± 99 μm vs. 210 ± 49 μm; P <0.01). Based on the ROC analysis, an S–V distance ≤260 µm was the corresponding cut-off point for a resolved malapposed strut with a maximum sensitivity of 89.3% and a specificity of 83.7% [area under the curve (AUC) = 0.884]. Indeed, most malapposed struts with an S–V distance ≤260 μm (341/349 struts; 97.7%) were observed to be well-apposed on follow-up OCT images (Figure 4). Only eight struts with an S–V distance ≤260 μm (8/349 struts; 2.3%) persisted, and all were observed in the same stent with suspicious plaque regression or thrombus dissolution (Figure 5).
Figure 4.

ROC curve analysis and distribution of S–V distance of post-procedural malapposed struts. (A) An S–V distance ≤260 µm was the corresponding cut-off point for a resolved malapposed strut with a maximum sensitivity of 89.3% and a specificity of 83.7% (AUC = 0.884, P = 0.001). (B) Only eight struts with an S–V distance ≤260 μm persisted.
Figure 5.
A case of persistent malapposed struts with a baseline S–V distance ≤260 μm: left panel shows the OCT image immediately after Taxus Liberte™ implantation. The S–V distance is 180 μm, which is less than the cut-off value of the S–V distance of 260 μm. These malapposed struts persisted on follow-up OCT images (right panel), probably due to plaque regression or thrombus dissolution.
Serial OCT analysis of thrombus, tissue prolapse, and edge dissection
Thrombus was observed in 15 stents (15/40: 37.5%) post-PCI and in 8 stents (8/40: 20%) at the follow-up. Serial OCT analysis revealed persistent thrombus in 1 stent (1/15: 6.7%), resolved thrombus in 14 stents (14/15: 93.3%), and late-acquired thrombus in 8 stents (8/40: 20%) (Figure 2B). Tissue prolapse was observed in 95% cases (38/40 stents) immediately after PCI, and was not observed in any of the cases at the 8-month follow-up examination (Figure 2C). There were eight stents with edge dissections immediately after PCI, all of which were repaired at the follow-up (Figure 2D). The incidences of cross-sections with thrombus and tissue prolapse decreased from post-procedure to the follow-up (Table 4).
Comparison between sirolimus-eluting stents and paclitaxel-eluting stents
The percentage of malapposed struts after PCI was 0.45% (128/27843 struts) in SES, and 0.66% (303/46086 struts) in PES. On the basis of the ROC curve analysis according to the stent type, we identified an S–V distance ≤280 µm as the best cut-off point for a resolved malapposed strut with a maximum sensitivity of 95.0% and a specificity of 100% for SES (AUC: 0.991), and an S–V distance ≤260 µm for PES (sensitivity 87.8%, specificity 80.0%, AUC = 0.865; Figure 6). The AUC for SES was numerically higher than that of PES. The incidence of thrombus, edge dissection, and tissue prolapse did not differ between SES and PES.
Figure 6.

Comparison of ROC curve analysis and distribution of S–V distance between SES and PES: (A) SES; an S–V distance of ≤280 was the best cut-off point for a resolved malapposed strut with a maximum sensitivity of 95.0% and a specificity of 100% (AUC: 0.991). All the malapposed struts with an S–V distance ≤280 μm changed to be well-apposed. (B) PES; an S–V distance of ≤260 was the best cut-off point for a resolved malapposed strut (sensitivity 87.8%, specificity 80.0%, AUC = 0.865). Eight malapposed struts with S–V distance ≤260 μm persisted.
Clinical outcome
There were no deaths at the 8-month follow-up. One patient had myocardial infarction at another vessel occlusion. TLR was necessary in six patients with seven stents. Malapposition, thrombus, tissue prolapse, and edge dissection on post-stenting OCT images were not associated with the rate of TLR at the 8-month clinical follow-up. Stent thrombosis did not occur during the follow-up (Table 5).
Table 5.
Clinical Outcome at 8-month
| Variable | n = 35 |
|---|---|
| Death (%) | 0 (0) |
| Myocardial infarction (%) | 1 (2.9) |
| Target lesion revascularization (%) | 6 (17.1) |
| Stent thrombosis (%) | 0 (0) |
Discussion
The findings of the present study demonstrated the following: (i) despite a relatively high incidence of post-procedural stent malapposition (65%), >70% of such malapposed stents had completely resolved during the follow-up period; (ii) resolved malapposed struts had a significantly thicker neointima together with fewer incidences of uncovered struts than persistent and late-acquired malapposed struts; (iii) an S–V distance ≤260 µm was the corresponding cut-off value for a resolved malapposed strut after first-generation DES with a sensitivity of 89.3% and a specificity of 83.7% (SES: S–V distance ≤280 µm; PES: S–V distance ≤260 µm); (iv) the incidence of late-acquired malapposition and thrombus were relatively high (late-acquired malapposition: 7/40 stents; 17.5%; thrombus 8/40 stents: 20%); (v) most cases of thrombus, tissue prolapse, and minor dissection detected immediately after PCI were resolved during the follow-up period.
Stent malapposition
Ako et al.8 reported that the incidence of post-procedural stent malapposition was 16.3% in the IVUS analysis of SES in De Novo Coronary Lesions (SIRIUS) trial. In the IVUS analysis of the Taxus II study, the incidence of post-procedural stent malapposition was reported to be 11.5% for slow-release and 2.6% for moderate-release PES.9 In the present study, malapposed struts were detected by post-procedural OCT in >50% of enrolled stents, which was more frequent than expected based on these previous IVUS studies. Also, although still controversial, previous IVUS studies implied a possible link between late stent malapposition (persistent or late-acquired malapposition) and an increased risk for stent thrombosis.10–12 Therefore, it is important to identify the natural course of post-procedural malapposed struts to maximize the potential benefit and cost-effectiveness of performing additional procedures for stent optimization by avoiding unnecessary post-stent balloon dilation.
Despite a relatively high incidence of stents with at least one malapposed struts, the frequency and extent of malapposed struts appeared to be low. The average incidence of malapposed struts per stent was <1% (0.6 ± 1.2%) and the average S–V distance was only 224 ± 71 μm. Additionally, among a total of 431 malapposed struts observed on post-procedural OCT images, >85% of such struts (382 struts) resolved spontaneously during the follow-up period. Therefore, we speculate that additional interventional treatment for stent optimization might not be necessary for stents with minor malapposed struts with an S–V distance ≤260 μm after first-generation DES.
Although various factors may be associated with the healing process of malapposed struts (e.g. patient and lesion characteristics, procedural factors, type of stents used, etc), we speculate that the S–V distance at the index procedure and the extent of subsequent neointima proliferation are the most relevant factors for the healing process of malapposed struts. Indeed, the S–V distance of persistent malapposed struts was significantly greater than that of resolved malapposed struts. Additionally, the mean neointimal thickness of resolved malapposed struts was significantly greater than that of persistent and late-acquired malapposed struts, suggesting that increased neointimal proliferation might decrease the incidence of persistent and/or late-acquired malapposed struts through its proliferative healing process, enough to ‘fill in’ the space between the stents and the vessel wall. Our findings might support this speculation. Gutiérrez-Chico et al.13 suggested a different healing mechanism in which the neointima progresses over time to cover the remaining malapposed struts. In our study, neointimal coverage represented as a bridge or partial bridge pattern by Gutiérrez-Chico et al.13 may have been misclassified as thrombus formation. Also, a previous report demonstrated that stent design and drug release kinetics are important factors for stent strut coverage.14 Everolimus-eluting and zotarolimus-eluting stents were used these previous studies, and the progression pattern of neointima may differ depending on the stent type.
A recent report suggested that larger acute stent malapposition might be responsible for persistent malapposition and delayed neointimal coverage.13 Our study demonstrated the cut-off value of the S–V distance between resolved and persistent malapposition, and the high rate of incomplete neointimal coverage in cases with persistent malapposition (>80%). The size of acute stent malapposition after PCI can be estimated by various parameters. Among them, S–V distance can be measured directly and easily by OCT. We suggest that S–V distance is an easy-to-use parameter for decision-making at the time of PCI.
In our study, the relationship between malapposition and late stent thrombosis was not clear. Guagliumi et al.15 reported an association between late stent thrombosis and OCT evidence of an increased frequency and length of uncovered and malapposed strut. Moreover, they suggested that late-acquired stent malapposition and extensive vessel remodelling are markers of underlying vascular toxicity and inflammation, the actual likely cause of stent thrombosis. We also found a high rate of incomplete neointimal coverage on the late-acquired malapposed struts and on the persistent malapposed struts. The uncovered and malapposed struts at the mid-term follow-up might persist for several years and thus cause late stent thrombosis.
Although our study excluded malapposed side-branch struts from OCT analysis, the first human in vivo study addressing the coverage of these struts was reported by Gutiérrez-Chico et al.16 They demonstrated coverage of malapposed side-branch struts is delayed with respect to well-apposed struts in drug-eluting stents.
Comparison of S–V distance between SES and PES
We identified different cut-off values for predicting the natural course of malapposed struts between SES and PES in this study. Although previous reports have consistently demonstrated greater neointimal proliferation with PES than with SES,17 our results indicated a longer cut-off S–V distance for SES than for PES. We speculate that this is mainly due to the difference in strut thickness between SES and PES (Cypher™ SES: 140 µm, Taxus Liberte™ PES: 97 µm). Even in cases with the same S–V distance, a thicker SES strut might lead to a shorter distance from abluminal side of the strut to the vessel, so that post-procedural malapposition is more likely to become well apposed during the follow-up.
In addition to the different cut-off S–V distance, a different predicting accuracy of S–V distance was observed between the two stent types. SES showed a greater AUC than PES in the ROC analysis, suggesting that S–V distance is more accurately predictive of the time course of post-procedural malapposition for SES than for PES. Although speculative, we consider that this can be partially explained by non-uniform vessel healing with PES when compared with SES.17,18 In PES, even malapposed struts with a long S–V distance (e.g. >260 μm) could resolve due to unexpectedly greater neointimal proliferation. On the other hand, malapposed struts with a short S–V distance (e.g. ≤260 μm) might persist due to extremely suppressed neointimal proliferation. The relatively uniform neointimal proliferation of SES might explain the more accurate prediction of the S–V distance for the time course of post-procedural malapposed struts.
Thrombus
In the present study, a considerable incidence of thrombus attachment (15/40 stents: 37.5%) was observed immediately after stenting. This might be due to procedural problems, such as a longer time required to locate the stent or insufficient heparinization during PCI. Interestingly, serial OCT examination demonstrated that most cases of such thrombus, however, had disappeared at the 8-month follow-up examination (14/15 stents: 93%). On the other hand, despite dual antiplatelet therapy, late-acquired thrombus was observed in eight stents (8/40 stents: 20.0%) at the 8-month follow-up. Subclinical thrombus attachment after DES implantation has been reported in previous OCT and angioscopic reports.5,19 According to such reports, the incidence of thrombus at mid-term follow-up OCT was 20–30% after first-generation DES, which is consistent with our results. Although the clinical impact of such thrombus remains unclear, there is concern regarding a possible link between subclinical thrombus attachment and DES restenosis or stent thrombosis.
A recent OCT study reported a significant association between late stent malapposition and the development of OCT-detected thrombus at the follow-up.20 The present study also revealed a case in which a thrombus was present on malapposed struts at the follow-up (Figure 7).
Figure 7.
A representative case of thrombus with late stent malapposition.
In a previous OCT study, we reported a possible association between stent eccentricity and thrombus formation after SES implantation. Additionally, the cytochrome P450 2C19*2 polymorphism is associated with subclinical OCT-detectable thrombus in patients treated with SES.21 On the basis of these previous findings, we speculate that the mechanism of thrombus formation involves multiple factors, including patient, lesion, and procedural factors. A larger study is necessary to confirm our speculation.
Tissue prolapse and stent edge dissection
In a post-mortem study, compression of the coronary plaque after stent implantation with the protrusion of tissue between the struts was observed in 94% of the patients.22 This finding is in agreement with our study in which tissue prolapse between the struts was visible in the vast majority of enrolled stents (95%: 38/40 stents). In a previous IVUS study, minor plaque prolapse was not associated with late angiographic in-stent restenosis.23 In our study, OCT-detectable tissue prolapse immediately after PCI was not correlated with restenosis at the follow-up. With regard to stent edge dissection, Hong et al.24 reported that non-flow-limiting edge dissections detected by IVUS are not associated with an increase in acute or long-term clinical events. In our study, none of the cases with stent edge dissection on OCT images had restenosis and all of such dissections healed spontaneously during the follow-up. On the basis of these findings, we suggest that non-flow-limiting tissue prolapse and edge dissection might not require further intervention.
Clinical significance of minor abnormalities
The present OCT study investigated the natural course of minor abnormalities after stenting during the 8-month follow-up periods. These findings were not associated with an adverse clinical outcome. Our study suggested that these abnormalities might be benign phenomenon. Previous reports provided this information, and our result also supported their studies.20,25
Limitation
Our study has a number of limitations. First, this is a non-randomized retrospective study based on a relatively limited sample size, raising the possibility of selection bias. Secondly, although we carefully reviewed both post-stenting and follow-up OCT images, it is sometimes difficult to completely match the lesions on the post-stenting and follow-up OCT images. Thirdly, although OCT is a high-resolution modality, it may not be able to differentiate neointima from an organized white thrombus, as both show high backscatter on the image. The smooth shape thrombus might thus be misdiagnosed as neointima. Fourthly, the cut-off value obtained by ROC curve analysis may be specific for the parameters of our study design, such as follow-up duration, stent design, and strut thickness with a limited number of lesions. Fifthly, strut-based analysis was performed at every frame interval. Stent-based analysis by our methodology equally evaluates stents with a single-malapposed strut as well as stents with large sections of malapposed struts. This methodology is different from that of previous IVUS studies, and the results of the present study might not be directly comparable. Finally, although we investigated the association between the minor abnormalities and the mid-term clinical event, this study is not sufficiently powered to detect possible association between them. A larger study with a longer-term follow-up will be warranted.
Conclusion
Most cases of minor stent malapposition, thrombus, tissue prolapse, and edge dissection after stenting improved spontaneously during the follow-up period. Thus, these minor abnormalities observed immediately after PCI may not require additional interventional treatment. OCT has a potential to provide information for a specific recommendation regarding the optimal endpoint for stent implantation in daily clinical practice.
Funding
Fundings to pay the Open Access publication charges for this article was provided by Dr Junya Shite.
Conflict of interest: Junya Shite is a consultant of St Jude Company and Goodman Company. Toshiro Shinke is a consultant of Goodman Company. The remaining authors report no conflicts of interests.
References
- 1.Gonzalo N, Serruys PW, Okamura T, Shen ZJ, Onuma Y, Garcia-Garcia HM, et al. Optical coherence tomography assessment of the acute effects of stent implantation on the vessel wall: a systematic quantitative approach. Heart. 2009;95:1913–9. doi: 10.1136/hrt.2009.172072. [DOI] [PubMed] [Google Scholar]
- 2.Kawamori H, Shite J, Shinke T, Otake H, Sawada T, Kato H, et al. The ability of optical coherence tomography to monitor percutaneous coronary intervention: detailed comparison with intravascular ultrasound. J Invasive Cardiol. 2010;22:541–5. [PubMed] [Google Scholar]
- 3.Matsumoto D, Shite J, Shinke T, Otake H, Tanino Y, Ogasawara D, et al. Neointimal coverage of sirolimus-eluting stents at 6-month follow-up: evaluated by optical coherence tomography. Eur Heart J. 2007;28:961–7. doi: 10.1093/eurheartj/ehl413. [DOI] [PubMed] [Google Scholar]
- 4.Guo N, Maehara A, Mintz GS, He Y, Xu K, Wu X, et al. Incidence, mechanisms, predictors, and clinical impact of acute and late stent malapposition after primary intervention in patients with acute myocardial infarction: an intravascular ultrasound substudy of the Harmonizing Outcomes with Revascularization and Stents in Acute Myocardial Infarction (HORIZONS-AMI) trial. Circulation. 2010;122:1077–84. doi: 10.1161/CIRCULATIONAHA.109.906040. [DOI] [PubMed] [Google Scholar]
- 5.Otake H, Shite J, Ako J, Shinke T, Tanino Y, Ogasawara D, et al. Local determinants of thrombus formation following sirolimus-eluting stent implantation assessed by optical coherence tomography. JACC Cardiovasc Interv. 2009;2:459–66. doi: 10.1016/j.jcin.2009.03.003. [DOI] [PubMed] [Google Scholar]
- 6.Kume T, Akasaka T, Kawamoto T, Ogasawara Y, Watanabe N, Toyota E, et al. Assessment of coronary arterial thrombus by optical coherence tomography. Am J Cardiol. 2006;97:1713–7. doi: 10.1016/j.amjcard.2006.01.031. [DOI] [PubMed] [Google Scholar]
- 7.Bouma BE, Tearney GJ, Yabushita H, Shishkov M, Kauffman CR, DeJoseph Gauthier D, et al. Evaluation of intracoronary stenting by intravascular optical coherence tomography. Heart. 2003;89:317–20. doi: 10.1136/heart.89.3.317. [DOI] [PMC free article] [PubMed] [Google Scholar]
- 8.Ako J, Morino Y, Honda Y, Hassan A, Sonoda S, Yock PG, et al. Late incomplete stent apposition after sirolimus-eluting stent implantation: a serial intravascular ultrasound analysis. J Am Coll Cardiol. 2005;46:1002–5. doi: 10.1016/j.jacc.2005.05.068. [DOI] [PubMed] [Google Scholar]
- 9.Tanabe K, Serruys PW, Degertekin M, Grube E, Guagliumi G, Urbaszek W, et al. Incomplete stent apposition after implantation of paclitaxel-eluting stents or bare metal stents: insights from the randomized TAXUS II trial. Circulation. 2005;111:900–5. doi: 10.1161/01.CIR.0000155607.54922.16. [DOI] [PubMed] [Google Scholar]
- 10.Tanigawa J, Barlis P, Dimopoulos K, Dalby M, Moore P, Di Mario C. The influence of strut thickness and cell design on immediate apposition of drug-eluting stents assessed by optical coherence tomography. Int J Cardiol. 2009;134:180–8. doi: 10.1016/j.ijcard.2008.05.069. [DOI] [PubMed] [Google Scholar]
- 11.Hong MK, Mintz GS, Lee CW, Park DW, Park KM, Lee BK, et al. Late stent malapposition after drug-eluting stent implantation: an intravascular ultrasound analysis with long-term follow-up. Circulation. 2006;113:414–9. doi: 10.1161/CIRCULATIONAHA.105.563403. [DOI] [PubMed] [Google Scholar]
- 12.Hassan AK, Bergheanu SC, Stijnen T, van der Hoeven BL, Snoep JD, Plevier JW, et al. Late stent malapposition risk is higher after drug-eluting stent compared with bare-metal stent implantation and associates with late stent thrombosis. Eur Heart J. 2010;31:1172–80. doi: 10.1093/eurheartj/ehn553. [DOI] [PubMed] [Google Scholar]
- 13.Gutierrez-Chico JL, Wykrzykowska J, Nuesch E, van Geuns RJ, Koch KT, Koolen JJ, et al. Vascular tissue reaction to acute malapposition in human coronary arteries: sequential assessment with optical coherence tomography. Circ Cardiovasc Interv. 2012;5:20–9. doi: 10.1161/CIRCINTERVENTIONS.111.965301. S1–8. [DOI] [PubMed] [Google Scholar]
- 14.Kubo T, Tanaka A, Kitabata H, Ino Y, Tanimoto T, Akasaka T. Application of optical coherence tomography in percutaneous coronary intervention. Circ J. 2012;76:2076–83. doi: 10.1253/circj.cj-12-0828. [DOI] [PubMed] [Google Scholar]
- 15.Guagliumi G, Sirbu V, Musumeci G, Gerber R, Biondi-Zoccai G, Ikejima H, et al. Examination of the in vivo mechanisms of late drug-eluting stent thrombosis: findings from optical coherence tomography and intravascular ultrasound imaging. JACC Cardiovasc Interv. 2012;5:12–20. doi: 10.1016/j.jcin.2011.09.018. [DOI] [PubMed] [Google Scholar]
- 16.Gutierrez-Chico JL, Regar E, Nuesch E, Okamura T, Wykrzykowska J, di Mario C, et al. Delayed coverage in malapposed and side-branch struts with respect to well-apposed struts in drug-eluting stents: in vivo assessment with optical coherence tomography. Circulation. 2011;124:612–23. doi: 10.1161/CIRCULATIONAHA.110.014514. [DOI] [PubMed] [Google Scholar]
- 17.Miyoshi N, Shite J, Shinke T, Otake H, Tanino Y, Ogasawara D, et al. Comparison by optical coherence tomography of paclitaxel-eluting stents with sirolimus-eluting stents implanted in one coronary artery in one procedure. - 6-month follow-up. Circ J. 2010;74:903–8. doi: 10.1253/circj.cj-09-0690. [DOI] [PubMed] [Google Scholar]
- 18.Lee JH, Kim HS, Lee SW, Park JH, Choi SW, Jeong JO, et al. Prospective randomized comparison of sirolimus- versus paclitaxel-eluting stents for the treatment of acute ST-elevation myocardial infarction: pROSIT trial. Catheter Cardiovasc Interv. 2008;72:25–32. doi: 10.1002/ccd.21510. [DOI] [PubMed] [Google Scholar]
- 19.Awata M, Kotani J, Uematsu M, Morozumi T, Watanabe T, Onishi T, et al. Serial angioscopic evidence of incomplete neointimal coverage after sirolimus-eluting stent implantation: comparison with bare-metal stents. Circulation. 2007;116:910–6. doi: 10.1161/CIRCULATIONAHA.105.609057. [DOI] [PubMed] [Google Scholar]
- 20.Ozaki Y, Okumura M, Ismail TF, Naruse H, Hattori K, Kan S, et al. The fate of incomplete stent apposition with drug-eluting stents: an optical coherence tomography-based natural history study. Eur Heart J. 2010;31:1470–6. doi: 10.1093/eurheartj/ehq066. [DOI] [PubMed] [Google Scholar]
- 21.Sawada T, Shinke T, Shite J, Honjo T, Haraguchi Y, Nishio R, et al. Impact of cytochrome P450 2C19*2 polymorphism on intra-stent thrombus after drug-eluting stent implantation in Japanese patients receiving clopidogrel. Circ J. 2011;75:99–105. doi: 10.1253/circj.cj-10-0525. [DOI] [PubMed] [Google Scholar]
- 22.Farb A, Sangiorgi G, Carter AJ, Walley VM, Edwards WD, Schwartz RS, et al. Pathology of acute and chronic coronary stenting in humans. Circulation. 1999;99:44–52. doi: 10.1161/01.cir.99.1.44. [DOI] [PubMed] [Google Scholar]
- 23.de Jaegere P, Mudra H, Figulla H, Almagor Y, Doucet S, Penn I, et al. Intravascular ultrasound-guided optimized stent deployment. Immediate and 6 months clinical and angiographic results from the Multicenter Ultrasound Stenting in Coronaries Study (MUSIC Study) Eur Heart J. 1998;19:1214–23. doi: 10.1053/euhj.1998.1012. [DOI] [PubMed] [Google Scholar]
- 24.Hong MK, Park SW, Lee NH, Nah DY, Lee CW, Kang DH, et al. Long-term outcomes of minor dissection at the edge of stents detected with intravascular ultrasound. Am J Cardiol. 2000;86:791–5. doi: 10.1016/s0002-9149(00)01085-7. A9. [DOI] [PubMed] [Google Scholar]
- 25.Kubo T, Imanishi T, Kitabata H, Kuroi A, Ueno S, Yamano T, et al. Comparison of vascular response after sirolimus-eluting stent implantation between patients with unstable and stable angina pectoris: a serial optical coherence tomography study. JACC Cardiovasc Imaging. 2008;1:475–84. doi: 10.1016/j.jcmg.2008.03.012. [DOI] [PubMed] [Google Scholar]