Abstract
Continuum simulation is employed to study ion transport and fluid flow through a nanopore in a solid-state membrane under an applied potential drop. Results show the existence of concentration polarization layers on the surfaces of the membrane. The nonuniformity of the ionic distribution gives rise to an electric pressure that drives vortical motion in the fluid. There is also a net hydrodynamic flow through the nanopore due to an asymmetry induced by the membrane surface charge. The qualitative behavior is similar to that observed in a previous study using molecular dynamic simulations. The current–voltage characteristics show some nonlinear features but are not greatly affected by the hydrodynamic flow in the parameter regime studied. In the limit of thin Debye layers, the electric resistance of the system can be characterized using an equivalent circuit with lumped parameters. Generation of vorticity can be understood qualitatively from elementary considerations of the Maxwell stresses. However, the flow strength is a strongly nonlinear function of the applied field. Combination of electrophoretic and hydrodynamic effects can lead to ion selectivity in terms of valences and this could have some practical applications in separations.
1. Introduction
Ionic conduction through nanometer-sized channels or pores is a common theme in biological systems as well as in various manufactured materials such as membranes and synthetic nanopores [1, 2, 3, 4, 5, 6, 7, 8, 9, 10]. Typical synthetic nanopore systems have a length scale of a few nanometers to tens of nanometers. This is still sufficiently large compared to molecular sizes that continuum simulations remain a powerful tool for studying them [11, 12, 13, 14, 15, 16], even though, its accuracy decreases progressively as the pore size approaches that of biological pores. This is because molecular dynamic (MD) simulations at such mesoscales are computationally very expensive.
The objective of this paper is to study the hydrodynamic flow that arises in the vicinity of a single cylindrical nanopore when a voltage is applied across the membrane. The role of electrically induced hydrodynamic flows near pores, arrays of pores or semipermeable membranes have been addressed by many authors [17]. Hydrodynamics is also implicated in polymer translocation through nanopores where viscous resistance is shown to determine translocation times [18, 19, 20] and stall forces [21] applied by optical traps to immobilize DNA in nanopores against the electric driving force.
Under the appropriate set of circumstances, hydrodynamics at the entrance or the exit of a nanopore has a strong influence on ion transport [17, 22, 23, 24]. Nanoslots and nanochannels have been shown to exhibit ion selectivity similar to that of a perm–selective membrane. Current–voltage curves for such systems show a nonlinear saturation of the current at high voltages followed by an “overlimiting” regime dominated by convective transport by fluid vortices [24]. In the case of perm selective membranes, or equivalently for a dense array of nanochannels in a membrane, the current saturation is caused by the loss of carrier ions in the concentration polarization layer (CPL) adjacent to the membrane [25, 26, 27, 28]. The hydrodynamic flow has been attributed to a loss of stability in the CPL at higher voltages [29, 30] that generates a vortex array and selects a diffusion length scale that is different from the one in the quiescent Ohmic regime [31]. The overlimiting current is a signature of this instability. These postulated micro-scale vortices have subsequently been confirmed through direct observation [23, 32]. A related electrokinetic effect of relevance is what has been termed ‘electro–osmosis of the second kind’ by Dukhin [33]. Here the flow is driven by the field component tangential to a curved surface whereas the space charge layer (SCL) itself is created by the normal component of the field. In the case of an isolated nanopore with strongly overlapping Debye layers this results in corner vortices due to a field–focusing effect and the limiting current plateau in the current voltage characteristic is eliminated [34]. Such corner vortices are also expected at corners in micro-channels due to leakage of the electric field into the dielectric [35].
In our previous paper [36] we utilized molecular dynamics (MD) simulation to study the transport and flow field in a graphene sheet nanopore. We observed concentration polarization, corner vortices and non–linear current–voltage relation for the graphene sheet nanopore system. The results are in qualitative agreement with physical expectations and theory. In this paper, we utilize continuum level simulation for transport and fluid flow in a similar nanopore system. Such an approach has the advantage of computational speed but certain features, for example steric effects, cannot be captured. We are interested in the overlap between the continuum and MD approaches which we study by comparing our simulations to the previous MD results. The rest of the paper is organized in this way: in section 2, we present our modeling and describe our numerical approach. The results are presented in section 3. Analysis and discussions are in section 4. In section 5 we provide some concluding remarks.
2. Method
2.1. Problem formulation
Our nanopore system consists of a cylindrical pore of radius R drilled on a membrane of thickness L. A cylindrical coordinate system is used. The pore connects two reservoirs that have equal radius and depth, LR. A sketch of the nanopore system is shown in Figure 1. The membrane surface is indicated by the lines: CD, DE and EF.
Figure 1.
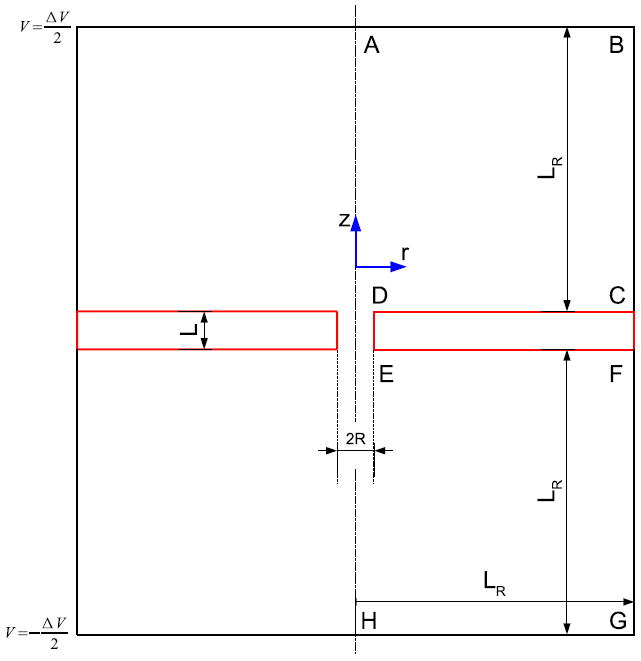
A sketch of the nanopore system showing cylindrical coordinates. The system is axisymmetric.
The bath is taken as a KCl solution where the salt is fully dissociated. The concentration of either ionic species is taken as c0. We will assume, for simplicity, that the membrane has a fixed surface charge of density Σ and ignore any changes induced by shifts of the ionization equilibrium (from various effects such as changes in salt concentration and pH). For the purpose of estimation, a rule of thumb is that Σ cannot exceed the value of one electron charge per Bjerrum length [17]. Due to attraction of counter–ions, in this case K+, an electric double layer (EDL) forms along the charged surfaces (CD, DE and EF). An external electric field is used to generate current through the nanopore. The field will induce its own space charge along surfaces due to concentration polarization (CP) thereby modifying the existing EDL. The action of the tangential electric field on the space charges drags the fluid along the membrane resulting in electroosmotic flow (or EOF). The Nernst-Planck-Poisson (NPP)–Stokes system of equations describes the coupling between ion transport, electric field and hydrodynamics.
Assuming that a stationary state has been reached, the NPP–Stokes system of equations in the solution domain consists of the continuity equation:
| (1) |
the Stokes equation:
| (2) |
the Nernst–Planck equations for cations and anions:
| (3) |
| (4) |
and Poisson equation for the electric potential:
| (5) |
The fluid flow is governed by the Stokes equation with an additional electrostatic volume force term, since the inertia term in the Navier–Stokes equation is inconsequential at the nanoscale. Here u = uêr + wêz is the flow velocity, êr and êz being the unit vectors in the radial (r) and axial (z) directions respectively, p is the fluid pressure and ci (i = 1, 2) is the concentration of cation (K+) and anion (Cl−). The electric potential is denoted by V and ρ, μ, ε are the density, dynamic viscosity and permittivity of the solution respectively. The diffusivity of the ith species is Di and zi is the valence (z1 = 1 and z2 = −1 for KCl). The flux of species i is denoted by Ni and consists of contributions from diffusion, electrophoresis and convection. The ion mobility (ui) in the Nernst–Planck model obeys the Einstein relation [37, 38] ui = Di/(kBT) where kB is the Boltzmann constant and T is the absolute temperature, taken to be 300 K. In the membrane domain, we solve the Laplace equation,
| (6) |
where εs is the permittivity of the membrane material.
The boundary conditions for the system are as follows: assuming the reservoirs have a much larger volume than the pore, at BC and FG, the concentration gradient ∂ci/∂r, the radial velocity u and the radial electric field −∂V/∂r are set to zero. At AB and GH, V = ± ΔV/2 respectively and ci is set equal to the bulk concentration c0 while fluid pressure p is set to a constant value (P0). At the membrane surfaces CD, DE and EF a no–penetration condition is used for ions while the no–slip condition applies for the flow. Applying the Gauss theorem in an infinitely thin control volume across the surface, we get the jump condition for normal component of the electric field (En) which is related to the surface charge density (Σ) as [εEn] = Σ. The tangential component of the field (Et) is continuous, [Et] = 0. Here the brackets [ ] indicate the jump in the quantity enclosed across the membrane.
We use the finite element package COMSOL MULTIPHYSICS to solve the NPP–Stokes system numerically. The triangular mesh is selected with refinement near the membrane surface CD, DE and EF to ensure that the Debye layer is well resolved. The refinement parameter is set such that the maximum mesh size in this region never exceeds one sixth the Debye length. The results have been checked to ensure mesh independence. Small local fillets are used at D and E to remove the sharp corners. In a related paper by Yossifon et al [22] finite element simulations are used to study a set up very similar to ours. However, they decouple the electrostatics and ion transport problems from the fluid flow by neglecting the convective flux in their ion transport equations. We do not introduce such an approximation.
2.2. Dimensionless form
Results in this paper are reported in terms of dimensional quantities in order to facilitate correspondence with the experimental literature. Nevertheless, we present the dimensionless form of the equations here in order to identify the principal dimensionless parameters that govern the physical behavior. We use the bulk concentration c0 as the scale for ci. Electric potential is scaled with kBT/e. The reference length scale is chosen as the pore radius, R. Normalizing the velocity, u, with U0 = D1/R and pressure, p, with μU0/R, we get the dimensionless form of the governing equations:
| (7) |
| (8) |
| (9) |
| (10) |
where η = λD/R and ξ = (c0kBTR2)/(D1μ), where λD, the Debye length, is defined as . All the dimensionless variables and derivatives are superscripted with *.
Two dimensionless parameters emerge. The first, η = λD/R is the ratio between Debye length and the length scale R. It is an indication of how thin the Debye layer is in comparison with the geometric scale. If η is small, meaning that the Debye layer is thin relative to the geometric length scale, the right hand side of the Poisson equation (10) will be close to zero implying that the electrolyte is close to being electroneutral. Conversely, if η ~ 1, as is expected in most nanofluidic systems, Debye layers would overlap within the nanopore. The second dimensionless parameter is
| (11) |
where um,1 is the mobility of cations. Multiplying by the factor eE0 in both the numerator and denominator (E0 representing the strength of the applied electric field)
| (12) |
Here um,1eE0 is the velocity a K+ ion acquires under E0, or the electrophoretic velocity. The quantity c0eR2E0/μ also has a dimension of velocity and can be interpreted as the velocity the fluid acquires under E0 because of the space charge density it carries, or an electroosmotic velocity. Thus, ξ is a ratio between the two velocities representing electrophoretic and electroosmotic effects. It could also be related to the electric Reynolds number RE = ξ−1, defined as the ratio of the time scale of charge convection by flow to a charge relaxation time set by Ohmic conduction [39]. For R = 2.5 nm and c0 = 0.1 M, η ≈ 0.4 and ξ ≈ 0.9, indicating that both finiteness of the Debye length and convective transport needs to be taken into account.
3. Results
The results of the simulation depend on the geometry of the system (R, L and LR), the bulk salt concentration c0, the membrane surface charge density Σ and applied voltage bias ΔV. In this paper we fix the geometry of the nanopore system. We simulate a system corresponding to R = 2.5 nm and L = 5 nm. LR is set to be 10L to make sure it is large enough compared to the pore. The bulk concentration c0, surface charge density Σ and external voltage ΔV are varied. Other physical properties are as follows. The relative permittivity of fluid and membrane domains are respectively 80 (for water) and 3.9 (for silica). Ion diffusivity D1 = 1.95 × 10⁻⁹ m2/s while D2 = 2.03 × 10⁻⁹ m2/s. Table 1 lists all the parameters used in our simulations.
Table 1.
Parameters used in the simulations
| Geometry | Physical | Relative permittivity | Diffusivity (10−9 m2/s) | |||
|---|---|---|---|---|---|---|
| R(nm) | L(nm) | c0(M) | ΔV(V) | Σ(C/m2) | ||
| 2.5 | 5 | 0.001 | -2.0 to 2.0 | -0.01 | 80(silica) | 1.95(K+) |
| 0.01 | 0 | 3.9(water) | 2.03(Cl−) | |||
| 0.1 | 0.01 | |||||
| 1.0 | ||||||
3.1. Concentration, electric field and flow field
The concentration distribution, electric field and flow field are shown in Figures 2,3 and 4 for some typical parameters. The figures correspond to a surface charge Σ =-0.01C/m2, ΔV =0.4 V and c0 =0.1 M. The surface charge density of silica in electrolytes could vary from 0 to -0.1 C/m2 under different conditions [40].
Figure 2.
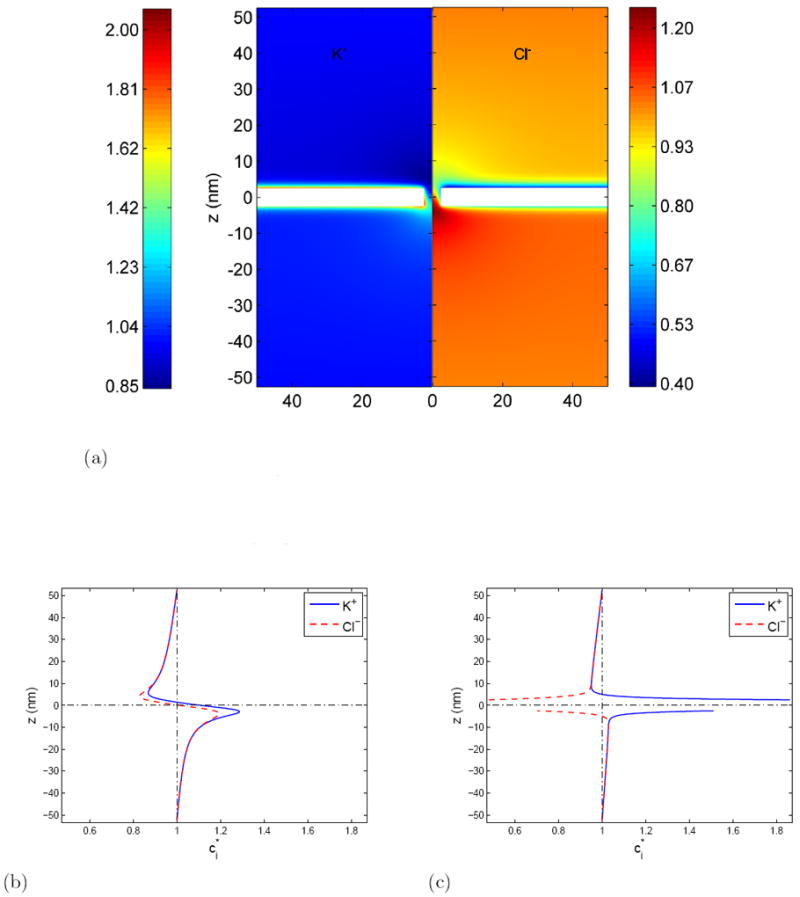
Equilibrium ionic distributions in the nanopore system. The parameters are: Σ =-0.01 C/m2 ΔV =0.4 V and c0 =0.1 M.
(a) The steady state concentration distribution (normalized by the bath concentration, c0) in the nanopore system. The system is axisymmetric. For convenience, the left panel shows the concentration distribution of potassium ions, K+ and the right panel is used for chloride ions, for Cl−.
(b) Normalized ion concentrations along line r = 0 (pore center line)
(c) Normalized ion concentrations along line r = 30 nm (faraway from pore)
Figure 3.
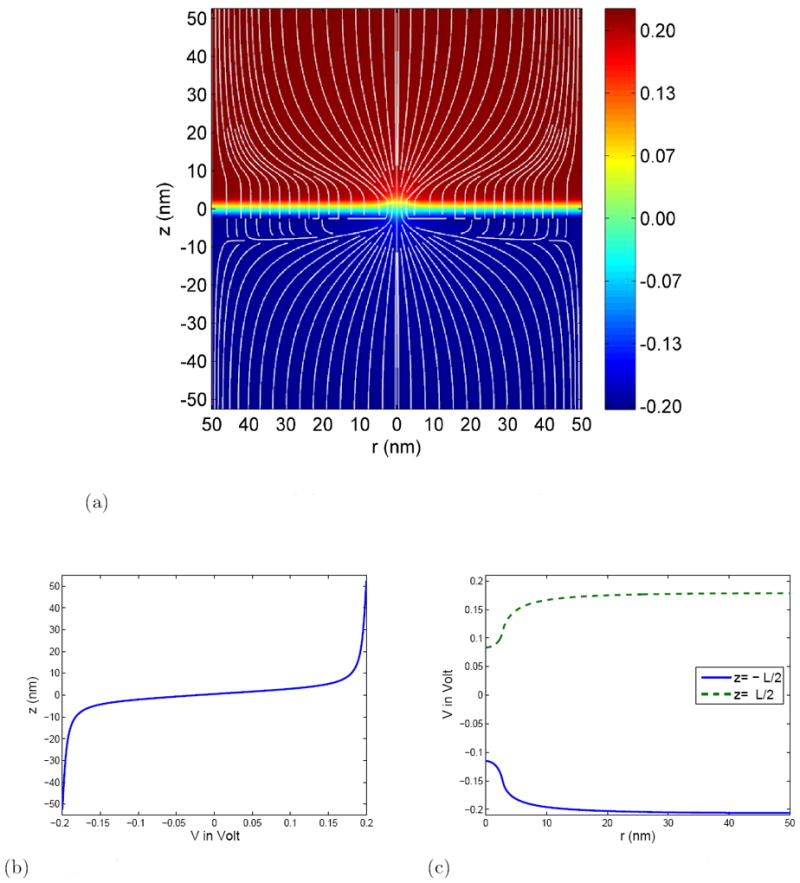
The electric potential distribution in the nanopore system. Parameters are, Σ =-0.01 C/m2 ΔV =0.4 V and c0 =0.1 M.
(a) The electric potential distribution. The numerical values in the color map are in Volt and field lines are shown in white.
(b) Distribution of the electric potential along the z–axis.
(c) The radial distribution of the electric potential along the upper and lower membrane surface (z = ±L/2).
Figure 4.
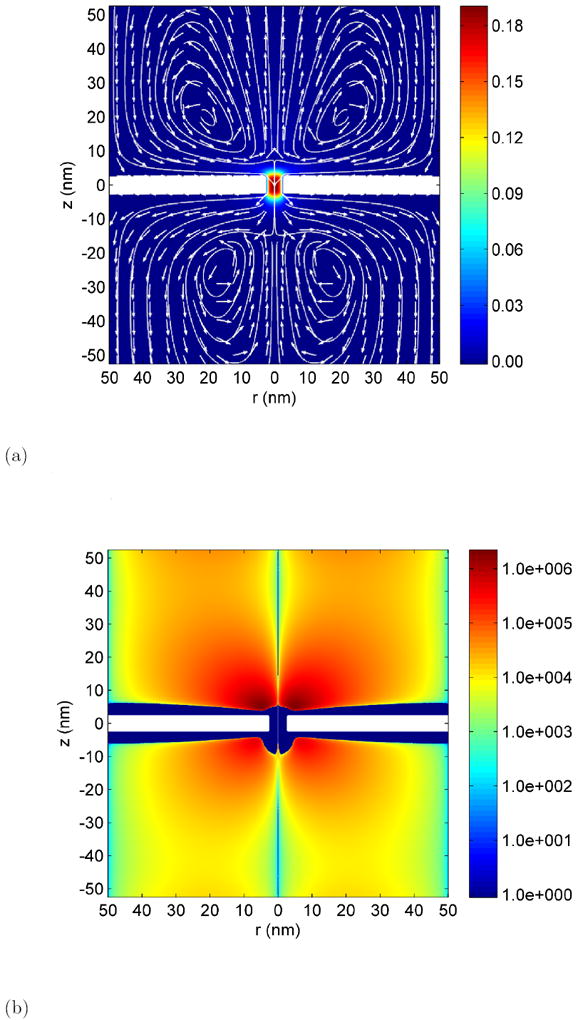
Hydrodynamic flow in the nanopore system. Parameters are Σ =-0.01 C/m2 ΔV =0.4 V and c0 =0.1 M.
(a) Flow field in the nanopore system. The color scale indicates magnitude of velocity in m/s. White lines are streamlines and arrows indicate the flow direction.
(b) Vorticity in the azimuthal direction in units of 1/s. Note that the scale is logarithmic. The vorticity due to the shear in the Debye layer is indicated as a flat blue color and is not represented by the color scale. The vorticity in this zone is in the opposite direction and is much larger than the vorticity in the bath represented by the color scale.
The concentration distribution (Figure 2) for K+ and Cl− are determined by both, the applied field as well as the density of fixed charges on the membrane. If the membrane had no surface charge, the K+ ions would show an enhanced density on the z > 0 side of the membrane and a depletion on the z < 0 side. The negatively charged Cl− ions would show the opposite trend, so that the two Debye layers essentially form a parallel plate capacitor with a small leakage of current through the pore. On the other hand, in the absence of an applied external voltage, the membrane surface charge would form a Debye layer consisting primarily of counterions. The polarity of the space charges along the membrane surfaces are determined by these two competing effects. Due to the existence of a negative surface charge on the membrane, we expect the concentration of K+ ions on the z > 0 side to be enhanced relative to that of Cl− ions. This is indeed what is observed in Figure 2(b), 2(c). The relative importance of the membrane surface charge can be measured by the dimensionless parameter Σ* = ΣL/(εs ΔV) which represents the ratio of the intrinsic charge on the membrane to the surface charge induced by the applied field. For the situation shown in Figure 2, Σ* ≈ −0.1765.
The potential distribution in the vicinity of the pore is shown in Figure 3. Clearly most of the potential drop occurs across the membrane/pore area, as the pore has a much larger resistance than the electrolyte solution. Thus, the electric field is the strongest in the pore region and there is a strong convergence of the electric field lines towards the pore. However, there is also a “leakage” of field lines into the dielectric membrane due to the fact that the conductivity of the solution is not infinite, though the field near the surface is primarily radial. The local electric field is strongly affected by the surface charges, as can be seen from the field lines near the membrane on the z < 0 side.
The radial component of the electric field acting on the thin layer of induced charges, cause ions to move radially along the field creating electroosmotic flow. In the case depicted in Figure 4, this flow is directed inwards (towards the pore) on the z > 0 side of the membrane and outward (away from the pore) on the z < 0 side. Due to the large hydrodynamic resistance the pore cannot accommodate this large radial influx and thus, mass conservation drives an axial jet away from the pore as seen in Figure 4. The combination of the radial flow along the surface with the axial jet produces a toroidal vortex near the periphery of the pore. The existence of such a ‘corner vortex’ in the reservoir near the entrance of a micro/nano channel was discussed by Yossifon et al. [23, 22]. We also reported these vortices in our study of the graphene nanopore using MD simulations [36]. The flow vorticity which is entirely in the azimuthal direction is depicted in Figure 4(b). The vorticity in the Debye layer adjacent to the membrane is many orders of magnitude stronger than the toroidal vortex induced in the reservoir and is in the opposite direction. This Debye layer vorticity is not shown in Figure 4(b) for clarity. Also note that the vorticity scale is logarithmic.
3.2. Electrical characteristics of the nanopore
The passage of ions through the nanopore, generates a detectable electric current. The current–voltage relation of the nanopore at different bulk concentrations c0 (and thus different Debye lengths) is shown in Figure 5. The surface charge density is held fixed at Σ =-0.01 C/m2.
Figure 5.
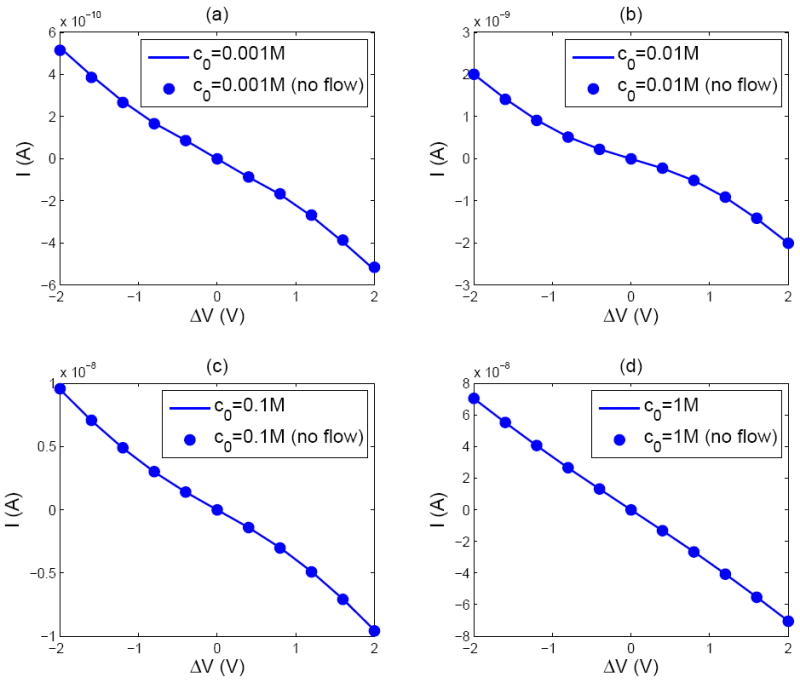
Current–voltage characteristics of the nanopore system for different bulk concentrations: (a) c0 =0.001 M (b) c0 =0.01 M (c) c0 =0.1 M (d) c0 = 1.0 M. The membrane charge is fixed at Σ =-0.01 C/m2.
From Figure 5(d) it is seen that the nanopore has an Ohmic behavior when the bulk ion concentration is high, c0 = 1 M. This is because at high bulk concentrations the Debye length is thin and the system can be regarded essentially as an electroneutral uniform Ohmic conductor. In this limit, the system may be regarded as a series connection of three separate resistors representing (i) the bulk resistance of the bath (ii) the access resistance of the pore and (iii) the pore resistance [41, 42]: Rtotal = Rbulk + Raccess + Rpore. The bulk resistance is and the access resistance is [43] Raccess/2 = ρb/(4R). Here ρb is the resistivity of the solution, which is related to the mobilities of ions, as .
The pore resistance is the electrical resistance (Rc) of the electrolyte within the electro-neutral bulk of the cylindrical pore in parallel with a second resistance (Rs) due to the surface conductance of the polarized Debye layer. Thus, Rpore = Rc Rs/(Rc + Rs) where Rc = (ρbL)/(π R2). To calculate the surface resistance we assume that the polarized region adjacent to the surface contains only counter–ions and the pore as a whole is electroneutral. Then, if the electrophoretic mobility of K+ is μK, the surface resistance can be calculated as: Rs = L/(2π Rμk|Σ|). Substituting the relevant numerical values, the resistance of the nanopore system when c0 =1 M is found to be Rtotal = 3.09×10⁷ Ω. The resistance calculated directly from the slope of the I-V curve in Figure 5(d) is Rtotal =2.89 ×10⁷ Ω, in accord with the simple lumped parameter model described above. Recently, Garaj et al [44] provided conductance measurements on nanopores with diameters ranging from 5 to 23 nm in a graphene sheet. They reported good agreement with calculations based on a model that regarded the electrolyte as a homogeneous conductor. Our finding that the pore conductance at 1 molar salt may be calculated from the Ohmic model is in accord with their observations.
At lower ionic concentrations the I–V curves in Figure 5(a)-(c) show nonlinear behavior. However, the nonlinearity is weak and does not show the classic behavior of a limiting current leading to an over limiting current with increasing voltages as found in perm selective membranes. This may seem surprising at first because a system of densely packed nanopores is indeed expected to behave like a perm selective membrane. The difference can be attributed to the radial inflow of ions that prevents the formation of a fully depleted CPL next to the membrane [22].
3.3. Hydrodynamic characteristics of the nanopore
The hydrodynamic flow is driven by the electrical forces acting on the space charge adjacent to the membrane. The space charge is induced by the fixed charge on the membrane as well as by the normal component of the applied electric field. Electroosmotic flow due to the former is expected to be a linear function of the applied voltage, however, the latter generates an ‘electroosmotic flow of the second kind’ in the terminology of Dukhin [33] and has a nonlinear dependence on the voltage. As shown in Figure 4, the fluid is driven radially along the membrane surface. Only a fraction of this radial flux crosses the membrane, the remainder being deflected into an axial jet perpendicular to the membrane. In the situation where the membrane has fixed charges, its Debye layer is enhanced on one side of the membrane and depleted on the other side by the space charge layer created by the applied field. Depending on the polarity and strength of the applied field, even the sign of the charge in the membrane’s intrinsic Debye layer could reverse (refer to supplementary material). Thus, the strengths of the axial jets on the two sides of the membrane would generally be different for a charged membrane and there could be a net fluid flux through the pore. Such a net flow however should not appear for a membrane with no surface charge. The fluid flux through the pore was calculated by integrating the velocity over the pore area and is shown as a function of the applied voltage in Figure 6. As expected, (a) the flux is always zero for an uncharged membrane (b) the flux is a nonlinear function of the applied voltage but may be regarded as approximately linear for weak applied voltages (c) the flux is an odd function of the applied voltage. The last observation may be explained very simply by the fact that the transformation ΔV → −ΔV is equivalent simply to a reversal of the z-axis and leaves the physical system unaffected. Figure 6 also shows that the Q − V characteristics are only weakly affected by the electrolyte concentration in the bath (c0) which sets the Debye length λD. This is because the vortex in the reservoir is determined by the strength of the Helmholtz-Smoluchowski slip velocity at the edge of the Debye layer and the slip velocity itself is independent of the Debye length. In the context of Figure 4(b), changes in the Debye layer thickness would change the width of the blue zone but leaves the toroidal vortex largely unaffected.
Figure 6.
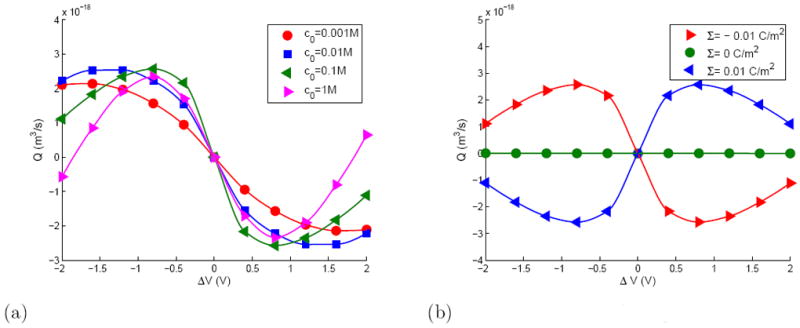
Flow rate through the nanopore at fixed surface charge (left) and fixed salt concentration (right).
(a) Total flow rate through nanopore when Σ =-0.01 C/m2
(b) Total flow rate through nanopore when c0 =0.1 M
3.4. Hydrodynamics induced ion selectivity
Many biological nanopores display ion selectivity beyond what might be expected solely based on pore size [45]. The presence of a net hydrodynamic flow through a nanopore in a charged membrane could result in an ion selectivity due to the competing effects of electrophoresis and the convective flux due to the flow. This is because only the former is sensitive to the ionic charge.
To demonstrate this effect we introduced a third charged species (concentration c3) of a different valence z3 into the bottom reservoir. The diffusivity of the added species is taken as D3 = 4.6 ×10⁻¹¹ m2/s, which is in the typical range of values seen in biological macromolecules and polymers. The concentration of c3 is held fixed at c3 = 0.001 M at the lower boundary and is set to zero at the upper boundary. Since this concentration is very low compared to the bulk concentration of the carrier electrolytes (0.1 M), it can be considered a trace species and its effect on the electric field and hydrodynamic flow neglected. Thus, we evolved c3 as a passive scalar using the previously computed electric field and fluid velocity. The remaining parameters in the simulation are ΔV = 0.5 V and Σ = −0.01 C/m2. The flux of the added species through the pore is shown in Figure 7 as a function of the ion valence z3. The flux is of course zero if z3 > 0 as cations are driven away from the pore and diffusive flux is negligible. However, for anions, due to the competing effects of electrophoresis and convection, ions with valence in the range 0 > z3 > −1 are also excluded. If an array of nanopores is fabricated to bridge a pair of parallel microfluidic channels, the pores will behave as a permselective membrane blocking all ions for which z3 > −1. Such a system could therefore be used to separate biomolecules, for example proteins, using essentially the same principle as is used in the desalination of water [46]. Furthermore, the permselective properties can be modulated by changing the voltage applied between the microchannels. A similar effect was demonstrated by Karnik et al [47] to make a gate controlled ‘nanofluidic transistor’ though they attributed the selective properties to the Donnan potential in the channel.
Figure 7.
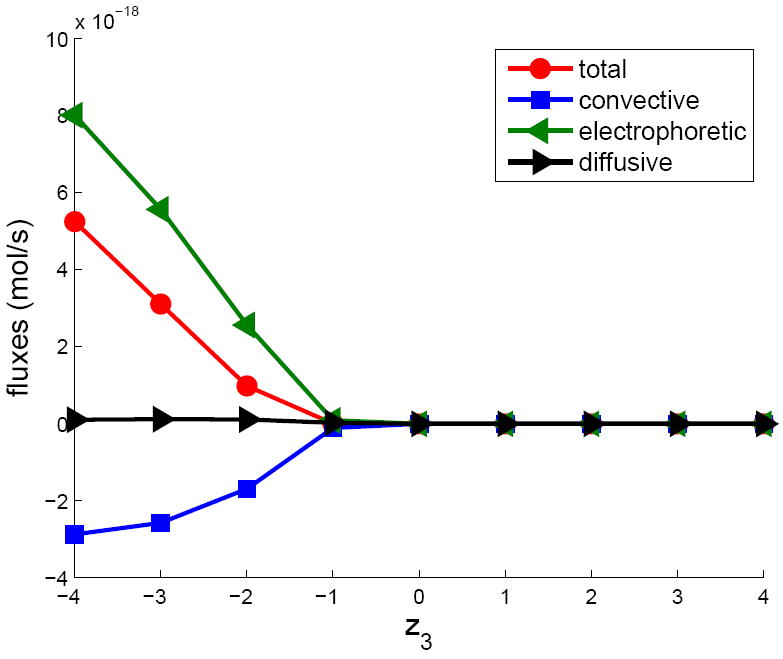
The dependence of the various flux contributions to the total flux for a charged trace species as a function of its valence (z3). When z3 < 0, the convective and electrophoretic components of the flux are comparable but in opposite directions. Here c0 =0.1M, Σ =-0.01 C/m2 and ΔV =0.5 V.
4. Discussion
In this paper, we present a continuum level description of a problem that we had studied previously using MD simulation [36], namely, hydrodynamics and ion transport through a nanopore in a membrane. We find qualitative agreement of the two simulations: similar concentration polarization, corner vortices, nonlinear current–voltage characteristics as well as net flow through the nanopore. However, in the present paper, it is the membrane surface charge that creates the asymmetry responsible for the net flow. In our MD simulation, the membrane had no charge, however, the asymmetric space charge was due to a difference in mobilities between sodium and chlorine ions. Here we use potassium and chlorine ions, that have almost identical mobilities. Thus, a net flow can be generated by any condition that induces an asymmetry between the two sides of the membrane.
There are however some effects that are only captured in the MD simulation but not in our continuum simulation. One such effect is the clearly observable increase in density of water due to preferential alignment of the water molecules in the large electric field close to the pore. Since the continuum simulations are based on the incompressible fluid equations, this effect is a priori excluded. The ionic distributions in the MD simulations show a peak a few ionic radii from the surface. This is due to a steric effect: ions cannot get closer than an ionic radius of the surface. Clearly this effect is not observable in the continuum version.
The transport of ionic species is governed by the Nernst–Planck equation. The total flux consists of the diffusive flux, electrophoretic flux and electroosmotic flux. The relative importance of electrophoresis and electroosmosis can be determined by comparing the electrophoretic velocity and electroosmotic velocity. Both velocities reach their peak value within the pore region where the electric field is largest. In the present study the peak electrophoretic velocity is υep ≈ 7.7 m/s. From Figure 4, the maximum electroosmotic velocity is only about 0.2 m/s. Thus, transport of ions in the pore is dominated by electrophoresis not electroosmosis as argued by Chang et al. [17]. The vortical flow could however affect the current-voltage characteristics indirectly [22, 17, 30] by modifying the ionic distributions at the pore entrance. In the current study, this effect is not of significant magnitude. The vortical flow induced in the bath could nevertheless have other significant effects. It could compete with electrophoretic transport of low mobility species such as macromolecules, as seen in Figure 7. Another possibly significant effect that we did not study in this paper is the translocation of polyelectrolytes across pores, a very important biological process [48] that has also received much attention as a biotechnology tool [49]. Even though the translocation time of the polymer is set by the electric field within the pore and the pore geometry [18, 19, 20] the rate of capture of polymers by the pore can be greatly enhanced by the toroidal vortex in the bath. This is because the polymer moves towards the pore by diffusion and one end of the polymer must insert into the pore by the process of reptation before the electric field can take hold and start the translocation. Both of these processes are very slow. The vortex can convect the polymer towards the pore as well as provide the shear needed for it to undergo a coil-stretch transition thus greatly helping the process of insertion in the pore.
In conclusion, we can say that except for certain very specific features, most properties of the nanopore system are adequately described by the continuum NPP-Stokes model for fluid and ion transport. This is encouraging, because such continuum simulations are many orders of magnitude cheaper than the corresponding MD simulations and therefore represent a good compromise between accuracy and computational expenses at the mesoscale.
Supplementary Material
Acknowledgments
This work was supported by grant number R01HG004842 from the National Human Genome Research Institute, National Institutes of Health. One of us (SG) acknowledges support from the Leverhulme Trust (UK).
References
- 1.Doyle Declan A, Cabral João Morais, Pfuetzner Richard A, Kuo Anling, Gulbis Jacqueline M, Cohen Steven L, Chait Brian T, MacKinnon Roderick. The structure of the potassium channel: Molecular basis of K+ conduction and selectivity. Science. 1998;280(5360):69–77. doi: 10.1126/science.280.5360.69. [DOI] [PubMed] [Google Scholar]
- 2.Rhee Minsoung, Burns Mark A. Nanopore sequencing technology: research trends and applications. Trends in Biotechnology. 2006 Dec;24(12):580–586. doi: 10.1016/j.tibtech.2006.10.005. [DOI] [PubMed] [Google Scholar]
- 3.Venkatesan Bala Murali, Bashir Rashid. Nanopore sensors for nucleic acid analysis. Nature Nano. 2011 Oct;6(10):615–624. doi: 10.1038/nnano.2011.129. [DOI] [PubMed] [Google Scholar]
- 4.Branton Daniel, Deamer David W, Marziali Andre, Bayley Hagan, Benner Steven A, Butler Thomas, Di Ventra Massimiliano, Garaj Slaven, Hibbs Andrew, Huang Xiaohua, Jovanovich Stevan B, Krstic Predrag S, Lindsay Stuart, Ling Xinsheng Sean, Mastrangelo Carlos H, Meller Amit, Oliver John S, Pershin Yuriy V, Ramsey J Michael, Riehn Robert, Soni Gautam V, Tabard-Cossa Vincent, Wanunu Meni, Wiggin Matthew, Schloss Jeffery A. The potential and challenges of nanopore sequencing. Nature Biotech. 2008;26(10):1146–1153. doi: 10.1038/nbt.1495. [DOI] [PMC free article] [PubMed] [Google Scholar]
- 5.Roux Benoît, Allen Toby, Bernèche Simon, Im Wonpil. Theoretical and computational models of biological ion channels. Quarterly Reviews of Biophysics. 2004;37(01):15–103. doi: 10.1017/s0033583504003968. [DOI] [PubMed] [Google Scholar]
- 6.Demming Anna. Nanopores—the “holy grail” in nanotechnology research. Nanotechnology. 2012 Jun;23(25):250201–250201. doi: 10.1088/0957-4484/23/25/250201. [DOI] [PubMed] [Google Scholar]
- 7.Liu Ling, Chen Xi, Lu Weiyi, Han Aijie, Qiao Yu. Infiltration of Electrolytes in Molecular-Sized Nanopores. Physical Review Letters. 2009 May;102(18):184501. doi: 10.1103/PhysRevLett.102.184501. [DOI] [PubMed] [Google Scholar]
- 8.Qiao Yu, Liu Ling, Chen Xi. Pressurized liquid in nanopores: a modified Laplace-Young equation. Nano letters. 2009 Mar;9(3):984–8. doi: 10.1021/nl8030136. [DOI] [PubMed] [Google Scholar]
- 9.Lu Weiyi, Kim Taewan, Han Aijie, Qiao Yu. Electrically controlling infiltration pressure in nanopores of a hexagonal mesoporous silica. Materials Chemistry and Physics. 2012 Mar;133(1):259–262. [Google Scholar]
- 10.Kong Xinguo, Qiao Yu. An electrically controllable nanoporous smart system. Journal of Applied Physics. 2006;99(6):064313. [Google Scholar]
- 11.Ai Ye, Qian Shizhi. Direct numerical simulation of electrokinetic translocation of a cylindrical particle through a nanopore using a Poisson-Boltzmann approach. Electrophoresis. 2011 Apr;32(9):996–1005. doi: 10.1002/elps.201000503. [DOI] [PubMed] [Google Scholar]
- 12.Ai Ye, Qian Shizhi. Electrokinetic particle translocation through a nanopore. Physical chemistry chemical physics : PCCP. 2011 Mar;13(9):4060–71. doi: 10.1039/c0cp02267e. [DOI] [PubMed] [Google Scholar]
- 13.Ai Ye, Zhang Mingkan, Joo Sang W, Cheney Marcos A, Qian Shizhi. Effects of Electroosmotic Flow on Ionic Current Rectification in Conical Nanopores. Journal of Physical Chemistry C. 2010:3883–3890. [Google Scholar]
- 14.Stein Derek, Deurvorst Zeno, van der Heyden Frank HJ, Koopmans Wiepke JA, Gabel Alan, Dekker Cees. Electrokinetic Concentration of DNA Polymers in Nanofluidic Channels. Nano Letters. 2010 Feb;10(3):765–772. doi: 10.1021/nl902228p. [DOI] [PubMed] [Google Scholar]
- 15.Lee Choongyeop, Joly Laurent, Siria Alessandro, Biance Anne-Laure, Fulcrand Rémy, Bocquet Lydéric. Large apparent electric size of solid-state nanopores due to spatially extended surface conduction. Nano letters. 2012 Aug;12(8):4037–44. doi: 10.1021/nl301412b. [DOI] [PubMed] [Google Scholar]
- 16.Liu Hui, Qian Shizhi, Bau Haim H. The effect of translocating cylindrical particles on the ionic current through a nanopore. Biophysical journal. 2007 Feb;92(4):1164–77. doi: 10.1529/biophysj.106.089268. [DOI] [PMC free article] [PubMed] [Google Scholar]
- 17.Chang Hsueh-Chia, Yossifon Gilad, Demekhin Evgeny A. Nanoscale Electrokinetics and Microvortices: How Microhydrodynamics Affects Nanofluidic Ion Flux. Annual Review of Fluid Mechanics. 2011 [Google Scholar]
- 18.Ghosal Sandip. Electrophoresis of a polyelectrolyte through a nanopore. Physical Review E. 2006;74(4):41901. doi: 10.1103/PhysRevE.74.041901. [DOI] [PubMed] [Google Scholar]
- 19.Ghosal Sandip. Effect of salt concentration on the electrophoretic speed of a polyelectrolyte through a nanopore. Physical Review Letters. 2007;98(23):238104. doi: 10.1103/PhysRevLett.98.238104. [DOI] [PubMed] [Google Scholar]
- 20.Ghosal Sandip. Electrokinetic-flow-induced viscous drag on a tethered DNA inside a nanopore. Physical Review E. 2007;76(6) doi: 10.1103/PhysRevE.76.061916. [DOI] [PubMed] [Google Scholar]
- 21.van Dorp Stijn, Keyser Ulrich F, Dekker Nynke H, Dekker Cees, Lemay Serge G. Origin of the electrophoretic force on DNA in solid-state nanopores. Nature Physics. 2009 Mar;5(5):347–351. [Google Scholar]
- 22.Yossifon Gilad, Mushenheim Peter, Chang Hsueh-Chia. Controlling nanoslot overlimiting current with the depth of a connecting microchamber. Europhysics Letters. 2010;90(6):64004. [Google Scholar]
- 23.Yossifon Gilad, Chang Hsueh-Chia. Selection of Nonequilibrium Overlimiting Currents: Universal Depletion Layer Formation Dynamics and Vortex Instability. Physical Review Letters. 2008;101(25):254501. doi: 10.1103/PhysRevLett.101.254501. [DOI] [PubMed] [Google Scholar]
- 24.Chang Hsueh-Chia, Yossifon Gilad. Understanding electrokinetics at the nanoscale: A perspective. Biomicrofluidics. 2009;3(1) doi: 10.1063/1.3056045. [DOI] [PMC free article] [PubMed] [Google Scholar]
- 25.Levich Veniamin G. Physicochemical hydrodynamics. New York: Prentice Hall; 1962. [Google Scholar]
- 26.Rubinstein Isaak, Shtilman Leonid. Voltage against current curves of cation exchange membranes. Journal of the Chemical Society, Faraday Transactions 2: Molecular and Chemical Physics. 1979;75:231–246. [Google Scholar]
- 27.Ben Y, Chang Hsueh-Chia. Nonlinear Smoluchowski slip velocity and micro-vortex generation. Journal of Fluid Mechanics. 2002;461:229–238. [Google Scholar]
- 28.Yariv Ehud. Asymptotic current-voltage relations for currents exceeding the diffusion limit. Physical Review E. 2009 Nov;80(5) doi: 10.1103/PhysRevE.80.051201. [DOI] [PubMed] [Google Scholar]
- 29.Rubinstein Isaak, Zaltzman Boris. Electro-osmotically induced convection at a permselective membrane. Physical Review E. 2000;62(2):2238–2251. doi: 10.1103/physreve.62.2238. [DOI] [PubMed] [Google Scholar]
- 30.Zaltzman Boris, Rubinstein Isaak. Electro-osmotic slip and electroconvective instability. Journal of Fluid Mechanics. 2007;579:173–226. [Google Scholar]
- 31.Yossifon Gilad, Mushenheim Peter, Chang Yu-Chen, Chang Hsueh-Chia. Nonlinear current-voltage characteristics of nanochannels. Physical Review E. 2009;79(4):46305. doi: 10.1103/PhysRevE.79.046305. [DOI] [PubMed] [Google Scholar]
- 32.Rubinstein Shmuel M, Manukyan Gor, Staicu Adrian, Rubinstein Issac, Zaltzman Boris, Lammertink Rob, Mugele Frieder, Wessling Matthias. Direct Observation of a Nonequilibrium Electro-Osmotic Instability. Physical Review Letters. 2008;101(23):236101. doi: 10.1103/PhysRevLett.101.236101. [DOI] [PubMed] [Google Scholar]
- 33.Dukhin Stanislav S. Electrokinetic phenomena of the second kind and their applications. Advances in Colloid and Interface Science. 1991 Mar;35(0):173–196. [Google Scholar]
- 34.Yossifon Gilad, Mushenheim Peter, Chang Yu-Chen, Chang Hsueh-Chia. Eliminating the limiting-current phenomenon by geometric field focusing into nanopores and nanoslots. Physical Review E. 2010;81(4):46301. doi: 10.1103/PhysRevE.81.046301. [DOI] [PubMed] [Google Scholar]
- 35.Yossifon Gilad, Frankel Itzchak, Miloh Touvia. On electro-osmotic flows through microchannel junctions. Physics of Fluids. 2006;18(11):117108. [Google Scholar]
- 36.Hu Guohui, Mao Mao, Ghosal Sandip. Ion transport through a graphene nanopore. Nanotechnology. 2012 doi: 10.1088/0957-4484/23/39/395501. [DOI] [PMC free article] [PubMed] [Google Scholar]
- 37.Einstein Albert. ber die von der molekularkinetischen theorie der wrme geforderte bewegung von in ruhenden flssigkeiten suspendierten teilchen. Annalen der Physik. 1905;322(8):549–560. [Google Scholar]
- 38.Ashcroft Neil W, Mermin N David. Solid state physics. New York: Holt, Holt, Rineheart and Winston; 1988. p. 826. [Google Scholar]
- 39.Feng James Q. Electrohydrodynamic behaviour of a drop subjected to a steady uniform electric field at finite electric reynolds number. Proceedings of the Royal Society of London Series A: Mathematical, Physical and Engineering Sciences. 1999;455(1986):2245–2269. [Google Scholar]
- 40.Rodrigues Flvio A, Monteiro Paulo JM, Sposito Garrison. Surface charge density of silica suspended in wateracetone mixtures. Journal of Colloid and Interface Science. 1999;211(2):408–409. doi: 10.1006/jcis.1998.5991. [DOI] [PubMed] [Google Scholar]
- 41.Kowalczyk Stefan W, Tuijtel Maarten W, Donkers Serge P, Dekker Cees. Unraveling Single-Stranded DNA in a Solid-State Nanopore. Nano Letters. 2010 Mar;10(4):1414–1420. doi: 10.1021/nl100271c. [DOI] [PubMed] [Google Scholar]
- 42.Smeets Ralph MM, Keyser Ulrich F, Krapf Diego, Wu Meng-Yue, Dekker Nynke H, Dekker Cees. Dependence of Ion Transport and DNA Translocation through Solid-State Nanopores. Nano Letters. 2005 Dec;6(1):89–95. doi: 10.1021/nl052107w. [DOI] [PubMed] [Google Scholar]
- 43.Hall James E. Access resistance of a small circular pore. The Journal of General Physiology. 1975;66 doi: 10.1085/jgp.66.4.531. [DOI] [PMC free article] [PubMed] [Google Scholar]
- 44.Garaj S, Hubbard W, Reina A, Kong J, Branton D, Golovchenko JA. Graphene as a subnanometre trans-electrode membrane. Nature. 2010;467(7312):190–193. doi: 10.1038/nature09379. [DOI] [PMC free article] [PubMed] [Google Scholar]
- 45.Hille Bertil. Ion channels of excitable membranes. Sunderland, Mass: Sinauer Associates, Inc; 1984. [Google Scholar]
- 46.Oren Yoram, Rubinstein Isaac, Linder Charles, Saveliev Galina, Zaltzman B, Mirsky Elena, Kedem Ora. Modified heterogeneous anion-exchange membranes for desalination of brackish and recycled water. Environmental Engineering Science. 2002 Nov-Dec;19(6):513–529. [Google Scholar]
- 47.Karnik Rohit, Fan Rong, Yue Min, Li Deyu, Yang Peidong, Majumdar Arun. Electrostatic control of ions and molecules in nanofluidic transistors. Nano Letters. 2005;5(5):943–948. doi: 10.1021/nl050493b. [DOI] [PubMed] [Google Scholar]
- 48.Shari Karim, Ghosal Sandip, Matouschek Andreas. The force exerted by the membrane potential during protein import into the mitochondrial matrix. Biophysical Journal. 2004;86(6):3647–3652. doi: 10.1529/biophysj.104.040865. [DOI] [PMC free article] [PubMed] [Google Scholar]
- 49.Bell Nicholas AW, Engst Christian R, Ablay Marc, Divitini Giorgio, Ducati Caterina, Liedl Tim, Keyser Ulrich F. Dna origami nanopores. Nano Letters. 2012;12(1):512–517. doi: 10.1021/nl204098n. [DOI] [PubMed] [Google Scholar]
Associated Data
This section collects any data citations, data availability statements, or supplementary materials included in this article.


