Abstract
Transcriptome dynamics in the longissimus muscle (LM) of young Angus cattle were evaluated at 0, 60, 120, and 220 days from early-weaning. Bioinformatic analysis was performed using the dynamic impact approach (DIA) by means of Kyoto Encyclopedia of Genes and Genomes (KEGG) and Database for Annotation, Visualization and Integrated Discovery (DAVID) databases. Between 0 to 120 days (growing phase) most of the highly-impacted pathways (eg, ascorbate and aldarate metabolism, drug metabolism, cytochrome P450 and Retinol metabolism) were inhibited. The phase between 120 to 220 days (finishing phase) was characterized by the most striking differences with 3,784 differentially expressed genes (DEGs). Analysis of those DEGs revealed that the most impacted KEGG canonical pathway was glycosylphosphatidylinositol (GPI)-anchor biosynthesis, which was inhibited. Furthermore, inhibition of calpastatin and activation of tyrosine aminotransferase ubiquitination at 220 days promotes proteasomal degradation, while the concurrent activation of ribosomal proteins promotes protein synthesis. Therefore, the balance of these processes likely results in a steady-state of protein turnover during the finishing phase. Results underscore the importance of transcriptome dynamics in LM during growth.
Keywords: longissimus muscle, intramuscular fat, growth, nutrition
Background
The application of microarrays for gene expression profiling of longissimus dorsi skeletal muscle (LM) of mature beef cattle is relatively new.1–3 Although useful data were generated from previous studies, they suffer from low biological replication, lack of a robust bioinformatics analysis, and were static in nature as the animals were not sampled throughout their lifespan. Therefore, the dynamism of the transcriptome of LM from weaning until harvest in beef cattle remains largely unknown. Such information is valuable to identify cellular adaptations that may be more susceptible to particular diets (eg, high-starch vs. high-fiber diets) during a given stage of growth (eg, the growing phase vs. the finishing phase), and potentially serve as targets for enhancing the quality and yield grade of the carcass at slaughter.
In the present study, we performed a comprehensive analysis of the transcriptome as it relates to the dynamics of canonical pathways and biological functions in LM of Angus steers during a period when muscle mass accretion predominates, the growing phase (approximately 120 days from early weaning), and subsequently during a period when fat deposition is substantial, the finishing phase (from the end of the growing phase through to slaughter), using a novel bioinformatics approach, the dynamic impact approach (DIA).4,5 The specific objectives of the present study were to determine (1) the metabolic pathways most impacted during the growing and finishing phases; (2) the pathways that are most impacted and their extent of activation or inhibition; and (3) distinguish the key biological processes that govern the development of skeletal muscle tissue, including intramuscular fat deposition. DIA relies on the Kyoto Encyclopedia of Genes and Genomes (KEGG) database and the Database for Annotation, Visualization and Integrated Discovery (DAVID). The former was used to determine the most impacted canonical pathways, while DAVID was used to determine the most relevant subcategories within the 3 gene ontology domains (cellular component, molecular function, and biological processes). The InterPro database of DAVID was also used to identify domains and functional sites within a protein with high impact in the analysis.
Methods
Experimental animals, diets, and sampling
Complete details of the animal experiment have been reported previously.6 Briefly, fourteen purebred Angus steer calves (7 animals per treatment) from the University of Illinois, Urbana-Champaign, beef cattle herd were utilized to examine the effects of two different levels of starch in the diet. Early weaning was performed at 155 ± 10 days after birth. The steers were randomly assigned to a high-starch (5,980 kJ/kg diet DM) or a low-starch (4,970 kJ/kg diet DM) diet for 120 days. At the end of the growing phase, steers on each group were gradually adapted to a common high-grain finishing diet containing 6,030 kJ calculated net energy for gain per kg DM. All steers received an implant of 20 mg oestradiol benzoate and 200 mg progesterone (Component E-S; Vetlife Inc., West Des Moines, IA, USA) after the biopsy on day 60. Muscle biopsies were collected at 0, 60, 120, and 220 days relative to the start of feeding treatment diets (ie, at a range in age of 155 ± 10 days). The complete procedures for biopsy, RNA extraction, and microarray analysis have been reported previously.7,8
Microarrays and data analysis
The details of the microarray platform used and the hybridization procedure have been reported previously.5 Data from the microarray analysis were normalized for dye and microarray effects (ie, Lowess normalization and array centering) and used for statistical analysis. Data were analyzed using the Proc MIXED procedure of SAS (SAS, SAS Inst. Inc., Cary, NC). Fixed effects were diet, day (0, 60, 120, 220), and dye (Cy3, Cy5). Random effects included steer and microarray. Raw P values were adjusted using Benjamini and Hochberg’s false discovery rate (FDR).9 The microarray data files are deposited at NCBI (GSE48136).
Dynamic impact approach (DIA)
Bioinformatics analysis of microarray data was performed using DIA10 and information from the freely available online databases KEGG and DAVID (v6.7). A list of protein or gene identifiers (Entrez Gene IDs) was uploaded all at once to extract and summarize functional annotations associated with groups of genes or with each individual gene. Details of the DIA approach and its validation have been reported previously.5,10
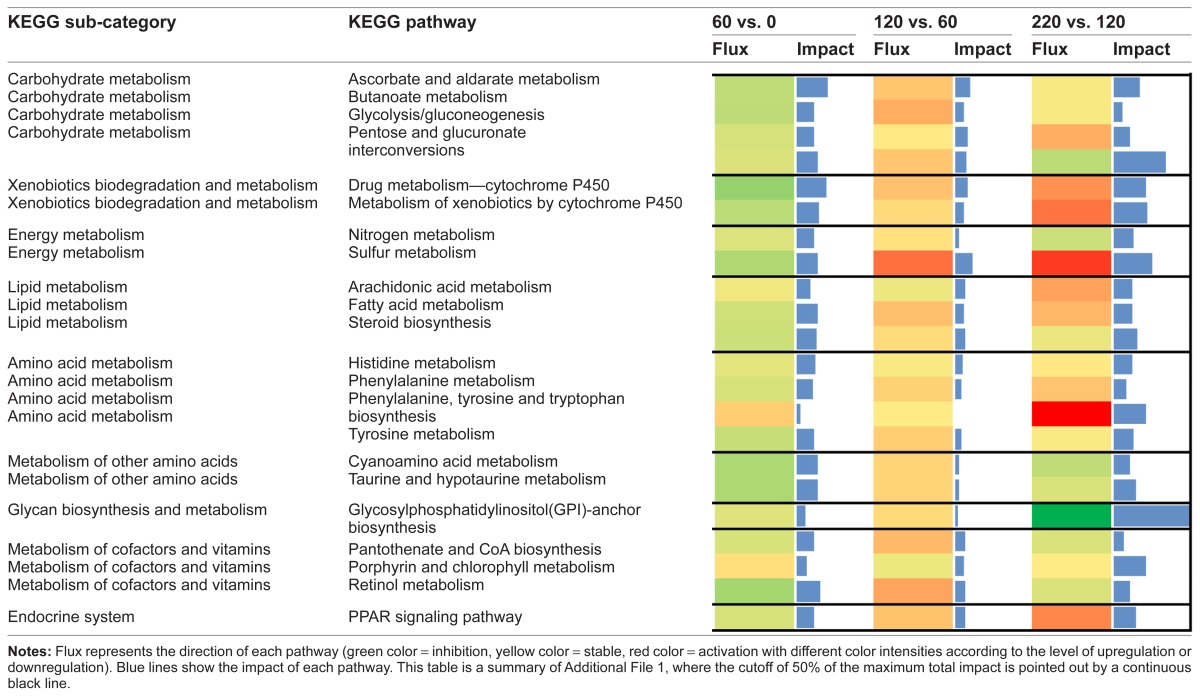
The interpretation of the bioinformatics analysis was based on results from KEGG pathways focusing on those most impacted. The impact provides an evaluation of the relative importance of the change (flux) in a pathway and/or function in response to a treatment and/or change in physiological state.10 The most impacted pathways were obtained by evaluating those pathways with calculated impact values above 50% of the total impact value of the top-impacted pathway independently at 60 vs. 0 (early growing phase), 120 vs. 60 (late growing phase), and 220 vs. 120 (finishing phase). It should be noted that this approach was problematic for data obtained during the finishing phase, 220 vs. 120, because of the markedly high level of impact for the glycosylphosphatidylinositol (GPI)-anchor biosynthesis KEGG pathway. Therefore, to avoid a bias, only pathways at 220 vs. 120 with impact values similar to those in other time comparisons are discussed (Table 2). The direction of the impact (flux) was calculated according to our published procedure,10 considering negative flux values as inhibited or downregulated and positive flux values as activated or upregulated. Additional File 1 contains information on flux and impact values for each pathway, including the cut-off impact value above which pathways were considered most impacted and used for biological interpretation.
Table 2.
Results of flux and impact of the KEGG Pathways with impact value above the 50% of the maximum total impact of each time comparison (early growing phase (60 vs. 0), late growing phase (120 vs. 60) and finishing phase (220 vs. 120).
Results
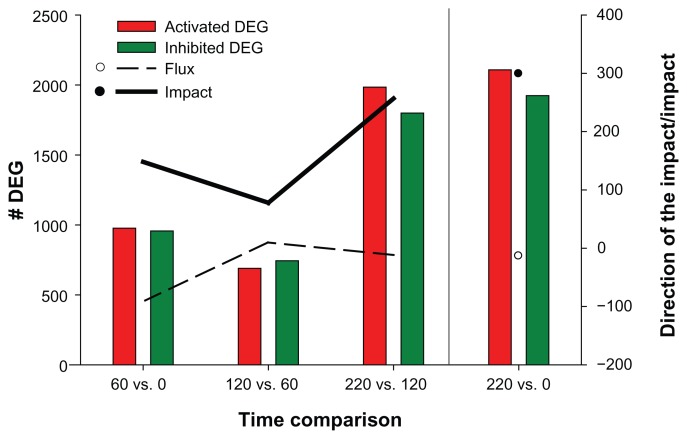
There was no statistically significant effect of treatment therefore the present analysis is centered on the DIA analysis of differentially expressed genes (DEGs) due to time. Results for total number of DEGs due to time are presented in Figure 1. The highest number (P value < 0.05; FDR < 0.01) of downregulated (1,799) and upregulated (1,985) DEGs was observed during the finishing phase (220 vs. 120). The lowest number (P value < 0.05; FDR < 0.01) of DEGs was observed at 120 vs. 60, with 744 downregulated and 690 upregulated genes. The comparison of DEGs at the end of the study (day 220) relative to start of the study resulted in the largest number of DEGs (4,032). The percentage of DEGs on the microarray platform which belong to a given pathway, is one of the values used to calculate the impact.10 This is one reason the impact of the metabolism KEGG category follows a similar pattern as the total number of DEGs at each time comparison (Fig. 1).
Figure 1.
Impact and direction of the impact of the Metabolism KEGG Category, total number of Differentially Expressed Genes (DEG) due to time on experiment for each time comparison. Total number of genes = 13,153 (P value < 0.05; FDR < 0.01).
Most impacted pathways
When only the growing phase was considered, Ascorbate and aldarate metabolism (Carbohydrate Metabolism subcategory), Drug metabolism—cytochrome P450 (Xenobiotics Biodegradation and Metabolism subcategory), and Retinol metabolism (Metabolism of Cofactors and Vitamins subcategory) were the most impacted and inhibited pathways. When only the finishing phase was considered (220 vs. 120), GPI-anchor biosynthesis (Glycan Biosynthesis and Metabolism subcategory), Pentose and glucuronate interconversions (Carbohydrate Metabolism subcategory), and Sulfur metabolism (Energy Metabolism subcategory), in that order, were the most impacted metabolic pathways. The first two pathways were inhibited while the last one was activated (Table 2). It is important to mention that during the finishing phase, two glycoproteins present in the GPI-anchor biosynthesis pathway, glycoprotein phospholipase D (IPR001028 or GPLD1) and phosphatidylinositol glycan anchor biosynthesis, class Q (PIGQ), were markedly downregulated resulting in the Glycan Biosynthesis and Metabolism KEGG subcategory having the highest impact level compared with all other pathways in the present study (Additional File 1).
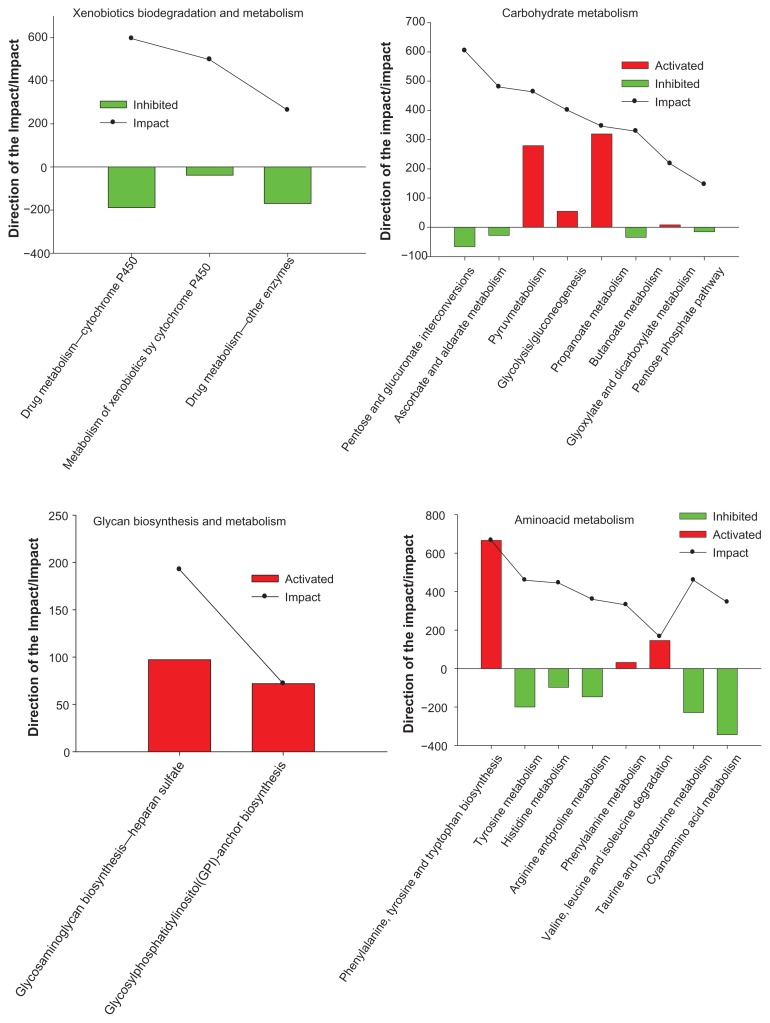
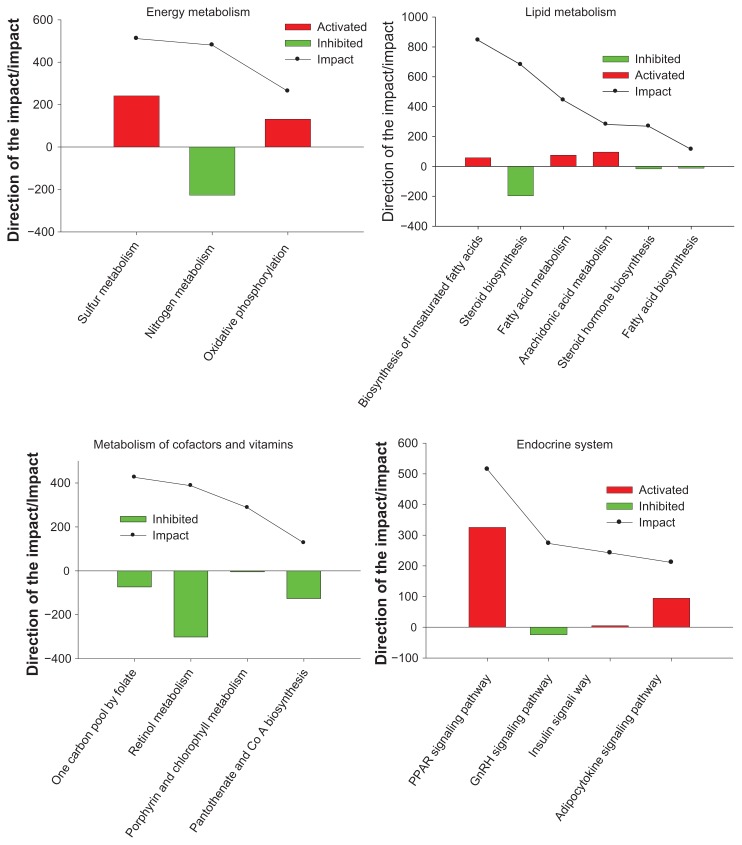
Regarding the overall KEGG Metabolism Category results (220 vs. 0), the Drug Metabolism-Cytochrome P450 pathway within the Xenobiotics Biodegradation and Metabolism pathway, the Pentose and glucuronate interconversions pathway within the Carbohydrate Metabolism pathway, and the One carbon pool by folate pathway within the Metabolism of cofactors and vitamins pathway were the most impacted and inhibited. Moreover, Glycosaminoglycan biosynthesis-heparan sulfate pathway within the Glycan Biosynthesis and Metabolism pathway, and the Phenylalanine, tyrosine and tryptophan biosynthesis pathway within the Amino acid Metabolism were the most impacted and activated (Figs. 3 and 4).
Figure 3.
Results of the most impacted pathways during the growing phase and finishing phase (220 vs. 0) uncovered by the Dynamic Impact Approach (DIA) based on Kyoto Encyclopedia of Genes and Genomes (KEGG) Pathways database analysis of the bovine muscle transcriptome. Columns represent the direction of the pathway (green color = inhibition, red color = activation). Continuous black lines show the impact of each pathway (P value < 0.05; FDR < 0.01).
Figure 4.
Results of the most impacted pathways during the growing phase and finishing phase (220 vs. 0) uncovered by the Dynamic Impact Approach (DIA) based on Kyoto Encyclopedia of Genes and Genomes (KEGG) Pathways database analysis of the bovine muscle transcriptome. Columns represent the direction of the pathway (green color = inhibition, red color = activation). Continuous black lines show the impact of each pathway (P value < 0.05; FDR < 0.01).
The above results are general, meaning that they only provide information about the overall impact and the general direction of the impact (flux) of each significant pathway in the dataset. With the aim to reach a better understanding about the biological relevance of each pathway, the present analyses are also focused on the significant biological processes, molecular functions, cellular components, and domains and important sites of proteins (GO-Interpro) within each significantly impacted pathway.
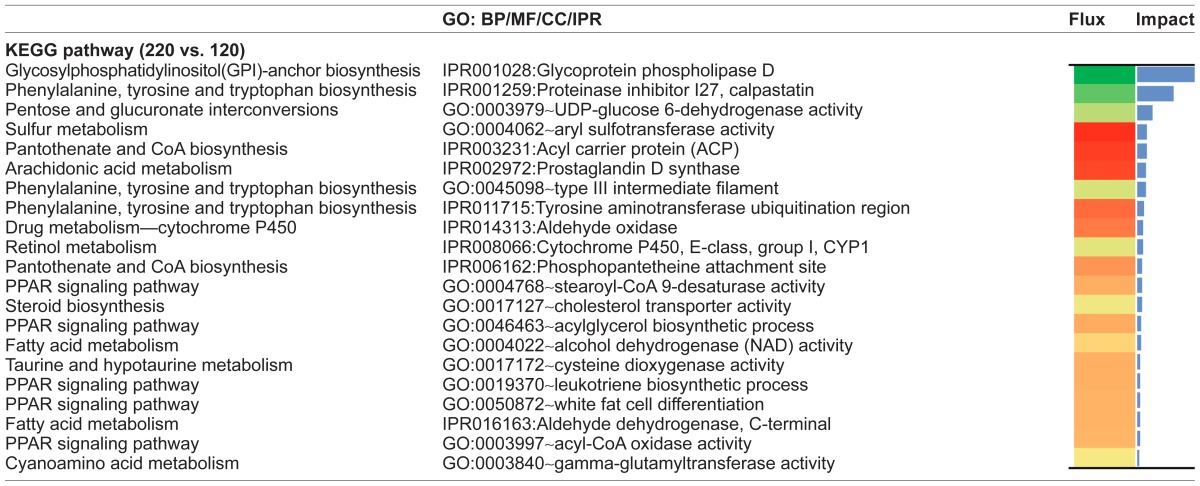
During the beginning of the growing phase, in the pathways where cytochromes were present (Metabolism of xenobiotics by cytochrome P450 and Arachidonic Acid Metabolism), epoxide hydrolases (GO:0004301~epoxide hydrolase activity) and Flavin-containing monooxygenase 3 (IPR002255: Flavin-containing monooxygenase (FMO)) were inhibited. Moreover, a number of cytochromes that belong to the Arachidonic Acid Metabolism pathway were activated during the entire growing phase. Data also suggest that prostaglandin (PG) synthesis (via IPR002972:Prostaglandin D synthase—Arachidonic Acid Metabolism) was inhibited during the second half of the growing phase and was then activated during the finishing phase. In addition, in the Drug metabolism—cytochrome P450 KEGG pathway during the finishing phase, Aldehyde oxidase 1 (IPR014313) had a strong activation (Table 3).
Table 3.
KEGG pathways and DAVID Biological Process (BP), Molecular Function (MF), Cellular Component (CC), or Interpro (IPR) for early growing phase (60 vs. 0), late growing phase (120 vs. 60) and finishing phase (220 vs. 120).
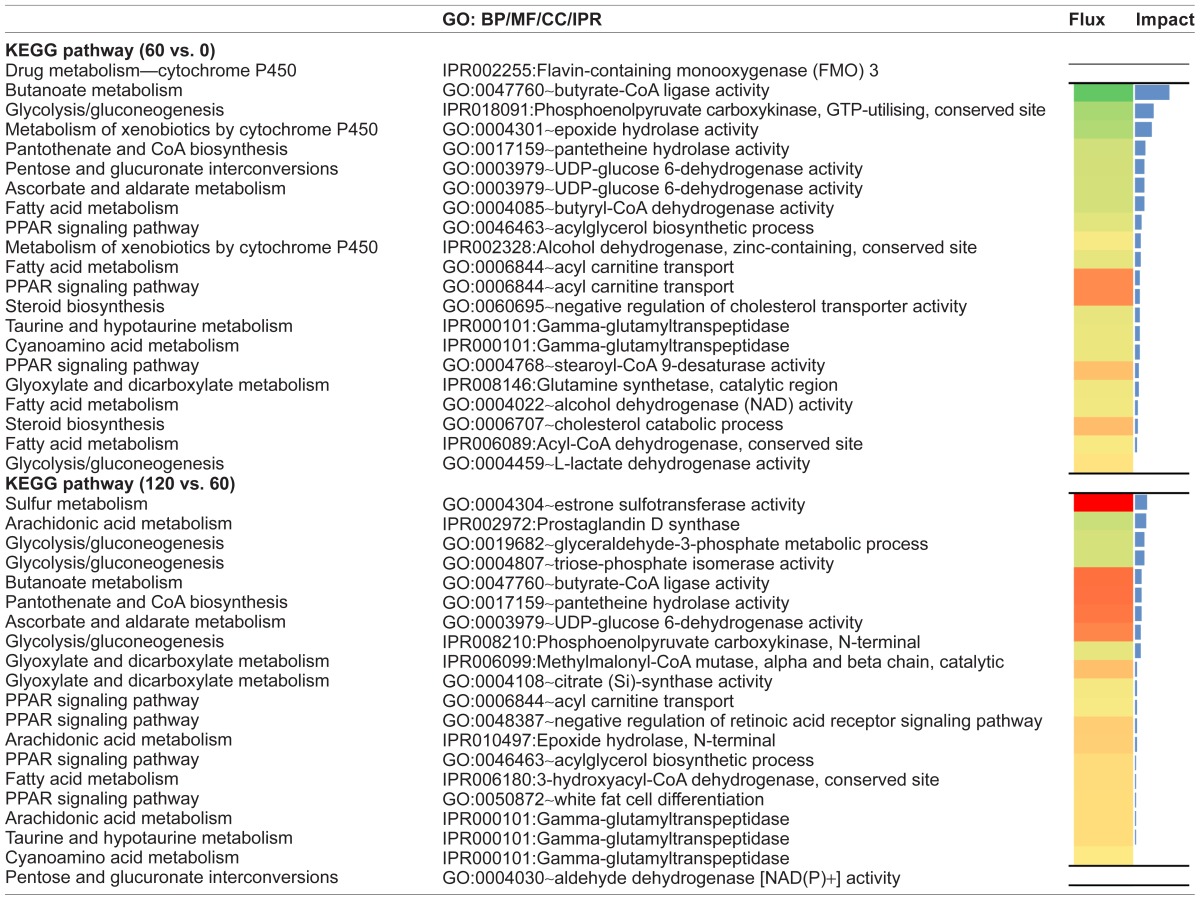
The Retinol metabolism pathway and Pantothenate and CoA biosynthesis pathway were the highest impacted pathways within the subcategory Metabolism of Cofactors and Vitamins during the beginning of the growing phase (Additional File 1). The Retinol metabolism had a marked inhibition of cytochrome P450 enzymes (IPR008066:Cytochrome P450, E-class, group I, CYP1) and a wide variety of dehydrogenases (Additional File 2-Interpro and MF 60 vs. 0). The overall inhibition observed for Pantothenate and CoA biosynthesis during the first half of the growing phase was associated primarily with marked downregulation of the pantetheine hydrolase (Vanin-1) (GO:0017159~pantetheine hydrolase activity) enzyme (Table 3, Additional File 1).
Within the Amino acid Metabolism KEGG subcategory, metabolism of histidine, tyrosine and phenylalanine were the most impacted. Monoamine oxidase B (EC:1.4.3.4 or MAOB) is an enzyme common to the histidine, tyrosine, and phenylalanine metabolic pathways which produces an evident inhibition of the tyrosine and phenylalanine pathway during the early growing phase (Additional File 1). During the finishing phase, the tyrosine aminotransferase (TAT) (IPR005957) enzyme was strongly activated, determining a high impact for the Phenylalanine, tyrosine, and tryptophan biosynthesis pathway during this stage. The enzyme gamma-glutamyl transpeptidase (GGT) (IPR000101) is common to the Taurine and Hypotaurine Metabolism and Cyanoamino acid Metabolism pathways, both subcategories of Metabolism of others amino acids. The GGT enzyme, was inhibited with a high impact during the beginning of the growing phase (60 vs. 0) and during the finishing phase (220 vs. 120). Moreover, cysteine dioxygenase (CDO1) activity (GO:0017172) was increased during the finishing phase (Fig. 3 and Table 3).
The Glyoxylate and dicarboxylate metabolism pathway had inhibition during early growing phase due to glutamate-ammonia ligase (IPR008146: Glutamine synthetase, catalytic region) and citrate synthase (IPR010109:Citrate synthase, eukaryotic) downregulation during this period. The Glycolysis/Gluconeogenesis pathway had the highest impact during the early growing phase due to inhibition of the enzymes phosphoenolpyruvate carboxykinase (PCK1) and alcohol dehydrogenase (ADH). During the second half of the growing phase, the bioinformatics analysis identified that synthesis of dihydroxyacetone phosphate (GO:0004807~triose-phosphate isomerase activity) and the glyceraldehyde-3-phosphate metabolic process (GO:0019682) were inhibited, while the Lactate dehydrogenase activity was upregulated. Moreover, L-lactate dehydrogenase (GO:0004459~L-lactate dehydrogenase activity, IPR011304:L-lactate dehydrogenase) and all glycolytic enzymes mentioned above were activated during the finishing phase. Lastly, Butanoate metabolism was in general inhibited in the first half of the growing phase due namely to downregulation of butyrate-CoA ligase activity (GO:0047760). This enzyme, however, was upregulated during the second half of the growing phase (Table 3).
Most recurrent pathways
The Pentose and glucuronate interconversions and Sulfur Metabolism pathways were the most recurrent pathways in the dataset. They had impact values greater than the cut-off of 50% of the maximum total impact at all the time comparisons analyzed. The impact of both pathways was greater during the finishing phase, with a general inhibition of the Pentose and glucuronate interconversions mainly due to a strong downregulation of UDP-glucose 6-dehydrogenase (GO:0003979) and a general activation of Sulfur Metabolism due to a strong upregulation of the Aryl sulfotransferase activity (GO:0004062) (Table 3). A potential biological link between Pentose and glucuronate interconversions and Sulfur Metabolism was envisaged by the upregulation of estrone sulfotransferase enzyme (120 vs. 60) and by the aryl sulfotransferase enzyme (220 vs. 120).
Flux through the Pentose and glucuronate interconversions KEGG pathway also leads to the production of an important intermediate of the TCA cycle, alpha-ketoglutarate (2-oxo-glutarate), which, based on evaluation of the pathway, would appear to have been reduced. UDP-glucose 6-dehydrogenase that produces UDP-alpha-D-glucuronate, on the other hand, was upregulated during the second half of the growing phase (120 vs. 60). In addition, Pentose and glucuronate interconversions in conjunction with the Glycosaminoglycan biosynthesis-heparan sulfate pathway were activated during the second half of the growing phase.
Also recurrent in the analysis were Ascorbate and aldarate metabolism and Fatty acid metabolism during the early growing phase and, with greater impact at finishing phase, the KEGG pathways Steroid biosynthesis, Drug metabolism—cytochrome P450, and PPAR signaling pathway. The first three pathways were slightly inhibited while the last two were activated in the time periods where they had higher impact values (Additional File 1). During the early growing phase, Ascorbate and aldarate metabolism pathway downregulation was mainly due to a UDP-glucose 6-dehydrogenase activity and Regucalcin (IPR008367) inhibition. The Drug metabolism—cytochrome P450 pathway switches from inhibition during the growing phase, mainly due to the action of the xenobiotic-metabolizing enzyme FMO 3, to activation during the finishing phase due to the effect of Aldehyde oxidase 1 (Table 3).
The PPAR signaling pathway was inhibited during the early growing phase (60 vs. 0) due to the downregulation of phosphoenolpyruvate carboxykinase activity (GO:0004611), Adiponectin (bta:282865), uncoupling protein 1 (mitochondrial, proton carrier) (bta:281561 or UCP1), and solute carrier family 27 (fatty acid transporter), member 2 (EC:6.2.1.3 or SLC27A2). Stearoyl-CoA 9-desaturase activity (GO:0004768), however, had an extremely high activation during this period (data not shown). During the finishing phase (220 vs. 120) PPAR targets were mostly activated, giving signs for activation of lipid transport (apolipoprotein A-I (APOA1) or apolipoprotein A-I receptor binding (GO:0034191)) and apolipoprotein A-II (APOA2)), lipogenesis (stearoyl-CoA desaturase (delta-9-desaturase) (EC:1.14.19.1 or SCD), fatty acids transport (CD36 molecule (thrombospondin receptor)), β-oxidation carnitine palmitoyltransferase 1B (muscle) (EC:2.3.1.21 or CPT1B), carnitine palmitoyltransferase 1C (CPT1C), acyl-CoA oxidase 2, branched chain (ACOX2) and acetyl-CoA acyltransferase 1 (ACAA1), adipocyte differentiation (sorbin and SH3 domain containing 1 (SORBS1) and fatty acid binding protein 4, adipocyte (FABP4) with an effect on white fat cell differentiation (GO:0050872), and acylglycerol biosynthetic process (GO:0046463) (Tables 2 and 3).
The Steroid biosynthesis pathway was inhibited during the finishing phase due to a downregulation of cholesterol transporter activity (GO:0017127) and cholesterol synthesis by downregulation of emopamil binding proteins (IPR007905). The PPAR signaling pathway had a higher impact during the finishing phase as a result of upregulation of leukotriene biosynthetic process (GO:0019370) (ie, arachidonic acid), stearoyl-CoA 9-desaturase activity, glycerol kinase activity (GO:0004370), and acyl-CoA oxidase activity (GO:0003997) among others (Table 3).
The overall inhibition of Fatty acid Metabolism during the early growing phase was primarily due to a marked downregulation of enzymes involved in the β-oxidation process, GO:0004085~butyryl-CoA dehydrogenase activity, IPR006089:Acyl-CoA dehydrogenase, conserved site, and GO:0004022~alcohol dehydrogenase (NAD) activity (Additional File 2). Acyl carnitine transport activation during the beginning of the growing phase is potentially associated with use of short-chain branched fatty acids in LM tissue (Additional File 2). This reaction was accompanied by the activation of the mitochondrial Acyl-CoA dehydrogenase short branched chain (ACADSB) (Fatty acids Metabolism) and the inhibition of the others Acyl-CoA dehydrogenases (ACADS, ACADM, ACADL, ACADVL) and butyryl-CoA ligase (Butanoate Metabolism). Interestingly, there was a marked upregulation of acyl carnitine transport (GO:0006844~acyl carnitine transport) during early growing phase. In the second half of the growing phase, the modest activation of the Fatty acid metabolism pathway was due to upregulation of the enzyme 3-hydroxyacyl-CoA dehydrogenase (IPR006180:3-hydroxyacyl-CoA dehydrogenase, conserved site) and the general activation of the Acyl-CoA dehydrogenases. Lastly, a number of NADPH-generating enzymes, specially alcohol dehydrogenase (GO:0004022~alcohol dehydrogenase (NAD) activity) and L-glucuronate reductase (GO:0047939~L-glucuronate reductase activity), were upregulated during the finishing phase.
Other categories
The highest-impact subcategory within Genetic Information Processing was Translation, due to downregulation of expression of the eukaryotic translation initiation factor 4F complex (GO:0016281) during the early growing phase and a strong activation during the finishing phase by means of the upregulation of 50 different ribosomal proteins (Table 1). In contrast, Replication and Repair was highly impacted, but was inhibited during the finishing phase.
Table 1.
Results of flux and impact uncovered by the Dynamic Impact Approach (DIA) based on Kyoto Encyclopedia of Genes and Genomes (KEGG) Pathways database analysis of the bovine muscle transcriptome for each time comparison.
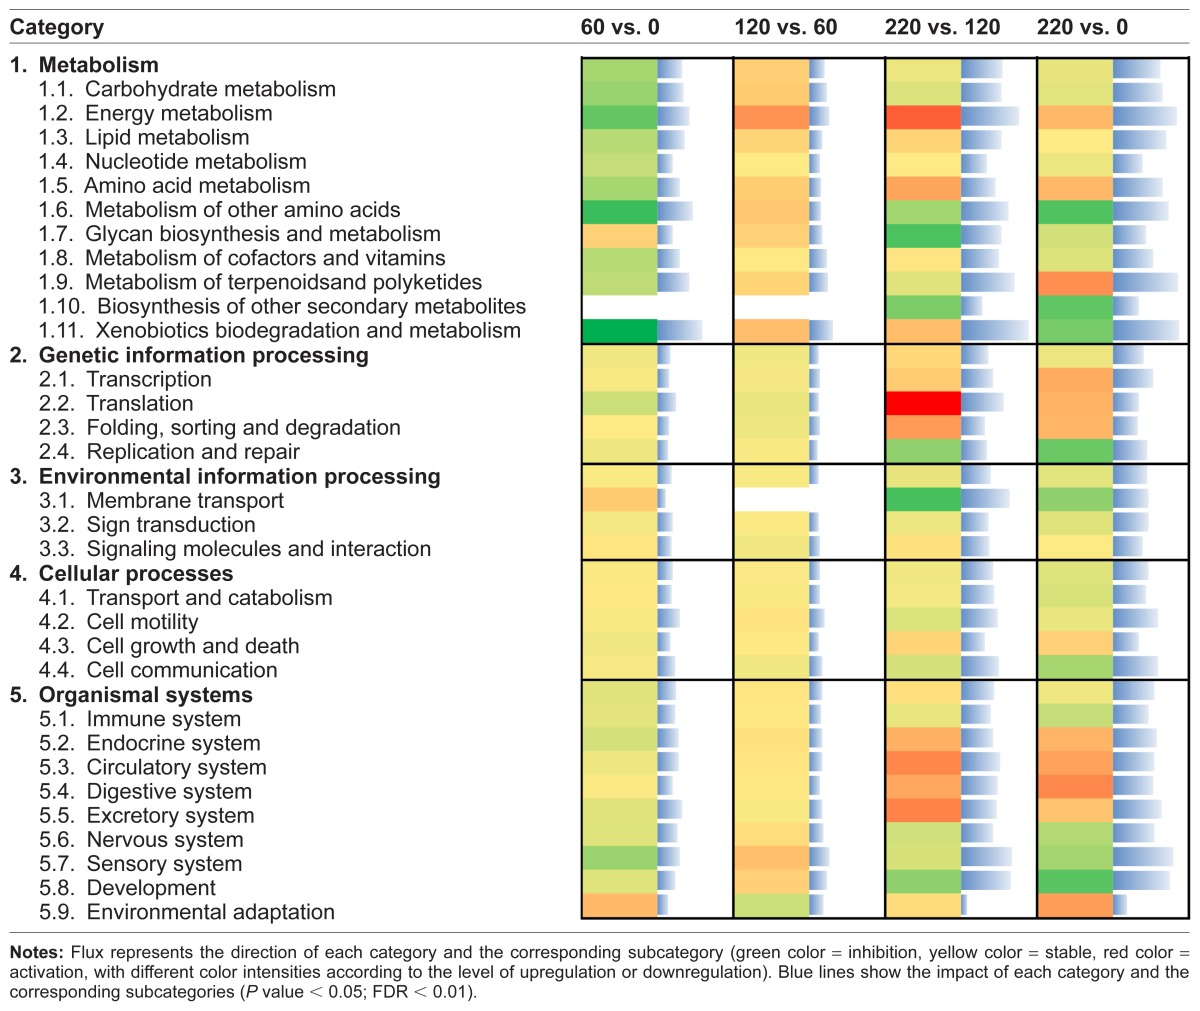
Within the Environmental Information Processing category, the subcategory Membrane transport had the highest impact and was inhibited during the finishing phase due to the inhibition of the ABC transporters pathway (IPR005951) (Additional File 1). The inhibited Cell communication and Cell motility were the most impacted Cellular Processes categories, especially during the finishing phase (Table 1).
Within the Organismal Systems category, Sensory system and Development subcategories were the most impacted during the finishing phase. In particular, Development had a relatively low inhibition at the beginning of the growing phase and a slight activation at the second half of the growing phase, ending with a strong inhibition during the finishing phase (Additional File 3).
The subcategories of pathways related to Human Diseases have little to do with bovine LM and will not be discussed in detail. However, the results indicated that these pathways were strongly impacted in general during the finishing phase (Additional File 3).
Discussion
The mechanism of mRNA translation is mediated by ribosomes and begins with the formation of a ternary complex between amino-acylated initiator methionine tRNA, GTP, and the initiation factor 2.11 In our study, the cellular metabolic process in which a protein is formed was extremely activated during the finishing phase, denoting signs of LM growth in steers. The greater number of DEGs observed in the finishing phase indicates that the skeletal muscle might have been more physiologically active in comparison with the growing phase (Fig. 1). This idea is supported by the fact that Translation was the subcategory within Genetic Information Processing with the highest impact, due to the apparent activation of the Ribosome pathway, ie, translation of mRNA appeared more robust. Under this scenario, the inhibition of ABC transporters that require ATP hydrolysis to translocate various substrates across membranes would have spared energy required for translation.12,13
Carbohydrate metabolism
The finding that several pathways related to the KEGG subcategory Carbohydrate Metabolism had a high impact and were in general inhibited during the first-half of the growing phase (60 vs. 0), reflected potentially novel adaptations of LM tissue during the early stages of rapid growth. For instance, the Ascorbate and aldarate metabolism and the Pentose and Glucuronate Interconversions pathways were identified as affected due to the fact that regucalcin and UDP-glucose 6-dehydrogenase (GO:0003979 or UDPGDH) had a considerable downregulation in expression level in both pathways. That result highlights two biological mechanisms which could affect myogenesis during the early growing phase. Regucalcin leads to activation of proteolysis14 and the general inhibition of Pentose and glucuronate interconversions was mainly due to a strong downregulation of UDPGDH, which might have reduced the conversion of UDP-glucose into UDP-glucuronate, a nucleoside diphosphate sugar with a central role in glycogen biosynthesis in skeletal muscle.15,16 Therefore, UDPGDH inhibition might have led to greater glycogen synthesis and regucalcin inhibition might have had a positive effect on protein synthesis during the early growing phase and the finishing phase. Both biological mechanisms could serve as signals for LM muscle growth in beef steers especially during the early growing phase.
The fact that the Glycolysis/Gluconeogenesis pathway was significantly impacted during the early growing phase reflects the metabolic activity in cells within the LM, including myocytes and intramuscular fat. Within this pathway, the enzyme phosphoenolpyruvate carboxykinase (PCK1), inhibited at this stage, is important for gluconeogenesis in liver and for glyceroneogenesis in adipose and muscle tissue17 as it catalyzes the conversion of oxaloacetate to phosphoenolpyruvate. The pathway was in general inhibited during the early growing phase, switching to an active state during the late growing and finishing phases. Therefore, from a biological standpoint, the later changes in PCK1 were likely related to the synthesis of glycerol-3-phosphate needed for triacylglycerol formation within the intramuscular adipocyte,15 a process that is expected to be more active during the finishing phase.
The upregulation of L-lactate dehydrogenase (GO:0004459~L-lactate dehydrogenase activity) during the finishing phase is consistent with the concept that lactate is an important lipogenic substrate in bovine intramuscular fat,16 and could have been related with greater use of rumen-derived lactate for fatty acids synthesis.18 Moreover, activation of L-glucuronate reductase, an NADPH-generating enzyme during the finishing phase, was probably an adaptation of LM tissue (intramuscular adipose) to sustain greater rates of fatty acids synthesis.18
Amino acid metabolism
Gamma glutamyl transpeptidase (GGT) is an enzyme within the Taurine and Hypotaurine metabolism and Cyanoamino acid metabolism pathways with a significant impact during the early growing phase in this study. The role of GGT is key in the synthesis and degradation of extracellular glutathione (GSH),19 LDL oxidation,20 and xenobiotic detoxification.21 Its activity is important for amino acid transport across cellular membranes.22 During amino acid transport across cellular membranes, Gamma-Glutamyl moieties of GSH are hydrolyzed and transferred to other amino acids, leading to the formation of gamma-glutamyl amino acids, which are then transported into the cell.23 Therefore, the cleavage of the gamma-glutamyl bond of extracellular GSH allows cells to use this antioxidant compound as a source of cysteine for increased synthesis of intracellular GSH.24
The recovery of cysteine, mediated by GSH metabolism, becomes critical for protein synthesis. In contrast, high levels of cysteine are relatively toxic in the body.23 Cysteine catabolism is tightly adjusted via regulation of cysteine dioxygenase (CDO1) levels in the liver.25 Additionally, GSH depletion led to sustained activation of NF-kB (nuclear factor kappa-light-chain-enhancer of activated B cells), which inhibits myogenesis.14 Our results emphasize that, on one hand, the activation of GSH synthesis after the early growing phase could have signaled greater activation of amino acid transport into cells for protein synthesis while, on the other hand, during the finishing phase, cysteine is catabolized by CDO1 likely to control intracellular cysteine levels partly to prevent of the occurrence of oxidative stress during a physiological period when intracellular fat deposition increases.26
Monoamine oxidase B (MAOB) is an enzyme common to the histidine, tyrosine, and phenylalanine metabolic pathways. Its inhibition during the early growing phase might have been associated with lower insulin-like stimulation of glucose transport in adipocytes by means of the monoamine oxidase-dependent oxidation of tyramine.41,42 Amine oxidation of tyramine by MAOB (IPR002938) leads to the production of hydrogen peroxide (H2O2), a well-known insulin-like agent that enhances glucose transport.27 Our results revealed that during the late growing phase, this glucose transport blockage was established potentially to regulate the increase of glucose influx into the cells (Additional File 2).6
Insulin-dependent TAT activation28,29 seems to be an important mechanism controlling amino acid metabolism during the early growing and the finishing phases. TAT was highly activated as its ubiquitination region (IPR011715) was upregulated (Additional File 2). TAT contains two phosphorylation sites, including CAPK at Ser29, and a casein kinase II site.30 This ubiquitin-dependent degradation of TAT might explain why the negative regulation of proteasomal ubiquitin-dependent protein catabolic process (GO:0032435) was the biological process which had the highest inhibition during the finishing phase.
There were two mechanism which could explain this targeted proteasomal degradation: (a) Desmin, a type III intermediate filament (GO:0045098) important in muscle cell architecture and structure,31 was extremely inhibited during the finishing phase; and (b) Calpastatin, an inhibitor of a calcium-dependent cysteine protease called Calpain,32 was activated during the finishing phase (Additional File 2). Calpains plays a key role in post-mortem tenderization of meat and may be involved in muscle protein degradation in living tissue.33 These mechanisms were suggestive of signs of degradation or destabilization of the muscular structure.
Glycan biosynthesis and metabolism
The highly-impacted inhibition of GPI-anchor biosynthesis pathway in our study agrees with previous results.5 GPI anchor is a glycolipid that can be attached to the C-terminus of a protein during posttranslational modification.34 In adipose tissue, GPI-anchored proteins bind to Caveolins by a mechanism known as palmitoylation.35 Caveolins are a family of integral membrane proteins which are the principal components of caveolae membranes and they are involved in receptor-independent endocytosis.36 Caveolae, a special type of lipid raft, are a small invagination of the plasma membrane and is the place were insulin receptors are localized in adipocytes. Caveolae are mainly formed and maintained by caveolins. Caveolins are synthesized as monomers and transported to Golgi apparatus. During their transport through secretory pathway, caveolins associate with lipid rafts, where GPI-linked proteins are preferentially located, and form oligomers. These oligomerized caveolins then form the caveolae.37
The presence of caveolins leads to the local change in morphology of the membrane.38 Expression of palmitoylated caveolins is required for the efficient transport of GPI-linked proteins from the Golgi complex to the plasma membrane.35 Caveolins interact with the catalytic subunit of protein kinase A (PKA) and inhibit cyclic AMP (cAMP)-mediated signal transduction in vivo.39 When PKA-dependent phosphorylation is inhibited, it leads to impaired access of triacylglycerol lipases such as hormone-sensitive lipase.40 During the finishing phase, although there were signs that the PKA gene was being transcribed (Tie2 Ig-like domain 1, N-terminal (IPR018941) activation), caveolins were not expressed (Additional File 2). This is potentially due to a marked downregulation of GPI specific phospholipase (GPLD1) and phosphatidylinositol glycan anchor biosynthesis, class Q (PIGQ) (Table 3) which contributed to the general inhibition of the GPI-anchor biosynthesis pathway.
Palmitoylated caveolins by GPI-anchor proteins are needed to create a blockage in the cAMP-to-adenosine conversion associated with lipid droplet hydrolysis. The end result of this mechanism due to the inhibition of GPI-anchor proteins would therefore be the inhibition of lipolysis41 during the finishing phase. In conclusion, the general inhibition of this pathway during the finishing phase could have been associated with promoting lipid droplet accumulation within intramuscular fat.
Xenobiotics biodegradation and metabolism
Enzymes in the Drug metabolism—cytochrome P450 pathway catalyze the oxidation of xenobiotics.42 Aldehyde oxidase 1 (AOX1) was activated with a high impact during the finishing phase. This enzyme is involved in the process of detoxification of aldehydes by oxidizing them to produce reactive oxygen species (ROS). When endogenous antioxidant defenses are inadequate to maintain ROS production in equilibrium, the likelihood of oxidative damage to DNA, lipids, proteins, and other molecules increases.43 In this study, data suggest that ROS production was countered by the upregulation of a thiol specific antioxidant (IPR000866) (Additional File 2).44 Moreover, a previous study provided evidence that AOX1 could be involved in adipogenesis29 due to the fact that AOX1 catalyzes the oxidation of vitamin A aldehyde to retinoic acid which influences adipocyte differentiation. Therefore it could be possible that AOX1 plays dual roles in LM. Additional studies must be performed to verify these putative roles.
In the context of adipogenesis, the marked inhibition of cytochrome P450 enzymes (IPR008066:Cytochrome P450, E-class, group I, CYP1) could also have had an effect on the production of all-trans retinoic acid,45 which was likely associated with the general inhibition of Retinol Metabolism during the early growing and finishing phases. Retinoids regulate metabolism by activating specific nuclear receptors like retinoic acid receptor (RAR) and retinoid X receptor (RXR). RXR heterodimerizes with peroxisome proliferator-activated receptor gamma (PPARG) leading to a regulation of adipogenic transcriptional machinery.46
Lipid metabolism
Cytosolic epoxide hydrolases within the Arachidonic Acid Metabolism pathway are induced only by xenobiotics, which also cause peroxisome proliferation.47 During the early growing phase, cytochrome P450, family 2, subfamily c (EC:1.14.14.1 or CYP2C) activity was inhibited, leading to a blockage in the production of epoxyeicosatrienoic acid (EET) from arachidonic acid by cytochrome P450 epoxygenases (IPR010497:Epoxide hydrolase, N-terminal).48 Support for an intracellular mechanism of action stems from the fact that EETs have many characteristics of long-chain fatty acids, therefore, they are incorporated into cellular membrane phospholipids and bind to cytoplasmic FABPs and PPARG.49,50
During the second half of the growing phase, the conversion of arachidonic acid to EET was activated, while the soluble epoxide hydrolase (EDHX2) was inhibited, likely leading to EET production during this stage. Interestingly, during the finishing phase the data obtained suggest that flux through this pathway led to greater conversion of EET to dihydroxyeicosatrienoic acids (DHETs), suggesting the presence of soluble epoxide hydrolases and a potential probability of increase in the proportion of mesenchymal stem cell-derived adipocytes.51 With the above mechanisms in mind, it could be speculated that EET have a role in adipogenesis. More studies are required, however, to verify this hypothesis. On other hand, the fact that PGs (IPR002972) were upregulated during the finishing phase (Additional File 2) suggested utilization of arachidonic acid via cyclooxygenases to produce PGs.52 In turn, PGs could have served as activators of PPARG, which is implicated in adipocyte differentiation.53
The inhibition of mitochondrial β-oxidation during the early growing phase was likely a result of lower acyl carnitine transport54,55 in place of the preferential channeling of long-chain fatty acids towards acylglycerol formation and adipocyte differentiation. The inhibition of the carnitine shuttle, as well as the activation of biosynthesis of acylglycerols, were indicative that esterification was one of the predominant processes during the finishing phase. Moreover, within the Metabolism of cofactors and vitamins KEGG subcategory, Vanin-1, present in the Pantothenate and CoA biosynthesis pathway, dictates the high impact for this pathway. Vanin-1 is a GPI-anchored pantetheinase which leads to the conversion of Pantetheine to Pantothenate.56 The 4-phosphopantetheine moiety, linked via its phosphate group to the hydroxyl group of serine, represents an active component of the acyl carrier protein (ACP) (IPR003231:Acyl carrier protein (ACP)) which is a central component of the fatty acid synthase reaction.42 Data from this study suggest that during the finishing phase, the phosphopantetheine attachment site of the ACP (IPR006162:Phosphopantetheine attachment site) was activated, hence facilitating the flux of carbon source through lipogenesis to generate intramuscular fat. Within the Endocrine System KEGG subcategory, the PPARG Signaling Pathway responses observed were expected based on previous results,57,58 demonstrating that intramuscular fat deposition in LM increases progressively over time.59 These combined results explain the temporal increase in the activation of the highly-impacted differentiation of white fat cells (GO:0050872) and biosynthesis of acylglycerols (GO:0046463).
Conclusions
The bioinformatics analyses uncovered highly-impacted biological processes and metabolic pathways, some of which are associated with glycogen synthesis in myocytes, some with muscle growth regulation, and others with lipid droplets. These KEGG pathways analyzed by the DIA approach must be studied in more detail to aid in the discovery of new molecular markers for improving carcass characteristics.
Supplementary Materials
Additional File 1.
Additional File 2.
Additional File 3.
Figure 2.
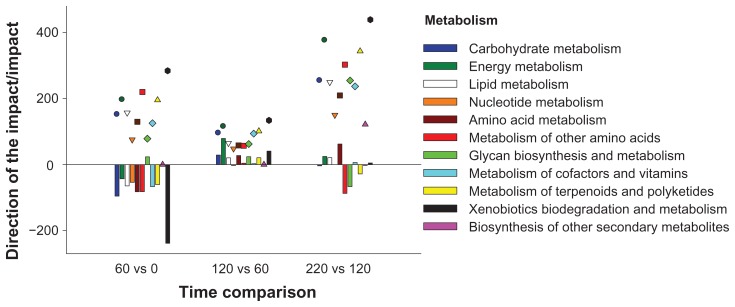
Direction of the impact (vertical bars, negative values for inhibited pathways and positive values for activated pathways) and impact (dots with different shapes) for each time comparison for the KEGG category metabolism (P value < 0.05; FDR < 0.01).
Footnotes
Author Contributions
Conceived and designed the experiments: JJL, DWS, DBF, LLB. Conceived and performed the analyses: SJM, DEG, SLR. Wrote the manuscript: SJM, JJL. Contributed reagents: REE, HAL. Agree with manuscript results and conclusions: SJM, DWS, DBF, JJL. Jointly developed the structure and arguments for the paper: SJM, JJL. Made critical revisions and approved final version: SJM, DWS, DEG, SLR, REE, HAL, DBF, LLB, JJL. All authors reviewed and approved of the final manuscript.
Competing Interests
Author(s) disclose no potential conflicts of interest.
Disclosures and Ethics
As a requirement of publication the authors have provided signed confirmation of their compliance with ethical and legal obligations including but not limited to compliance with ICMJE authorship and competing interests guidelines, that the article is neither under consideration for publication nor published elsewhere, of their compliance with legal and ethical guidelines concerning human and animal research participants (if applicable), and that permission has been obtained for reproduction of any copyrighted material. This article was subject to blind, independent, expert peer review. The reviewers reported no competing interests.
Funding
S. Moisá, on leave from Facultad de Agronomía, Universidad de Buenos Aires, was supported by a PhD fellowship from Agencia Nacional de Ciencia y Tecnología and FAUBA of Argentina.
References
- 1.Byrne KA, Wang YH, Lehnert SA, et al. Gene expression profiling of muscle tissue in Brahman steers during nutritional restriction. J Anim Sci. 2005;83(1):1–12. doi: 10.2527/2005.8311. [DOI] [PubMed] [Google Scholar]
- 2.Reverter A, Hudson NJ, Wang Y, et al. A gene coexpression network for bovine skeletal muscle inferred from microarray data. Physiol Genomics. 2006;28(1):76–83. doi: 10.1152/physiolgenomics.00105.2006. [DOI] [PubMed] [Google Scholar]
- 3.Wang YH, Byrne KA, Reverter A, et al. Transcriptional profiling of skeletal muscle tissue from two breeds of cattle. Mamm Genome. 2005;16(3):201–10. doi: 10.1007/s00335-004-2419-8. [DOI] [PubMed] [Google Scholar]
- 4.Bionaz M, Rodriguez-Zas SL, Everts RE, Lewin HA, Hurley WL, Loor JJ. Dynamic Impact Approach—DIA. Urbana-Champaign Illinois: University of Illinois; 2011. [Google Scholar]
- 5.Bionaz M, Periasamy K, Rodriguez-Zas SL, et al. Old and new stories: revelations from functional analysis of the bovine mammary transcriptome during the lactation cycle. PLoS One. 2012;7(3):e33268. doi: 10.1371/journal.pone.0033268. [DOI] [PMC free article] [PubMed] [Google Scholar]
- 6.Graugnard DE, Berger LL, Faulkner DB, Loor JJ. High-starch diets induce precocious adipogenic gene network up-regulation in longissimus lumborum of early-weaned Angus cattle. Br J Nutr. 2010;103(7):953–63. doi: 10.1017/S0007114509992789. [DOI] [PubMed] [Google Scholar]
- 7.Graugnard DE, Piantoni P, Bionaz M, Berger LL, Faulkner DB, Loor JJ. Adipogenic and energy metabolism gene networks in longissimus lumborum during rapid post-weaning growth in Angus and Angus x Simmental cattle fed high-starch or low-starch diets. BMC Genomics. 2009;10:142. doi: 10.1186/1471-2164-10-142. [DOI] [PMC free article] [PubMed] [Google Scholar]
- 8.Graugnard DE. Immune Function, Gene Expression, Blood Indices and Performance in Transition Dairy Cows affected by Diet and Inflammation. Urbana-Champaign: Animal Science, University of Illinois; 2011. [Google Scholar]
- 9.Reiner A, Yekutieli D, Benjamini Y. Identifying differentially expressed genes using false discovery rate controlling procedures. Bioinformatics. 2003;19(3):368–75. doi: 10.1093/bioinformatics/btf877. [DOI] [PubMed] [Google Scholar]
- 10.Bionaz M, Periasamy K, Rodriguez-Zas SL, Hurley WL, Loor JJ. A novel dynamic impact approach (DIA) for functional analysis of time-course omics studies: validation using the bovine mammary transcriptome. PLoS One. 2012;7(3):e32455. doi: 10.1371/journal.pone.0032455. [DOI] [PMC free article] [PubMed] [Google Scholar]
- 11.Farruggio D, Chaudhuri J, Maitra U, Raj Bhandary UL. The A1 x U72 base pair conserved in eukaryotic initiator tRNAs is important specifically for binding to the eukaryotic translation initiation factor eIF2. Mol Cell Biol. 1996;16(8):4248–56. doi: 10.1128/mcb.16.8.4248. [DOI] [PMC free article] [PubMed] [Google Scholar]
- 12.Zancanella V, Giantin M, Lopparelli RM, Nebbia C, Dacasto M. Tissue distribution and phenobarbital induction of target SLC- and ABC-transporters in cattle. J Vet Pharmacol Ther. 2012 doi: 10.1111/j.1365-2885.2012.01427.x. [DOI] [PubMed] [Google Scholar]
- 13.Tyzack JK, Wang X, Belsham GJ, Proud CG. ABC50 interacts with eukaryotic initiation factor 2 and associates with the ribosome in an ATP- dependent manner. J Biol Chem. 2000;275(44):34131–9. doi: 10.1074/jbc.M002868200. [DOI] [PubMed] [Google Scholar]
- 14.Ardite E, Barbera JA, Roca J, Fernandez-Checa JC. Glutathione depletion impairs myogenic differentiation of murine skeletal muscle C2C12 cells through sustained NF-kappaB activation. Am J Pathol. 2004;165(3):719–28. doi: 10.1016/s0002-9440(10)63335-4. [DOI] [PMC free article] [PubMed] [Google Scholar]
- 15.Beale EG, Hammer RE, Antoine B, Forest C. Disregulated glyceroneogenesis: PCK1 as a candidate diabetes and obesity gene. Trends Endocrinol Metab. 2004;15(3):129–35. doi: 10.1016/j.tem.2004.02.006. [DOI] [PubMed] [Google Scholar]
- 16.Smith SB, Crouse JD. Relative contributions of acetate, lactate and glucose to lipogenesis in bovine intramuscular and subcutaneous adipose tissue. J Nutr. 1984;114(4):792–800. doi: 10.1093/jn/114.4.792. [DOI] [PubMed] [Google Scholar]
- 17.Millward CA, Desantis D, Hsieh CW, et al. Phosphoenolpyruvate carboxykinase (Pck1) helps regulate the triglyceride/fatty acid cycle and development of insulin resistance in mice. J Lipid Res. 2010;51(6):1452–63. doi: 10.1194/jlr.M005363. [DOI] [PMC free article] [PubMed] [Google Scholar]
- 18.Vernon RG. Lipid metabolism in the adipose tissue of ruminant animals. Prog Lipid Res. 1980;19(1–2):23–106. doi: 10.1016/0163-7827(80)90007-7. [DOI] [PubMed] [Google Scholar]
- 19.Castellano I, Merlino A. γ-Glutamyltranspeptidases: sequence, structure, biochemical properties, and biotechnological applications. Cell Mol Life Sci. 2012;69(20):3381–94. doi: 10.1007/s00018-012-0988-3. [DOI] [PMC free article] [PubMed] [Google Scholar]
- 20.Paolicchi A, Minotti G, Tonarelli P, et al. Gamma-glutamyl transpeptidase-dependent iron reduction and LDL oxidation—a potential mechanism in atherosclerosis. J Investig Med. 1999;47(3):151–60. [PubMed] [Google Scholar]
- 21.Courtay C, Oster T, Michelet F, et al. Gamma-glutamyltransferase: nucleotide sequence of the human pancreatic cDNA. Evidence for a ubiquitous gamma-glutamyltransferase polypeptide in human tissues. Biochem Pharmacol. 1992;43(12):2527–33. doi: 10.1016/0006-2952(92)90140-e. [DOI] [PubMed] [Google Scholar]
- 22.Prusiner S, Doak CW, Kirk G. A novel mechanism for group translocation: substrate-product reutilization by gamma-glutamyl transpeptidase in peptide and amino acid transport. J Cell Physiol. 1976;89(4):853–63. doi: 10.1002/jcp.1040890453. [DOI] [PubMed] [Google Scholar]
- 23.Orlowski M, Meister A. The gamma-glutamyl cycle: a possible transport system for amino acids. Proc Natl Acad Sci U S A. 1970;67(3):1248–55. doi: 10.1073/pnas.67.3.1248. [DOI] [PMC free article] [PubMed] [Google Scholar]
- 24.Deneke SM, Fanburg BL. Regulation of cellular glutathione. Am J Physiol. 1989;257(4 Pt 1):L163–73. doi: 10.1152/ajplung.1989.257.4.L163. [DOI] [PubMed] [Google Scholar]
- 25.Stipanuk MH, Dominy JE, Jr, Lee JI, Coloso RM. Mammalian cysteine metabolism: new insights into regulation of cysteine metabolism. J Nutr. 2006;136(Suppl 6):1652S–9. doi: 10.1093/jn/136.6.1652S. [DOI] [PubMed] [Google Scholar]
- 26.Noeman SA, Hamooda HE, Baalash AA. Biochemical study of oxidative stress markers in the liver, kidney and heart of high fat diet induced obesity in rats. Diabetol Metab Syndr. 2011;3(1):17. doi: 10.1186/1758-5996-3-17. [DOI] [PMC free article] [PubMed] [Google Scholar]
- 27.Muller G, Wied S, Dearey EA, Biemer-Daub G. Glycosylphosphatidylinositol- anchored proteins coordinate lipolysis inhibition between large and small adipocytes. Metabolism. 2011;60(7):1021–37. doi: 10.1016/j.metabol.2010.10.007. [DOI] [PubMed] [Google Scholar]
- 28.Wiedemann S, Sigl G, Schmautz C, Kaske M, Viturro E, Meyer H. Omission of dry period or milking once daily affects metabolic status and is reflected by mRNA levels of enzymes in liver and muscle of dairy cows. Livestock Science. 2013 Feb 26; [Google Scholar]
- 29.Lee KL, Isham KR, Johnson A, Kenney FT. Insulin enhances transcription of the tyrosine aminotransferase gene in rat liver. Arch Biochem Biophys. 1986;248(2):597–603. doi: 10.1016/0003-9861(86)90513-8. [DOI] [PubMed] [Google Scholar]
- 30.Gross-Mesilaty S, Hargrove JL, Ciechanover A. Degradation of tyrosine aminotransferase (TAT) via the ubiquitin-proteasome pathway. FEBS Lett. 1997;405(2):175–80. doi: 10.1016/s0014-5793(97)00181-6. [DOI] [PubMed] [Google Scholar]
- 31.Li Z, Mericskay M, Agbulut O, et al. Desmin is essential for the tensile strength and integrity of myofibrils but not for myogenic commitment, differentiation, and fusion of skeletal muscle. J Cell Biol. 1997;139(1):129–44. doi: 10.1083/jcb.139.1.129. [DOI] [PMC free article] [PubMed] [Google Scholar]
- 32.Wendt A, Thompson VF, Goll DE. Interaction of calpastatin with calpain: a review. Biol Chem. 2004;385(6):465–72. doi: 10.1515/BC.2004.054. [DOI] [PubMed] [Google Scholar]
- 33.Killefer J, Koohmaraie M. Bovine skeletal muscle calpastatin: cloning, sequence analysis, and steady-state mRNA expression. J Anim Sci. 1994;72(3):606–14. doi: 10.2527/1994.723606x. [DOI] [PubMed] [Google Scholar]
- 34.Chatterjee S, Mayor S. The GPI-anchor and protein sorting. Cell Mol Life Sci. 2001;58(14):1969–87. doi: 10.1007/PL00000831. [DOI] [PMC free article] [PubMed] [Google Scholar]
- 35.Sotgia F, Razani B, Bonuccelli G, et al. Intracellular retention of glycosylphosphatidyl inositol-linked proteins in caveolin-deficient cells. Mol Cell Biol. 2002;22(11):3905–26. doi: 10.1128/MCB.22.11.3905-3926.2002. [DOI] [PMC free article] [PubMed] [Google Scholar]
- 36.Cohen AW, Razani B, Schubert W, et al. Role of caveolin-1 in the modulation of lipolysis and lipid droplet formation. Diabetes. 2004;53(5):1261–70. doi: 10.2337/diabetes.53.5.1261. [DOI] [PubMed] [Google Scholar]
- 37.Aboulaich N. Expanding Role of Caveolae in Control of Adipocyte Metabolism. Linköping: Faculty of Health Science, Linköping University; 2006. [Google Scholar]
- 38.Lajoie P, Nabi IR. Lipid rafts, caveolae, and their endocytosis. Int Rev Cell Mol Biol. 2010;282:135–63. doi: 10.1016/S1937-6448(10)82003-9. [DOI] [PubMed] [Google Scholar]
- 39.Kimura A, Mora S, Shigematsu S, Pessin JE, Saltiel AR. The insulin receptor catalyzes the tyrosine phosphorylation of caveolin-1. J Biol Chem. 2002;277(33):30153–8. doi: 10.1074/jbc.M203375200. [DOI] [PubMed] [Google Scholar]
- 40.Muller G, Wied S, Jung C, Over S. Hydrogen peroxide-induced translocation of glycolipid-anchored (c)AMP-hydrolases to lipid droplets mediates inhibition of lipolysis in rat adipocytes. Br J Pharmacol. 2008;154(4):901–13. doi: 10.1038/bjp.2008.146. [DOI] [PMC free article] [PubMed] [Google Scholar]
- 41.Muller G, Over S, Wied S, Frick W. Association of (c)AMP-degrading glycosylphosphatidylinositol-anchored proteins with lipid droplets is induced by palmitate, H2O2 and the sulfonylurea drug, glimepiride, in rat adipocytes. Biochemistry. 2008;47(5):1274–87. doi: 10.1021/bi7022915. [DOI] [PubMed] [Google Scholar]
- 42.Yamazaki H, Shimada T. Effects of arachidonic acid, prostaglandins, retinol, retinoic acid and cholecalciferol on xenobiotic oxidations catalysed by human cytochrome P450 enzymes. Xenobiotica. 1999;29(3):231–41. doi: 10.1080/004982599238632. [DOI] [PubMed] [Google Scholar]
- 43.Halliwell B, Cross CE. Oxygen-derived species: their relation to human disease and environmental stress. Environ Health Perspect. 1994;102(Suppl 10):5–12. doi: 10.1289/ehp.94102s105. [DOI] [PMC free article] [PubMed] [Google Scholar]
- 44.Ferreira LF, Reid MB. Muscle-derived ROS and thiol regulation in muscle fatigue. J Appl Physiol. 2008;104(3):853–60. doi: 10.1152/japplphysiol.00953.2007. [DOI] [PubMed] [Google Scholar]
- 45.Amengual J, Ribot J, Bonet ML, Palou A. Retinoic acid treatment increases lipid oxidation capacity in skeletal muscle of mice. Obesity (Silver Spring) 2008;16(3):585–91. doi: 10.1038/oby.2007.104. [DOI] [PubMed] [Google Scholar]
- 46.Ziouzenkova O, Plutzky J. Retinoid metabolism and nuclear receptor responses: New insights into coordinated regulation of the PPAR-RXR complex. FEBS Lett. 2008;582(1):32–8. doi: 10.1016/j.febslet.2007.11.081. [DOI] [PubMed] [Google Scholar]
- 47.Meijer J, DePierre JW. Cytosolic epoxide hydrolase. Chem Biol Interact. 1988;64(3):207–49. doi: 10.1016/0009-2797(88)90100-7. [DOI] [PubMed] [Google Scholar]
- 48.Fang X, Hu S, Xu B, et al. 14,15-Dihydroxyeicosatrienoic acid activates peroxisome proliferator-activated receptor-alpha. Am J Physiol Heart Circ Physiol. 2006;290(1):H55–63. doi: 10.1152/ajpheart.00427.2005. [DOI] [PubMed] [Google Scholar]
- 49.Spector AA. Arachidonic acid cytochrome P450 epoxygenase pathway. J Lipid Res. 2009;50(Suppl):S52–6. doi: 10.1194/jlr.R800038-JLR200. [DOI] [PMC free article] [PubMed] [Google Scholar]
- 50.Gleim S, Stitham J, Tang WH, Martin KA, Hwa J. An eicosanoid-centric view of atherothrombotic risk factors. Cell Mol Life Sci. 2012;69(20):3361–80. doi: 10.1007/s00018-012-0982-9. [DOI] [PMC free article] [PubMed] [Google Scholar]
- 51.Kim DH, Vanella L, Inoue K, et al. Epoxyeicosatrienoic acid agonist regulates human mesenchymal stem cell-derived adipocytes through activation of HO-1-pAKT signaling and a decrease in PPARgamma. Stem Cells Dev. 2010;19(12):1863–73. doi: 10.1089/scd.2010.0098. [DOI] [PMC free article] [PubMed] [Google Scholar]
- 52.Simmons DL, Botting RM, Hla T. Cyclooxygenase isozymes: the biology of prostaglandin synthesis and inhibition. Pharmacol Rev. 2004;56(3):387–437. doi: 10.1124/pr.56.3.3. [DOI] [PubMed] [Google Scholar]
- 53.Kliewer SA, Lenhard JM, Willson TM, Patel I, Morris DC, Lehmann JM. A prostaglandin J2 metabolite binds peroxisome proliferator-activated receptor gamma and promotes adipocyte differentiation. Cell. 1995;83(5):813–9. doi: 10.1016/0092-8674(95)90194-9. [DOI] [PubMed] [Google Scholar]
- 54.Kerner J, Hoppel C. Fatty acid import into mitochondria. Biochim Biophys Acta. 2000;1486(1):1–17. doi: 10.1016/s1388-1981(00)00044-5. [DOI] [PubMed] [Google Scholar]
- 55.Bartlett K, Eaton S. Mitochondrial beta-oxidation. Eur J Biochem. 2004;271(3):462–9. doi: 10.1046/j.1432-1033.2003.03947.x. [DOI] [PubMed] [Google Scholar]
- 56.Muller G, Wied S, Walz N, Jung C. Translocation of glycosylphosphatidylinositol-anchored proteins from plasma membrane microdomains to lipid droplets in rat adipocytes is induced by palmitate, H2O2, and the sulfonylurea drug glimepiride. Mol Pharmacol. 2008;73(5):1513–29. doi: 10.1124/mol.107.043935. [DOI] [PubMed] [Google Scholar]
- 57.Tokach RJ, Chung KY, Johnson BJ. Factors affecting intramuscular adipose tissue development in beef cattle. 2010. http://www.cabpartners.com/news/research/Texas-Tech-white-paper.pdf.
- 58.Smith SB, Lin KC, Wilson JJ, Lunt DK, Cross HR. Starvation depresses acylglycerol biosynthesis in bovine subcutaneous but not intramuscular adipose tissue homogenates. Comp Biochem Physiol B Biochem Mol Biol. 1998;120(1):165–74. doi: 10.1016/s0305-0491(98)10005-6. [DOI] [PubMed] [Google Scholar]
- 59.Okumura T, Saito K, Sakuma H, et al. Intramuscular fat deposition in principal muscles from twenty-four to thirty months of age using identical twins of Japanese Black steers. J Anim Sci. 2007;85(8):1902–7. doi: 10.2527/jas.2006-752. [DOI] [PubMed] [Google Scholar]
Associated Data
This section collects any data citations, data availability statements, or supplementary materials included in this article.
Supplementary Materials
Additional File 1.
Additional File 2.
Additional File 3.


