Abstract
Background: The daily energy imbalance gap associated with the current population weight gain in the obesity epidemic is relatively small. However, the substantially higher body weights of populations that have accumulated over several years are associated with a substantially higher total energy expenditure (TEE) and total energy intake (TEI), or energy flux (EnFlux = TEE = TEI).
Objective: The objective was to develop an equation relating EnFlux to body weight in adults for estimating the rise in EnFlux associated with the obesity epidemic.
Design: Multicenter, cross-sectional data for TEE from doubly labeled water studies in 1399 adults aged 5.9 ± 18.8 y (mean ± SD) were analyzed in linear regression models with natural log (ln) weight as the dependent variable and ln EnFlux as the independent variable, adjusted for height, age, and sex. These equations were compared with those for children and applied to population trends in weight gain.
Results: ln EnFlux was positively related to ln weight (β = 0.71; 95% CI: 0.66, 0.76; R2 = 0.52), adjusted for height, age, and sex. This slope was significantly steeper than that previously described for children (β = 0.45; 95% CI: 0.38, 0.51).
Conclusions: This relation suggests that substantial increases in TEI have driven the increases in body weight over the past 3 decades. Adults have a higher proportional weight gain than children for the same proportional increase in energy intake, mostly because of a higher fat content of the weight being gained. The obesity epidemic will not be reversed without large reductions in energy intake, increases in physical activity, or both.
See corresponding editorial on page 1717.
INTRODUCTION
Understanding and quantifying the energy dynamics that explain the obesity epidemic are important for benchmarking the significance of research findings (1), estimating the effect of public health interventions (2, 3) and public communications about the magnitude of the changes needed to reverse the epidemic (4). The term energy gap has been applied to different aspects of energy balance dynamics related to obesity and unfortunately this has led to significant confusion about whether the epidemic is caused by (and can be reversed by) small or large differences in energy balance (5–10).
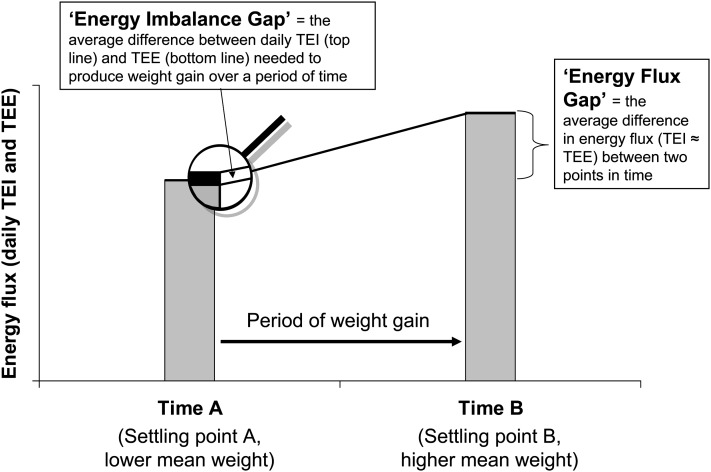
The different energy gap concepts are shown in Figure 1. The average daily excess of total energy intake (TEI) over total energy expenditure (TEE), which is needed to create weight gain over a period of time is referred to here more specifically as the energy imbalance gap. When applied to the average weight gain of whole populations during the rise in the obesity epidemic, this number is usually estimated to be quite small (eg, 125 kJ/d) (5), although more recent models consider it to be significantly larger (7). However, to maintain an ongoing energy imbalance gap to drive the weight gain, TEI needs to keep rising because TEE is also constantly rising toward a new equilibrium because of increased body mass [composed of both fat mass (FM) and fat-free mass (FFM)]. The increasing TEE is mainly due to the effect that the increases in FFM have on increasing resting metabolic rate (RMR) (6, 8), but also on the effect of increased weight on the energy cost of physical activity (PA). Eventually, both TEI and TEE (or more simply energy flux, EnFlux, because TEI ≈ TEE) are higher than before weight gain. We call the difference in EnFlux between the 2 time points the energy flux gap, and this number can be quite large when applied across the decades of the obesity epidemic.
FIGURE 1.
Schematic showing the energy balance characteristics of a population undergoing weight gain over a period of years. The energy imbalance gap is defined as the small average daily imbalance between total energy intake (TEI) and total energy expenditure (TEE), whereas the energy flux gap, which is the higher TEI and TEE (energy flux) associated with the higher weight, is relatively large.
The equilibrium point for a population, where the mean TEE, mean TEI, and mean body weight are all in a dynamic balance, is referred to here as a settling point (6), and perturbations of TEI or TEE can result in a shift in body weight toward a new settling point (11). Conceptualizing changes in mean weight between 2 states of equilibrium or settling points assumes that time A and time B represent points of stable, dynamic equilibrium between EnFlux and body weight. Even if these time points are in the upswing of an obesity epidemic, on any one day the population can be considered to be virtually at a settling point because the energy imbalance gap is <1% of total EnFlux.
The purpose of this analysis was to develop an equation relating EnFlux to body weight in adults so that estimations of the energy flux gap associated with the adult obesity epidemic can be made and the dominance of TEE or TEI in driving the epidemic can be deduced.
SUBJECTS AND METHODS
Participants
Data from studies that had measured TEE using standard doubly labeled water techniques (12) in 1399 adults aged ≥18 y were collected from 8 centers internationally—6 in the United States (13–17), one in the Netherlands (18), and one in New Zealand (19, 20). The inclusion of several centers meant that there was a spread of ethnicities in the database and that the net technical biases in measurements across centers would be minimized. Body weight was the dependent variable of interest, with TEE (or EnFlux) being the main independent variable of interest and height, age, and sex as confounding variables. Ten outliers were deleted (weight >150 kg, height >200 cm, TEE < 4000 kJ/d, or TEE > 23,000 kJ/d). Written informed consent was given by participants, and ethics approval was obtained by each of the participating institutions. The data set used for the previous similar study of 963 children aged 4–18 y (6) was compared with the adult findings.
Statistical analysis
The assumptions used in the previous analysis for children (6) were applied: first, that the TEE measured by doubly labeled water over ≈2 wk is equivalent to TEI (ie, EnFlux = TEE = TEI), and second, that EnFlux and body weight are interdependent and can be considered to be in a dynamic balance.
The distribution of body weight and EnFlux variables are known to be skewed (6, 21); therefore, both were converted to natural logarithms for analysis: ln weight in ln kg and ln EnFlux in ln kJ/d. This reduced the skewness of the variables, reduced the heteroscedasticity, and improved the linearity of the relation. Pearson product-moment correlations were calculated for the univariate analyses. For the multivariate analyses, height (cm), age (y), and sex (males = 0, females = 1) were added as covariates. The inclusion of ethnicity and study center as dummy variables greatly increased the complexity of the models and only gave a small increase in the R2 value (<0.02), so these variables were not further included in the analyses. Similarly, the inclusion of more complex terms in the equation (such as ln height, age2, or sex × ln EnFlux) did not meaningfully increase the R2 value and reduce the 95% CI for ln EnFlux. The equations presented are thus the parsimonious ones that nevertheless closely approximate the more complex equations. Statistical significance was defined at the 0.05 level.
Hierarchical multiple regression models were used with ln weight as the dependent variable. For the comparison between adults and children, the 95% bands (encompassing 95% of each population) were calculated with the effects of height, age, and sex removed to show the distinctness of the 2 populations in their relation between ln EnFlux and ln weight. All analyses used SPSS statistical software (version 14.0 for Windows; SPSS Inc, Chicago, IL).
RESULTS
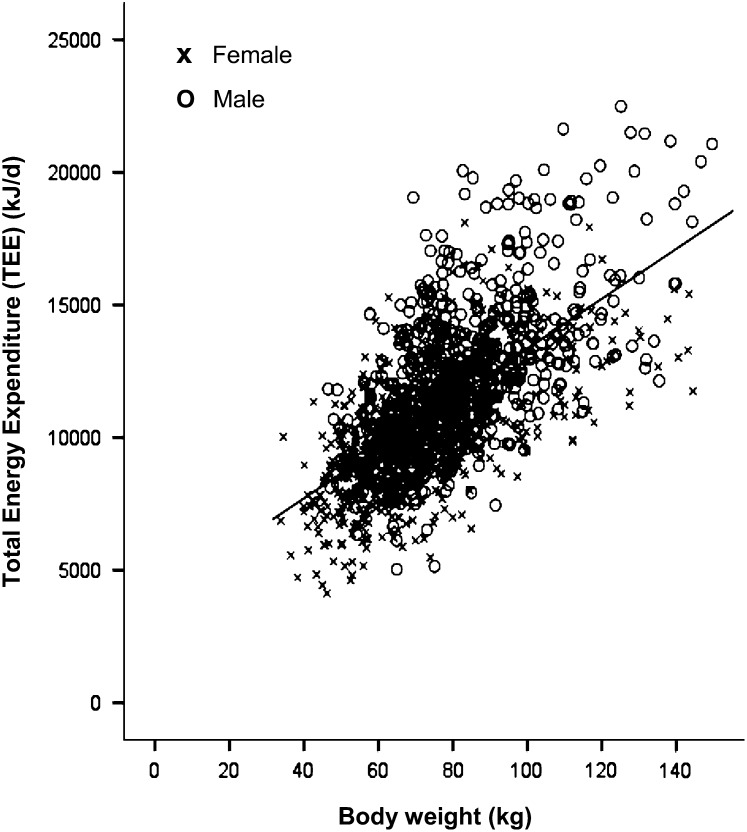
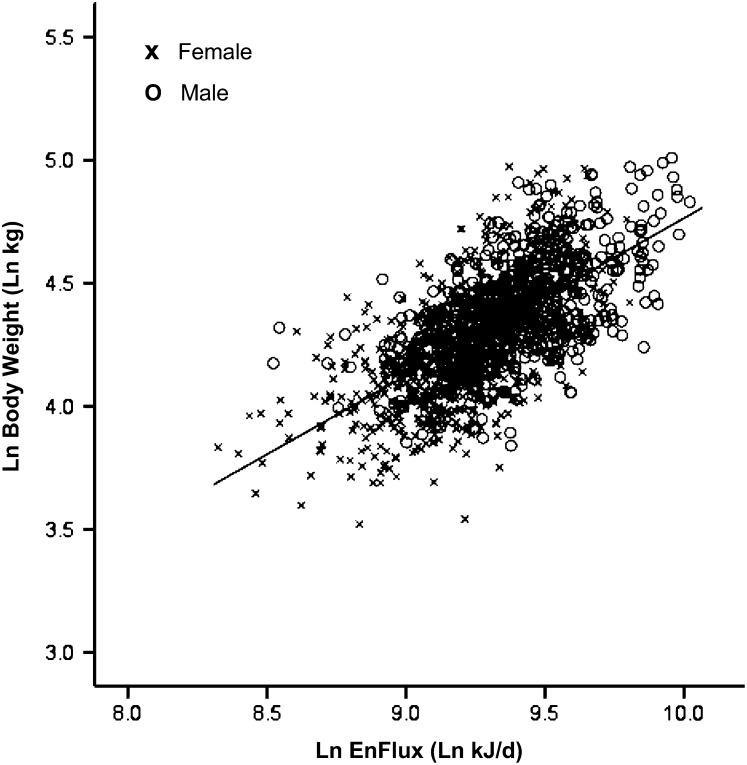
The characteristics of the 1399 participants are shown in Table 1 and demonstrate the wide range in age (18–98 y), weight (34–150 kg), and measured TEE (4.1–22.5 MJ/d) included in the sample. The relation for the raw data between weight and TEE (henceforth referred to as EnFlux) is shown in Figure 2, with weight as the independent variable. Viewed in this way, heavier people have a higher EnFlux, with the relation being significant for men (β = 93.0; 95% CI: 82.9, 103.1; P < 0.0001; intercept = 4723), women (β = 72.3; 95% CI: 65.6, 79.0; P < 0.0001; intercept = 4873), and both sexes combined (β = 94.0; 95% CI: 88.2, 99.8; P < 0.0001; intercept = 3945). Reversing the relation and log transforming the data gave the graph shown in Figure 3 (β = 0.64; 95% CI: 0.60, 0.68; P < 0.0001; intercept = −1.64). In this case, weight becomes the dependent variable. The R2 value was 0.43 (P < 0.0001) for the univariate relation in the log-transformed data and increased to 0.52 (P < 0.0001) when the covariates of height, age, and sex were added (Table 2). The equation from this multivariate analysis and subsequent algebraic transformations are shown below.
TABLE 1.
Characteristics of the study participants
| Men | Women | All | |
| No. of subjects | 652 | 747 | 1399 |
| Ethnicity (n) | |||
| White | 528 | 559 | 1087 |
| Black | 71 | 101 | 172 |
| Hispanic | 13 | 20 | 33 |
| Asian | 13 | 15 | 28 |
| Pacific Islander | 18 | 42 | 60 |
| Other/unspecified/unknown | 9 | 10 | 19 |
| Age (y) | 49.3 ± 18.0 (18–98)1 | 43.0 ± 19.1 (18–97) | 45.9 ± 18.8 (18–98) |
| Weight (kg) | 83.5 ± 17.4 (46.5–149.7) | 70.5 ± 18.7 (33.8–144.5) | 76.6 ± 19.2 (33.8–149.7) |
| Height (cm) | 176.5 ± 7.2 (152.0–197.0) | 163.7 ± 6.9 (143.2–186.0) | 169.6 ± 9.5 (143.2–197.0) |
| Total energy expenditure (kJ/d) | 12,489 ± 2796 (5033–22,486) | 9971 ± 2200 (4126–18,104) | 11,145 ± 2793 (4126–22,486) |
Mean ± SD; range in parentheses (all such values).
FIGURE 2.
The relation between body weight and energy flux in adults [energy flux = total energy expenditure (TEE) measured by the doubly labeled water technique], shown as the raw data with body weight as the independent variable (Pearson's correlation r = 0.65, P < 0.0001; n = 1399).
FIGURE 3.
The relation between body weight and energy flux (EnFlux) in adults (EnFlux = total energy expenditure measured by the doubly labeled water technique), shown as natural log-transformed data with energy flux as the independent variable (Pearson's correlation r = 0.65, P < 0.0001; n = 1399). Ln, natural log.
TABLE 2.
The hierarchical multiple regression model with the dependent variable being naturally log-transformed body weight (ln weight in ln kg)
| Variable | β (SE)1 | t value | P value | 95% CI for β |
| ln Energy flux | 0.712 (0.025) | 28.68 | <0.0001 | 0.663, 0.760 |
| Age (y) | 0.004 (0.000) | 15.14 | <0.0001 | 0.004, 0.005 |
| Height (cm) | 0.005 (0.001) | 7.43 | <0.0001 | 0.004, 0.007 |
| Sex2 | 0.074 (0.013) | 5.52 | <0.0001 | 0.047, 0.100 |
| Intercept | −3.431 (0.234) | −14.65 | <0.0001 | −3.890, −2.971 |
β coefficients are unstandardized.
Male = 0, female = 1.
Unstandardized coefficients derived from the regression model:
 |
Take the antilog of both sides of Equation 1:
 |
Transform into a ratio from time1 to time2 for considering the same population at different time points or population1 versus population2 with the same sex ratio (sex and constant variables cancel out):
 |
If height and age are considered the same (eg, in comparing cross-sectional data of 2 populations with comparable age and height distributions), these variables also cancel out:
 |
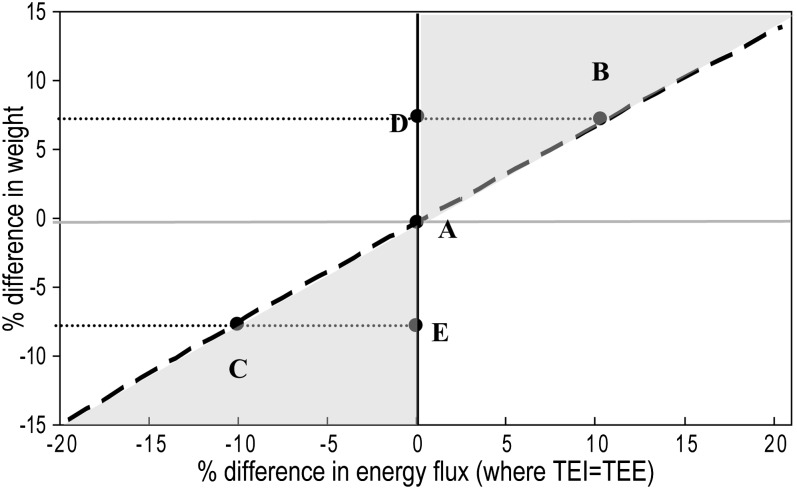
When the relation in Equation 4 is plotted over the range of ±20% change in EnFlux (ie, EnFlux2 = 0.8–1.2 × EnFlux1), the relation with the change in body weight is virtually linear with a slope of 0.71 (Figure 4, dashed line).
FIGURE 4.
The relation between energy flux and body weight (derived from Equation 4) is shown as the dotted line with a slope of 0.71. Compared with a population at point A, the settling points for other similar populations with a higher or lower energy intake (B and C, respectively) and lower or higher physical activity levels (D and E, respectively) are shown. A population with a combination of a higher energy intake and lower physical activity would fall into the top right shaded area, whereas a population with both a lower energy intake and a higher physical activity would fall into the lower left shaded area. TEE, total energy expenditure; TEI, total energy intake.
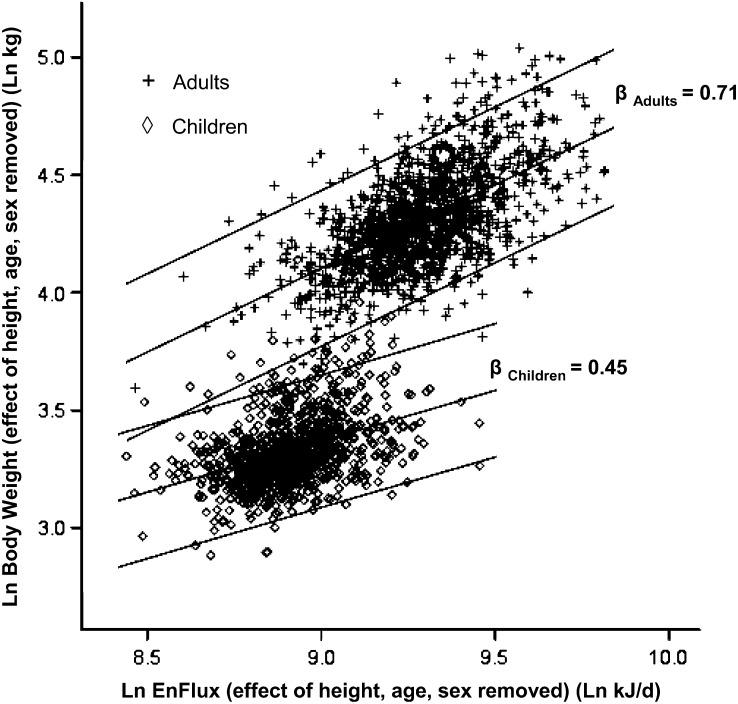
The 0.71 (95% CI: 0.66, 0.76) slope of the relation between EnFlux and body weight in adults was significantly different from that previously published for children of 0.45 (95% CI: 0.38, 0.51) (6). The effects of height, age, and sex were then removed for each of these populations separately, and the resultant scatter plots for adults and in children are shown in Figure 5 along with the regression lines and 95% prediction bands (containing 95% of data points) for each population. There was barely any overlap in the population groups, and the steeper adult gradient means that for a given increase in EnFlux (eg, a 10% increase in TEI), the proportional increase in weight for adults is greater (7.1%) than that for children (4.5%). This is likely to reflect the higher proportion of FFM to FM accumulated by children due to growth effects and perhaps less of a reduction in PA with weight gain compared with adults. Whereas height and age were included in the models to derive the equation for children, they probably did not account for all the effects of growth. To test this, we analyzed the relation between EnFlux and FFM for those participants who had available body-composition data (Table 3).
FIGURE 5.
The relation between energy flux (EnFlux) and body weight in adults (n = 1399) and children (n = 963) with both variables expressed as natural logs (Ln) with the effects of height, age, and sex removed. The lines represent the regression lines (derived from linear regression models) for each group with 95% prediction bands (containing 95% of each population).
TABLE 3.
Characteristics of the adults and children with fat-free mass data
| Adults (n = 897; 43% male) |
Children (n = 963; 46% male) |
|||
| Mean ± SD | Range | Mean ± SD | Range | |
| Age (y) | 45.3 ± 17.1 | 18.0–97.8 | 8.1 ± 2.8 | 3.9–18 |
| Weight (kg) | 77.3 ± 19.9 | 33.8–149.7 | 31.5 ± 17.6 | 13.6–141.2 |
| Fat-free mass (kg) | 50.4 ± 11.2 | 26.6–91.8 | 22.4 ± 10.0 | 10.8–82.5 |
| Fat (%) | 33.0 ± 10.5 | 1.5–82.0 | 26.4 ± 8.4 | 4.4–56.7 |
For adults, the β coefficient for ln EnFlux on ln FFM (dependent variable) adjusted for height, age, and sex was 0.48 (95% CI: 0.44, 0.51), whereas for children it was 0.31 (95% CI: 0.28, 0.34). Although still significantly different, the coefficients were much closer for FFM than for weight. Thus, a 10% increase in TEI would be expected to increase weight and FFM in adults by 7.1% and 4.8%, respectively, whereas in children it would be expected to increase weight by 4.5% and FFM by 3.1%.
DISCUSSION
This study showed that EnFlux, TEE, and TEI are positively related to body weight, which implies that a high TEI is the main driver of higher body weights in modern populations. A cross-sectional relation cannot usually be used to determine causality, but, in this case, the constraints of the first law of thermodynamics allowed us to infer that a high TEI must be the major driver of higher body weight in modern populations. If obesity was primarily determined by lower PA (including higher sedentariness), one would expect that the consequent reductions in activity energy expenditure would result in a lower TEE (EnFlux) being related to higher body weight (ie, a negative relation). The fact that the observed relation was strongly positive implies that the high EnFlux associated with a high body weight is because a high TEI is the main driver of both factors.
The slope of the relation (0.71) implies that a 10% higher TEI equates to a higher body weight of ≈7%. Thus, an increase in TEI of ≈5.5% per decade would therefore have been needed to drive the observed average weight gain of ≈4% (≈3 kg per decade) for US adults since the early 1970s (22). Using dietary intake data for adults in the 1970s (23) with a 20% allowance for underreporting (24) as a base, the energy flux gap for the 3 decades from the start of the obesity epidemic in the United States in the 1970s would be ≈1600 kJ/d. This is a substantial amount and small behavioral changes (4) will clearly not be sufficient to reverse the epidemic.
The generated equations can be extrapolated to provide further predictions about population weight differences in relation to behavioral differences in TEI or PA. The summary slope for adults linking body weight and EnFlux is shown in Figure 4 as the dotted line. Points A to E are all considered settling points or equilibria for populations of comparable age, height, and sex distributions, where weight is stable. For population B, which has a TEI 10% higher than population A, the mean weight is predicted to be 7% higher (assuming comparable PA). Using absolute values, if the adult population in this study (Table 1) had a 10% higher TEI (ie, 12,260 kJ/d instead of 11,145 kJ/d), the mean weight would be predicted to be 5.4 kg higher, at 82.0 kg. The TEE would, of course, also be 10% higher, largely because of the higher RMR, which increases in parallel with the weight gain. Conversely, if a population had a 10% lower TEI (10031 kJ/d) at settling point C, the mean weight would be 5.4 kg lower, at 71.2 kg.
The other scenarios in Figure 4 relate to differences in PA. If the energy cost of PA is consistently lower in one population (D) than another (A), with no compensatory differences in TEI, it is hypothesized that mean body weight for population D would be at some point vertically above the settling point for population A, with EnFlux remaining the same. In other words, at settling point D, the lower energy expenditure from reduced PA would have been exactly offset by the increase in RMR. Conversely, a higher level of PA without compensatory differences in TEI will place the settling point (E) vertically below population A; the higher cost of PA would be offset by the lower RMR because of the lower body weight. It is, therefore, concluded that a significant amount of the vertical variability about the regression lines in the scatter plots (Figures 2, 3, and 5) is due to differences in PA levels between individuals and the proportion of their weight that is FFM, both of which influence TEE and thus EnFlux.
It is hypothesized that combinations of behavioral differences will result in other settling points in the areas bounded by the “pure” behavior lines (dotted line for TEI and vertical line for PA). For example, a population with higher TEI plus lower PA than population A would be within the upper shaded area and one with a lower TEI plus higher PA would be in the lower shaded area. The quantitative nature of this construct means that this hypothesis is testable across populations.
It is important to note that, in physiologic terms, the energy cost of weight gain is substantially greater than the energy cost of weight loss (25, 26). Thus, Figure 4 may not be applicable to an individual person who is increasing or decreasing weight because the slopes for weight gain and weight loss would be different. In addition, experimental studies, such as the classic overfeeding and exercising studies by Bouchard et al (27, 28), usually imposed large energy imbalances over a relatively short periods of time so a new equilibrium may not be reached and the physiologic responses to large imbalances may be prominent (11, 29) and mask the true equilibrium status.
Whereas the main application of the constructs in Figure 4 is to compare across populations, the equations could be used to model population weight changes over long periods of time in response to behavioral changes (2) and should be more accurate than the simple, unbounded arithmetic that is sometimes used to predict weight change from a change in energy balance (1, 3, 30). For example, Dolan et al (3) estimated that prompts to take the stairs would increase the mean TEE by ≈40 kJ/d (0.67 kJ/ascent and descent of a step × 60 new steps/weekday) in those who responded to the prompts. For their hypothetical population (mean weight: 61 kg), they used a simple arithmetic to calculate that this would result in 300 g weight loss per year and, by inference, because such calculations are unbounded, 3 kg weight loss per decade. By our equations, 40 kJ/weekday or 30 kJ/d would be 0.33% of TEE for a population with a mean weight of 61 kg and EnFlux of 9 MJ/d. This would translate to a shift from a population settling point of 61 kg to a new settling point only 140 g lighter (0.33% × 0.71 = 0.23%, 0.0023 × 61000 g), and this weight loss would not continue ad infinitum without further behavioral changes. This avoids the trap of extrapolating small changes over long time periods to give unrealistic predictions of weight change.
An important assumption for these analyses is the concept of settling points, where TEI = TEE at a stable weight. As depicted in Figure 1, the energy imbalance gap is very small compared with the total energy flux and is considered negligible (or at least less than the reported precision of the doubly labeled water technique of ≈5–8%) for the 1–2 wk period when TEE was measured. This a reasonable assumption, because the protocols for doubly labeled water studies attempt to ensure weight maintenance over the measuring period, and the energy cost of linear growth is not an issue for adults as it is with children.
The differences between adults and children in the relation between EnFlux and body weight are interesting; adults need a greater proportional weight change to reach a new settling point for a given proportional change in EnFlux. Most of the explanation seems to lie in the greater proportion of lean mass to FM put on by children as they gain weight Additional contributors may be that weight gain reduces PA levels more in adults than it does in children.
In conclusion, the strength and direction of the relation between energy flux and body weight implicate substantial increases in energy intake as the main driver for the increase in the adults’ weight observed over the recent decades and, conversely, large decreases in energy intake and/or large increases in PA will be needed to reverse the prevalence of obesity.
Acknowledgments
The authors’ responsibilities were as follows—BAS: initiated the study, jointly formulated the major concepts, and drafted the manuscript; GS: coordinated the collation of the data from the various data sets, analyzed the results, jointly formulated the major concepts, and assisted in drafting the manuscript; SKL: assisted with the statistical analysis; KRW, ECR, MR, AL, DAS, JPD and NFB: provided data for the study, interpreted the findings, and critically reviewed the manuscript; and ER: helped to initiate the study and jointly formulated the major concepts. All authors reviewed and approved the final manuscript. None of the authors declared a conflict of interest.
REFERENCES
- 1.Brown WJ, Williams L, Ford JH, Ball K, Dobson AJ. Identifying the energy gap: magnitude and determinants of 5-year weight gain in midage women. Obes Res 2005;13:1431–41 [DOI] [PubMed] [Google Scholar]
- 2.Haby MM, Vos T, Carter R, et al. A new approach to assessing the health benefit from obesity interventions in children and adolescents: the assessing cost-effectiveness in obesity project. Int J Obes 2006;30:1463–75 [DOI] [PubMed] [Google Scholar]
- 3.Dolan MS, Weiss LA, Lewis RA, Pietrobelli A, Heo M, Faith MS. ‘Take the stairs instead of the escalator’: effect of environmental prompts on community stair use and implications for a national ‘Small Steps’ campaign. Obes Rev 2006;7:25–32 [DOI] [PubMed] [Google Scholar]
- 4.America on the Move. Available from: http://aom.americaonthemove.org (cited September 2008)
- 5.Hill JO, Wyatt HR, Reed GW, Peters JC. Obesity and the environment: where do we go from here? Science 2003;299:853–5 [DOI] [PubMed] [Google Scholar]
- 6.Swinburn BA, Jolley D, Kremer PJ, Salbe AD, Ravussin E. Estimating the effects of energy imbalance on changes in body weight in children. Am J Clin Nutr 2006;83:859–63 [DOI] [PubMed] [Google Scholar]
- 7.Wang YC, Gortmaker SL, Sobol AM, Kuntz KM. Estimating the energy gap among US children: a counterfactual approach. Pediatrics 2006;118:e1721–33 [DOI] [PubMed] [Google Scholar]
- 8.Bouchard C. The magnitude of the energy imbalance in obesity is generally underestimated. Int J Obes 2008;32:879–80 [DOI] [PubMed] [Google Scholar]
- 9.Butte NF, Ellis KJ. Comment on “Obesity and the Environment: Where Do We Go from Here?”. Science 2003;301:598. [DOI] [PubMed] [Google Scholar]
- 10.Butte NF, Christiansen E, Sorensen TIA. Energy imbalance underlying the development of childhood obesity. Obesity (Silver Spring) 2007;15:3056–66 [DOI] [PubMed] [Google Scholar]
- 11.Leibel RL, Rosenbaum M, Hirsch J. Changes in energy expenditure resulting from altered body weight. N Engl J Med 1995;332:621–8 [DOI] [PubMed] [Google Scholar]
- 12.Schoeller DA, Ravussin E, Schutz Y, Acheson KJ, Baertschi P, Jequier E. Energy expenditure by doubly labeled water: validation in humans and proposed calculation. Am J Physiol 1986;250:R823–30 [DOI] [PubMed] [Google Scholar]
- 13.Butte NF, Treuth MS, Mehta NR, Wong WW, Hopkinson JM, Smith EO. Energy requirements of women of reproductive age. Am J Clin Nutr 2003;77:630–8 [DOI] [PubMed] [Google Scholar]
- 14.Luke A, Durazo-Arvizu RA, Rotimi CN, et al. Activity energy expenditure and adiposity among black adults in Nigeria and the United States. Am J Clin Nutr 2002;75:1045–50 [DOI] [PubMed] [Google Scholar]
- 15.Subar AF, Kipnis V, Troiano RP, et al. Using intake biomarkers to evaluate the extent of dietary misreporting in a large sample of adults: the OPEN Study. Am J Epidemiol 2003;158:1–13 [DOI] [PubMed] [Google Scholar]
- 16.Rosenbaum M, Ravussin E, Matthews DE, et al. A comparative study of different means of assessing long-term energy expenditure in humans. Am J Physiol Regul Integr Comp Physiol 1996;270:R496–504 [DOI] [PubMed] [Google Scholar]
- 17.Martin CK, Heilbronn LK, de Jonge L, et al. Effect of calorie restriction on resting metabolic rate and spontaneous physical activity. Obesity (Silver Spring) 2007;15:2964–73 [DOI] [PubMed] [Google Scholar]
- 18.Westerterp KR, Speakman JR. Physical activity energy expenditure has not declined since the 1980s and matches energy expenditures of wild mammals. Int J Obes 2008;32:1256–63 [DOI] [PubMed] [Google Scholar]
- 19.Rush EC, Plank LD, Coward WA. Total energy expenditure and physical activity in NZ European and Polynesian women. Am J Clin Nutr 1999;69:43–8 [DOI] [PubMed] [Google Scholar]
- 20.Rush EC, Plank LD, Laulu M, Mitchelson E, Coward WA. Accuracy of dietary energy reporting in young New Zealand men and women: relationships to body composition, physical activity level and ethnicity. Int J Body Comp Res 2004;2:125–30 [Google Scholar]
- 21.White CR, Seymour RS. Mammalian basal metabolic rate is proportional to body mass2/3. Proc Natl Acad Sci USA 2003;100:4046–9 [DOI] [PMC free article] [PubMed] [Google Scholar]
- 22.National Center for Health Statistics 2004 With chartbook on trends in the health of Americans. Hyattsville, MD: US Department of Health, 2004 [PubMed] [Google Scholar]
- 23.Briefel RR, Sempos CT, McDowell MA, Chien S, Alaimo K. Dietary methods research in the third National Health and Nutrition Examination Survey: underreporting of energy intake. Am J Clin Nutr 1997;65(suppl):1203S–9S [DOI] [PubMed] [Google Scholar]
- 24.Trabulsi J, Schoeller DA. Evaluation of dietary assessment instruments against doubly labeled water, a biomarker of habitual energy intake. Am J Physiol Endocrinol Metab 2001;281:E891–9 [DOI] [PubMed] [Google Scholar]
- 25.Stubbs RJ, Johnstone AM, O'Reilly LM, Barton K, Reid C. The effect of covertly manipulating the energy density of mixed diets on ad libitum food intake in ‘pseudo free-living’ humans. Int J Obes 1998;22:980–7 [DOI] [PubMed] [Google Scholar]
- 26.Forbes GB, Brown MR, Welle SL, Lipinski BA. Deliberate overfeeding in women and men: energy cost and composition of the weight gain. Br J Nutr 1986;56:1–9 [DOI] [PubMed] [Google Scholar]
- 27.Bouchard C, Tremblay A, Despres JP, et al. The response to exercise with constant energy intake in identical twins. Obes Res 1994;2:400–10 [DOI] [PubMed] [Google Scholar]
- 28.Bouchard C, Tremblay A, Despres JP, et al. The response to long-term overfeeding in identical twins. N Engl J Med 1990;322:1477–82 [DOI] [PubMed] [Google Scholar]
- 29.Ravussin E, Swinburn BA. Metabolic predictors of obesity: crosssectional versus longitudinal data. Int J Obes 1993;17(suppl 3)S28–31 (discussion S41–2) [PubMed] [Google Scholar]
- 30.Levine JA, Lanningham-Foster LM, McCrady SK, et al. Interindividual variation in posture allocation: possible role in human obesity. Science 2005;307:584–6 [DOI] [PubMed] [Google Scholar]


