

Abstract
The Chlamydiae are a highly successful group of obligate intracellular bacteria, whose members are remarkably diverse, ranging from major pathogens of humans and animals to symbionts of ubiquitous protozoa. While their infective developmental stage, the elementary body (EB), has long been accepted to be completely metabolically inert, it has recently been shown to sustain some activities, including uptake of amino acids and protein biosynthesis. In the current study, we performed an in-depth characterization of the metabolic capabilities of EBs of the amoeba symbiont Protochlamydia amoebophila. A combined metabolomics approach, including fluorescence microscopy-based assays, isotope-ratio mass spectrometry (IRMS), ion cyclotron resonance Fourier transform mass spectrometry (ICR/FT-MS), and ultra-performance liquid chromatography mass spectrometry (UPLC-MS) was conducted, with a particular focus on the central carbon metabolism. In addition, the effect of nutrient deprivation on chlamydial infectivity was analyzed. Our investigations revealed that host-free P. amoebophila EBs maintain respiratory activity and metabolize D-glucose, including substrate uptake as well as host-free synthesis of labeled metabolites and release of labeled CO2 from 13C-labeled D-glucose. The pentose phosphate pathway was identified as major route of D-glucose catabolism and host-independent activity of the tricarboxylic acid (TCA) cycle was observed. Our data strongly suggest anabolic reactions in P. amoebophila EBs and demonstrate that under the applied conditions D-glucose availability is essential to sustain metabolic activity. Replacement of this substrate by L-glucose, a non-metabolizable sugar, led to a rapid decline in the number of infectious particles. Likewise, infectivity of Chlamydia trachomatis, a major human pathogen, also declined more rapidly in the absence of nutrients. Collectively, these findings demonstrate that D-glucose is utilized by P. amoebophila EBs and provide evidence that metabolic activity in the extracellular stage of chlamydiae is of major biological relevance as it is a critical factor affecting maintenance of infectivity.
Author Summary
The Chlamydiae are a group of bacteria that strictly rely on eukaryotic host cells as a niche for intracellular growth. This group includes major pathogens of humans and animals as well as symbionts of protists. Unlike most other bacteria, chlamydiae alternate between two distinct developmental stages. Here we provide novel insights into the infective stage, the elementary body (EB), which has been described almost a century ago and is commonly referred to as an inert spore-like particle. Our analyses of EBs of the amoeba symbiont Protochlamydia amoebophila provide a detailed overview of their metabolism outside of, and independent from, their natural host cells. We demonstrated that these EBs are capable of respiration and are active in the major routes of central carbon metabolism, including glucose import, biosynthetic reactions, and catabolism for energy generation. Glucose starvation resulted in a rapid decline of metabolic activity in P. amoebophila EBs and a concomitant decrease in their potential to infect new host cells. The human pathogen Chlamydia trachomatis was also dependent on nutrient availability for extracellular survival. The extent of metabolic activity in chlamydial EBs and its consequences for infectivity challenge long-standing textbook knowledge and demonstrate that the infective stage is far more dependent on its environment than previously recognized.
Introduction
The Chlamydiaceae are a group of obligate intracellular bacteria that have been well-known for more than a century and include some of the most successful bacterial pathogens. Two species in particular are considered to represent a major threat to human health, Chlamydia trachomatis, a well-established agent of trachoma and sexually transmitted disease [1], [2], and Chlamydia pneumoniae, which causes pneumonia and has also been associated with numerous chronic diseases [3]. More recently, the discovery of the so-called “environmental chlamydiae” has radically changed our perception of chlamydial diversity and distribution in nature. These newly discovered species, which are related to the Chlamydiaceae yet represent separate families within the phylum Chlamydiae, infect host species as diverse as vertebrates, invertebrates, and even protozoa [4], [5]. Their impact on human health is not yet well understood, though there is evidence that some species might represent emerging pathogens [4], [6]. Among the most well-studied representatives of the environmental chlamydiae are members of the family Parachlamydiaceae, in particular Protochlamydia amoebophila [7] and Parachlamydia acanthamoebae [8]. Although primarily considered to be symbionts of amoebae [4], [9], there are indications that they may be associated with human diseases, and in particular respiratory tract infections [10], [11].
Although we are just beginning to understand aspects of host range, host-symbiont interactions, and potential pathogenicity of these newly discovered species, it is well-established that all characterized environmental chlamydiae share distinctive key aspects of chlamydial biology with the Chlamydiaceae [4]. These include a strict dependence on a eukaryotic host cell as a replicative niche as well as a biphasic developmental cycle, both of which have major implications on the metabolic traits of this group of bacteria.
Investigations of the genomic repertoire of several members of the Chlamydiae have revealed that they harbor highly reduced metabolic capacities, presumably as a consequence of their adaptation to intracellular life [12]–[18]. Although environmental chlamydiae, including P. amoebophila, have a significantly larger genome size than the Chlamydiaceae, their metabolic potential is only slightly increased, and they are thus also strictly dependent on eukaryotic host cells [14], [16]–[19]. Despite being auxotrophic for most amino acids, cofactors, and nucleotides and being able to take up host-derived ATP, chlamydiae have at least partially maintained metabolic pathways devoted to carbon metabolism and energy generation [19]–[21]. However, little is known about the role of these metabolic features and the specific nutrient requirements throughout chlamydial development. As a consequence, axenic growth of chlamydiae has not yet been achieved.
The chlamydial developmental cycle comprises two major stages: the intracellular replicative reticulate bodies (RBs) and the extracellular, non-dividing, infectious elementary bodies (EBs). Transition stages are referred to as intermediate bodies (IBs) [22]. After their uptake into a host cell EBs differentiate into RBs, which then replicate within a membrane-enclosed compartment. At the end of the infection cycle the bacteria differentiate back into EBs, which are subsequently released into the environment to infect neighboring cells [23]. Chlamydial EBs, which thus serve as dispersal stage, have been shown to differ from RBs in several structural and biochemical features, which is thought to reflect adaptation to their main biological functions of extracellular survival and reinfection [24]. Accordingly, this developmental form was reported to be more resistant to harsh conditions and mechanical stress than the fragile replicative form due to its rigid, highly cross-linked outer membrane [25], [26] that has been suggested to represent a permeability barrier inhibiting uptake of nutrients [25], [27], [28]. EBs, moreover, have a distinct ultrastructure that is characterized by highly condensed chromatin [24]. DNA compaction, achieved by the action of chlamydial histone-like proteins [29]–[32], has been proposed to cause a complete shutdown of transcriptional activity in EBs [33], [34], which is also consistent with their reduced RNA to DNA ratio compared to the replicative stage [35].
Due to these structural and biochemical features, EBs have been thought to be completely metabolically inert particles. However, this concept has been challenged by recent studies. EB proteomes of diverse chlamydial species, including members of the Chlamydiaceae, as well as P. amoebophila, have been shown to comprise remarkably complete sets of proteins involved in transcription, translation, and energy metabolism [36]–[40]. Moreover, we recently observed that the chemically defined medium DGM-21A, which had originally been developed for cultivation of Acanthamoeba spp. [41], [42], sustains host-free activity of the infectious stage of chlamydiae [43]. More specifically, EBs of P. amoebophila and C. trachomatis incubated in DGM-21A maintained their ability to take up the amino acid L-phenylalanine in a process that could be reversibly inhibited by an ionophore, which demonstrated that EBs are dependent on a membrane potential and are able to reenergize their membrane [43]. Most recently, sustained metabolic activity of chlamydial EBs was shown in a study that demonstrated transcription and protein biosynthesis in host-free C. trachomatis EBs [44].
In the current study we focused on an in-depth investigation of the metabolic potential of P. amoebophila EBs in order to decipher the nature and biological significance of their activities. By applying a comprehensive combination of fluorescence microscopy- and mass spectrometry-based techniques, we could demonstrate respiratory activity and D-glucose utilization in EBs and, furthermore, could obtain first insights into the host-free central carbon metabolism of P. amoebophila. Importantly, our investigations revealed that the availability of a metabolizable substrate during host-free incubation significantly extends maintenance of infectivity in both, P. amoebophila and C. trachomatis, indicating a biological role for metabolic activity in the infectious stage.
Results
Respiratory Activity in Host-Free P. amoebophila EBs
P. amoebophila developmental stages were purified from amoeba host cells and physically separated from each other by density gradient centrifugation. This approach was originally described almost 50 years ago [35], [45] and is today widely applied for the analysis of Chlamydiaceae developmental forms (e.g. [39], [44]). We optimized this purification method for P. amoebophila in a previous study and have quantitatively evaluated the purity of obtained EB- and RB-enriched fractions using transmission electron microscopy (TEM) [43] (Fig. S1).
Host-free activity of P. amoebophila was initially analyzed by using the redox dye 5-cyano-2,3-ditolyl tetrazolium chloride (CTC), which is a non-fluorescent soluble molecule that is reduced by metabolically active cells, leading to intracellular deposition of bright red fluorescent crystals [46], [47]. Due to its good correlation with other measures of cellular respiration and studies indicating an involvement of electron transport chain activity, CTC reduction is considered to be an indicator for respiratory activity [47]–[50]. Purified EBs and RBs, as well as an intermediate fraction representing a mixture of all developmental stages of P. amoebophila, were incubated for 2 h in host-free modified DGM-21A medium (in this study referred to as DGM-D to indicate the presence of D-glucose) containing 5 mM CTC. Prior to fluorescence microscopic analysis, bacteria were additionally stained with the DNA dye 4′,6-diamidino-2-phenylindole (DAPI). Cells containing red fluorescent crystals were observed in all fractions, irrespective of whether the assessment of activity was started directly after the purification or after a 40 h pre-incubation in DGM-D (Fig. S2A–C). Heat-inactivated bacteria were inactive, indicating that CTC reduction was not an artifact caused by constituents of the incubation medium (Fig. S2D).
In order to exclude that residual host cell components that may be present in suspensions of purified bacteria contributed to observed activities, the CTC reducing capacity of lysates of uninfected Acanthamoeba was assessed as control. When freshly prepared lysates were analyzed, formation of CTC crystals could also be observed in the absence of bacteria (Fig. S2E). However, these signals, which were most likely derived from host mitochondria, could be clearly distinguished from active bacteria, due to their larger size and irregular shape. In addition, they did not co-localize with bright DAPI signals that can typically be observed for living bacteria, but not for mitochondria or other components in host cell lysates, which are only weakly stained with this dye. CTC crystals of similar appearance, potentially formed by remaining host components, were occasionally observed in fractions of purified chlamydiae, but were not considered during quantitative assessments of bacterial activity. Most importantly, CTC reduction was not detected in host lysates that were pre-incubated for 40 h before analysis (Fig. S2E), demonstrating that residual host-derived activity is not stable under these conditions.
In order to directly compare the respiratory activity between developmental forms in freshly purified suspensions, the proportion of DAPI-stained chlamydiae able to reduce CTC was determined. Examination using differential interference contrast (DIC) microscopy additionally revealed that most bacteria in EB and intermediate fractions were detectable by DAPI (90.0% (±4.1) and 79.1% (±4.0), respectively), whereas a significant proportion of bacteria in the RB fraction (49.1% (±2.7)) were not. This suggests that, consistent with the frequently reported fragility of this developmental stage [22], [35], [44], many RBs were damaged during the purification procedure or rapidly lysed during the short host-free incubation with CTC. Proportions of active bacteria were therefore corrected to account for the different detectability with DAPI. This analysis revealed that only 24.4% (±2.2) of the bacterial particles in the RB fraction were active, whereas 52.3% (±2.9) of the bacteria in the EB fraction contained intracellular CTC crystals (Fig. 1).
Figure 1. Respiratory activity of P. amoebophila developmental stages and effect of D-glucose deprivation.
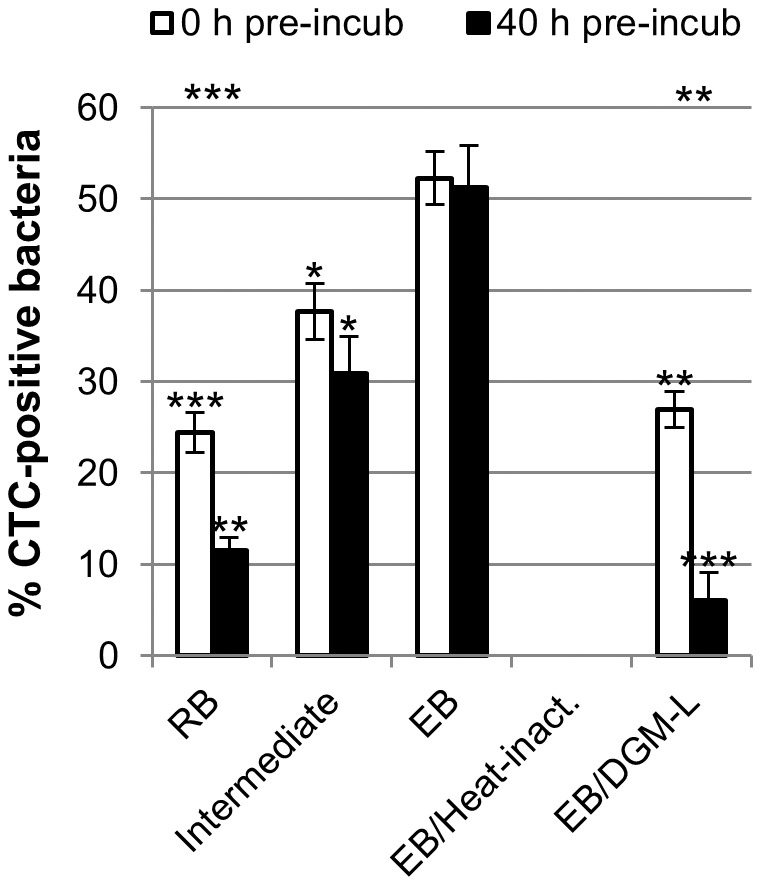
Fractions of P. amoebophila developmental forms were subjected to host-free incubation in DGM-D (or DGM-L, if indicated) containing 5 mM CTC, either immediately after purification (“0 h pre-incub”) or after a 40 h pre-incubation in the respective medium (“40 h pre-incub”), followed by the detection of bacteria with the DNA dye DAPI. Heat-inactivated EBs were included as control. The percentage of CTC-positive DAPI-stained bacteria was determined and subsequently corrected based on observed differences in the detectability of bacteria among fractions. Displayed data represent means and standard deviations of three independent experiments. For each experiment and condition, in total 1500 bacteria were considered for the quantification of CTC-positive bacteria, and 450 bacteria for the subsequent correction. Statistically significant differences compared to the EB fraction (ANOVA) are indicated by stars located directly above the bars, significant differences between immediate activity and activity after pre-incubation (t-test) are indicated by the stars at the upper edge of the diagram (***, p≤0.001; **, p≤0.01; *, p≤0.05).
When bacterial activity was assessed after a host-free incubation for 40 h in DGM-D, a highly significant decrease in the proportion of active bacteria was observed in the RB fraction, in which only 11.5% (±1.4) of the DIC-detectable particles had maintained their ability to reduce CTC (Fig. 1) (t-test, p≤0.001). This observation can most likely be explained by significant lysis of the more fragile RBs during the extracellular incubation. However, the degree of bacterial disintegration might be greatly underestimated by our assessment due to the fact that completely lysed bacteria might not be detectable in DIC. Based on this consideration and the fact that, according to a recent ultrastructural analysis, suspensions of purified RBs initially still contain about 5% EBs [43], it appears most likely that this residual activity originates from the more stable EBs in this fraction. In fact, the proportion of active bacteria in the EB fraction, which initially contained about 76% mature EBs and only 8% RBs [43], was still 51.3% (±4.6) after 40 h incubation and thus almost unchanged compared to the active proportion detected in freshly purified suspensions (Fig. 1).
Collectively, these findings demonstrate that respiratory activity in EB fractions cannot be solely attributed to a contamination with other developmental stages or host-derived components, but truly occurs in P. amoebophila EBs. They furthermore indicate that EB activity is stable in a host-free environment, whereas activity declines more rapidly in RB fractions. This observation, together with the observed instability of host-derived activity, was exploited in the following experiments, in which a pre-incubation of purified bacteria was intentionally applied not only to ensure that truly host-free metabolic activity is assessed, but also to exclude significant contributions of co-purified RBs or host components.
Effect of D-Glucose Deprivation on Host-Free Respiratory Activity in EBs
The observation of sustained respiratory activity in P. amoebophila EBs during host-free incubation suggested that the DGM-D medium contains substrates that the bacteria can utilize to fuel metabolic activities. The defined medium includes a variety of potential carbon compounds, including all proteinogenic amino acids, some of which may also be fed into energy generating metabolic pathways according to the predictions from genome annotation [14]. DGM-D, however, also contains D-glucose, and we recently observed that host-free activity of chlamydiae could not be sustained in the incubation medium reported by Hatch [43], which as a major difference to DGM-D does not contain any carbohydrates [51]. This consideration and the fact that the P. amoebophila genome encodes a complete pathway for D-glucose catabolism [14] prompted us to test whether D-glucose deprivation would affect host-free activity of P. amoebophila EBs. Complete withdrawal of glucose from DGM-D would change the physicochemical characteristics of the medium, such as the osmolarity, and it is unknown whether this could have an effect on bacterial activity. Respiratory activity of EBs was thus analyzed in a modified medium termed DGM-L, in which D-glucose was not simply omitted but replaced by its stereoisomer L-glucose, which cannot be metabolized by most organisms [52]–[54]. This replacement of substrates led to a significant decrease in the proportion of active bacteria, as inferred from their capability to reduce CTC (Fig. 1 and S2F) (Analysis of variance (ANOVA), p≤0.01). Moreover, though directly after purification from host cells 27.0% (±1.9) of the EBs detectable in DIC appeared to be metabolically active in DGM-L, a large reduction in active cells (to 6.0% (±3.1)) was observed when purified EBs were analyzed after 40 h pre-incubation in this D-glucose-free medium (Fig. 1).
These findings demonstrate that the nutrient composition of the host-free incubation medium affects P. amoebophila EB activity as well as its maintenance. Moreover, they suggest that D-glucose might serve as an energy source for the bacteria during host-free incubation.
D-Glucose Uptake by Host-Free P. amoebophila EBs
In order to further explore the potential for D-glucose utilization by P. amoebophila EBs, we next investigated whether the bacteria were able to import this substrate under host-free conditions by applying 2-[N-(7-Nitrobenz-2-oxa-1,3-diazol-4-yl)amino]-2 deoxy-D-glucose (2-NBDG), a fluorescent analog that has previously been used as an indicator for D-glucose uptake in living cells [55]. In addition, isotope ratio mass spectrometry (IRMS), a method suitable for the analysis of the isotopic composition of biological samples [56], was applied as a supplementary technique to directly prove the import of non-derivatized sugar molecules.
For the fluorescence-based assay, purified living and heat-inactivated EBs were incubated for 10 h with 100 µM 2-NBDG in DGM-D/2, a medium containing a reduced concentration of non-fluorescent D-glucose, followed by microscopic examination. 2-NBDG uptake could be detected in living but not in heat-inactivated bacteria, irrespective of whether they were assessed directly after purification or after pre-incubation in DGM-D. The proportion of chlamydiae able to take up 2-NBDG remained stable over time and was similar to the proportion of respiratorily active cells, comprising 47.8% (±1.7) or 53.4% (±3.4) of all bacterial particles before or after pre-incubation, respectively (Fig. 2).
Figure 2. Visualization of D-glucose uptake by host-free P. amoebophila EBs.

Living or heat-inactivated P. amoebophila EBs were subjected to host-free incubation in DGM-D/2 containing 100 µM of the green-fluorescent D-glucose analog 2-NBDG. The incubation was conducted either immediately after purification or after a 40 h pre-incubation in DGM-D. Representative fluorescence and DIC images are shown. The bar indicates 10 µm.
For IRMS analysis, a pre-incubated EB-enriched fraction was further incubated for 48 h in DGM-D-13C, a medium in which D-glucose was replaced by its fully 13C-labeled isotopolog (D-[U-13C6]-glucose). Bacterial biomass was then subjected to IRMS. Based on the measured carbon content of the biomass and the ratio of 13C to 12C in the sample, the amount of 13C that was incorporated by purified EBs during the whole period of host-free incubation could be calculated. Although a slight enrichment in 13C (11.0 (±1.9) nmol 13C/mg dry weight (DW)) was also detected for heat-inactivated bacteria (Fig. S3), presumably as a result of substrate adsorption to the bacterial surface, a significantly higher incorporation (48.1 (±7.4) nmol 13C/mg DW) was observed for living bacteria (t-test, p≤0.001).
Taken together these findings clearly demonstrate active uptake of D-glucose by host-free P. amoebophila. The high proportion of bacteria able to import the fluorescent analog 2-NBDG once more shows that this activity is not restricted to a small proportion of possibly co-purified RBs or transition stages, but occurs in the EB stage. The consistency between the percentage of respiratorily active bacteria and bacteria that imported D-glucose further supports the concept that P. amoebophila EBs may not only import, but also metabolize D-glucose under host-free conditions.
Catabolism of D-Glucose by Host-Free P. amoebophila EBs
Host-free incubations with D-[U-13C6]-glucose were carried out in gas-tight vials. Thus, not only incorporation of the label into the biomass, but also respiratory activity, inferred from 13CO2 release, could be analyzed. For this purpose, gas samples that were collected from the headspace of the incubations were subjected to IRMS analysis to measure the amount of CO2 and the atom percent 13C (At%13C) in the CO2. When expressed as enrichment relative to values obtained for blank incubations of bacteria-free media, these serve as measure for CO2 production and for the enrichment of 13C, respectively.
In general, CO2 amounts in the headspace of incubations were increased compared to the composition of normal lab air even in the absence of bacteria, suggesting that a part of the newly formed CO2 may be derived from outgassing carbonate. However, the presence of living bacteria led to a marked increase of 146.5 (±33.9) ppm CO2/ml (Fig. 3A). Moreover, a significant enrichment of 13C in CO2 (atom percent 13C enrichment (APE13C) 30.7 (±4.5)) could be detected in the presence of D-[U-13C6]-glucose (ANOVA, p≤0.001). In contrast, biological CO2 production was not observed when heat-inactivated bacteria were used.
Figure 3. D-glucose catabolism by host-free P. amoebophila EBs revealed by IRMS.

Purified P. amoebophila EBs (EB-enriched fraction (A); highly pure EB fraction (B)) were pre-incubated for 40 h in DGM-D, followed by 48 h incubation in different media (DGM-D or DGM-D-13C (A); DGM-D, DGM-D-1-13C, DGM-D-6-13C, DGM-D-13C, or DGM-L (B)) and subsequent CO2 measurement in the headspace of incubations by IRMS. As control, heat-inactivated bacteria (“EB-hi”) (A) or host cell lysates (B) incubated in DGM-D-13C were handled in parallel. CO2 production (in ppm CO2/ml; white circles) and the APE13C in the CO2 (black diamonds) are displayed. Diamonds and circles indicate results from individual replicates, bars display mean values. The black solid line highlights the base line for CO2 release and APE13C, which corresponds to values observed in the blanks, i.e. bacteria-free incubations of the respective media. Results from three independent experiments each consisting of two replicate incubations per condition are shown. An exception was the incubation in DGM-L, for which only two experiments were conducted. Statistically significant differences are indicated (for CO2 release and APE13C at the upper or lower edge of the diagram, respectively) in respect to living bacteria incubated in DGM-D (ANOVA) (***, p≤0.001; **, p≤0.01; *, p≤0.05). Note that bacterial numbers that were applied per incubation were similar between replicate experiments (between 3.9×10⁹ and 5.9×10⁹ bacteria (A); between 6.3×10⁸ and 1.0×10⁹ bacteria (B)), but were significantly different between (A) and (B), explaining observed differences in the extents of CO2 production.
Taken together, these findings provide further evidence that EBs of P. amoebophila are metabolically active under host-free conditions and demonstrate that the observed CO2 formation can, at least partly, be attributed to D-glucose catabolism.
Insights into D-Glucose Metabolism in Host-Free P. amoebophila EBs by IRMS
Though CO2 production evidences metabolic activity it does not necessarily indicate complete catabolism of a given substrate, as several biochemical pathways involve only partial substrate breakdown. Defining the exact position of carbon atoms in the substrate molecule that are liberated as CO2 thus aids in a better understanding of the activity of certain metabolic pathways. In the present study, the contribution of different carbon atoms in D-glucose to CO2 produced by host-free EB activity was investigated by IRMS. For this purpose, a pre-incubated EB fraction was further incubated for 48 h in DGM-D, DGM-D-13C, DGM-D-1-13C, or DGM-D-6-13C. These media contained unlabeled D-glucose, fully 13C-labeled D-glucose (D-[U-13C6]-glucose), D-glucose labeled exclusively at carbon 1 (D-[1-13C]-glucose), or D-glucose labeled at carbon 6 (D-[6-13C]-glucose), respectively. Moreover, incubation of EBs in DGM-L was included to analyze the effect of D-glucose deprivation on CO2 production. Host cell lysates incubated in DGM-D-13C were handled in parallel to test for potential contributions of residual host-derived activity.
CO2 production was observed for all incubations of living bacteria in media containing D-glucose, as inferred from an average increase in detectable CO2 of 29.0 (±11.1) ppm/ml relative to amounts detected in blank incubations of bacteria-free media (Fig. 3B). Taking into account that about six times fewer bacterial cells were applied per incubation, the extent of CO2 release appeared to be very similar to that observed in the previous experiment (Fig. 3A). Substrate deprivation, i.e. the replacement of D-glucose by L-glucose, reduced CO2 formation to background levels (Fig. 3B). Respiratory activity was also not observed in amoebal lysates. An enrichment of 13C in CO2 was detected for all incubations of living bacteria in media containing 13C-labeled D-glucose. However, the degree of labeling was highly variable depending on the variant of labeled substrate included. As expected the greatest formation of 13CO2 was observed in the presence of the fully labeled D-glucose (APE13C 15.2 (±3.4)), which was about 4.4 times higher than that observed for D-[1-13C]-glucose and about 21.2 times higher than that observed for D-[6-13C]-glucose. The calculated ratio for the APE13C was 21.2 (DGM-D-13C):4.8 (DGM-D-1-13C):1.0 (DGM-D-6-13C). Production of 13CO2 could not be detected for host cell lysates.
Liberation of carbon 6 from D-glucose as CO2 is usually only observed as a consequence of tricarboxylic acid (TCA) cycle activity and is therefore evidence for a functional sugar catabolism in extracellular EBs of P. amoebophila. However, our data do not support a scenario in which all assimilated D-glucose would be fully catabolized to CO2 via glycolysis and/or pentose phosphate pathway (PPP) combined with TCA cycle activity, as this would result in equal amounts of released carbon 1 and carbon 6. The preferred release of carbon 1 indicates that D-glucose also passes through the oxidative part of the PPP without being coupled to a subsequent complete breakdown of its products. Moreover, the observed extent of 13CO2 production from fully labeled D-glucose additionally indicates that also carbon atoms other than carbon 1 are released from D-glucose as CO2 in metabolic reactions that do not lead to complete catabolism. Thus, a proportion of the metabolized D-glucose may be devoted to anabolic reactions, including for example pathways such as fatty acid and isoprenoid synthesis, which begin with a decarboxylation of pyruvate. We focused on the three metabolic scenarios outlined above to model their contributions to CO2 production using the calculation described in detail in Fig. S4. Our data would be consistent with a theoretical ratio of 6.2 (putative anabolic reactions):3.8 (oxidative part of PPP):1.0 (complete catabolism). This finding suggests that the experimentally obtained data are plausible and can be explained by a reasonable simplified metabolic model. The calculation, furthermore, suggests that a major proportion of D-glucose is not completely degraded, but may enter anabolic pathways.
Central Carbon Metabolism of Host-Free P. amoebophila EBs Revealed by Mass Spectrometric Metabolite Analysis
In order to obtain deeper insights into the metabolism of host-free P. amoebophila EBs and to explore the intracellular fate of 13C-labeled D-glucose we next conducted a mass spectrometric metabolite analysis combining ion cyclotron resonance Fourier transform mass spectrometry (ICR/FT-MS) and ultra-performance liquid chromatography mass spectrometry (UPLC-MS). ICR/FT-MS offers ultra-high resolution, enabling the distinction of several thousands of ions. This technique provides extremely high mass accuracy, which allows direct calculation of the elemental composition of detected compounds and thereby facilitates metabolite annotation and clear discrimination between isotopologs [57], [58]. However, as chromatographic separation of analytes prior to mass spectrometric analysis carries several advantages over direct injection experiments such as decreased matrix effects, separation of isobaric compounds, and delivery of additional information about physicochemical properties of analytes by their retention time [59], [60], we additionally conducted UPLC-MS as second analytical technique, in particular to verify the detection of labeled metabolic intermediates.
Prior to the analysis, metabolites were extracted from an EB-enriched fraction that had been pre-incubated and subsequently incubated for 48 h in DGM-D-13C15N, a modified medium containing 13C-labeled D-glucose and 13C15N-labeled L-phenylalanine, or in DGM-D, containing the corresponding unlabeled substrates. Heat-inactivated bacteria incubated in DGM-D-13C15N were also analyzed. Labeled L-phenylalanine was included in this experiment as a control, as it is a substrate that is taken up by host-free EBs [43] and which exhibits only limited potential of being further metabolized by P. amoebophila according to predictions from the genome [14].
ICR/FT-MS analysis enabled the assignment of 1674 and 1767 m/z features to DGM-D-13C15N- or DGM-D-incubated bacteria, respectively. In order to gain a first impression on the sample composition, masses that were detected in extracts from DGM-D-incubated EBs were submitted to MassTRIX for annotation [61]. This analysis revealed that metabolites from several different biochemical pathways were detected; including compounds involved in amino acid-, nucleotide-, sugar-, and lipid metabolism (Fig. 4). Spectra of living bacteria were highly similar to each other irrespective of the applied incubation medium, indicating that the presence of the stable isotope-labeled substrates did not affect the metabolite pattern (Fig. S5A). To verify this visual impression, we investigated the data using principal component analysis (PCA). Extracts from living bacteria that were incubated either in DGM-D-13C15N or in DGM-D clustered together in the PCA ordination, which confirms that the samples were comparable in their general composition (Fig. S5B). We additionally produced PCA ordinations including data from the heat-inactivated EBs. Both ordinations, which included dead bacteria incubated in DGM-D-13C15N and living bacteria incubated either in DGM-D or in DGM-D-13C15N, revealed a separation between living and inactivated bacteria that reflects the presence of different molecular patterns (Fig. S5C–D). Metabolites that are discriminative for living EBs, i.e. compounds that can be detected in living, but not or only in low amounts, in inactivated bacteria, might represent valuable indicators for an active metabolism. As a next step we applied a partial least square discriminative analysis (PLS-DA) model including data from DGM-D-incubated living and DGM-D-13C15N-incubated inactivated EBs (R2Y(cum) = 0.926,Q2 = 0.834) (Fig. S6). MassTRIX annotation of the most relevant m/z features revealed that metabolites from the amino acid-, nucleotide-, and central carbon metabolism were discriminative for living EBs, whereas the pattern of metabolites assigned to lipid metabolism appeared to be less affected (Fig. 4).
Figure 4. Overview of ICR/FT-MS-detected annotated compounds and of metabolites discriminative for living compared to inactivated EBs.

An EB-enriched fraction of P. amoebophila was pre-incubated for 40 h in DGM-D, followed by 48 h incubation in DGM-D or DGM-D-13C15N and subsequent mass spectrometric analysis of metabolite extracts. Heat-inactivated EBs incubated in DGM-D-13C15N were included as control. M/z features detected by ICR/FT-MS in samples of DGM-D-incubated EBs were annotated by MassTRIX [61], followed by data analysis using PLS-DA (Fig. S6) to extract the most discriminative compounds characterizing living compared to inactivated EBs. The PLS-DA model included data from DGM-D-incubated living and DGM-D-13C15N-incubated inactivated EBs. Bars indicate the total number of annotated metabolites that were assigned to specific KEGG pathways. The number of metabolites that were found to be discriminative (black) or non-discriminative (white) for living EBs are additionally indicated. Note that metabolites from carbohydrate, nucleotide, cofactor, vitamin, and amino acid metabolism were more abundant in living EBs, whereas the pattern of lipid species was more similar between living and inactivated bacteria.
To obtain deeper insights into the central carbon metabolism of host-free EBs, further data analysis focused on 13C-labeled metabolites that were derived from 13C-labeled D-glucose. Labeled metabolites were identified based on their accurate mass and presence of their unlabeled metabolite analogs in extracts of bacteria incubated in DGM-D by application of mass difference-based networks. Peaks corresponding to fully labeled glucose (C6H12O6) and phenylalanine (C9H11NO2) could be readily detected in extracts from bacteria incubated in DGM-D-13C15N (Table 1). Both metabolites were, however, also detected in ICR/FT-MS and UPLC-MS spectra from heat-inactivated bacteria. This suggests adsorption of these substrates to bacterial surfaces, a phenomenon that was already noted in the IRMS-based analysis (Fig. S3). Beside glucose and phenylalanine, 34 additional fully or partially 13C-labeled metabolites were detected in ICR/FT-MS spectra of living, but not heat-inactivated, bacteria incubated in DGM-D-13C15N (Table 1 and S1). According to their predicted chemical composition, some of these metabolites could be annotated as phosphorylated hexose (C6H13O9P, hexose-P) (Fig. 5), biphosphorylated hexose (C6H14O12P2, hexose-PP), a short chain hydroxy acid (C6H12O7, e.g. gluconate), a phosphorylated heptose (C7H15O10P, heptose-P), a short chain tricarboxylic acid (C6H8O7; e.g. citrate), a disaccharide (C12H22O11), and a trisaccharide (C18H32O16). UPLC-MS analysis confirmed the presence of these metabolites. Only the detection of biphosphorylated hexose could not be verified, due to the absence of the corresponding peak of the labeled and unlabeled compound in UPLC-MS spectra. Moreover, UPLC-MS detected several additional labeled metabolites, such as phosphorylated pentose (C5H11O8P, pentose-P), phosphorylated tetrose (C4H9O7P, tetrose-P), and a short chain acyl phosphate (C3H5O6P; e.g. phosphoenolpyruvate) (Table 1).
Table 1. Annotated 13C-labeled metabolites detected in DGM-D-13C15N-incubated EBs by a combination of ICR/FT-MS and UPLC-MS.
| Detected m/za) | |||||
| Elemental composition | Annotation (example) | [M-H+]− | [M+Cl−]− | Number of 13C atomsb) | Detection methodc) |
| C6H12O6 | Glucose | 185.07624 | 221.05292 | 6d) | A(H,Cl); B(H,Cl) |
| 184.07288 | 220.04957 | 5d) | A(H,Cl); B(H,Cl) | ||
| C6H13O9P | Hexose-P | 265.04257 | 6 | A(H); B(H) | |
| 264.03923 | 5 | A(H); B(H) | |||
| 262.03246 | 3 | A(H); B(H) – traces | |||
| C6H14O12P2 | Hexose-PP | 377.97560 | 3 | A(Cl) | |
| C3H5O6P | Phosphoenol-pyruvate | 205.961 | 3 | B(Cl) | |
| C6H8O7 | Citrate | 197.040 | 6 | B(H) | |
| 196.037 | 5 | B(H) | |||
| 195.03315 | 4 | A(H); B(H) | |||
| 194.02979 | 3 | A(H); B(H) | |||
| 193.026 | 2 | B(H) | |||
| C5H11O8P | Pentose-P | 234.029 | 5 | B(H) | |
| C7H15O10P | Heptose-P | 296.05649 | 7 | A(H); B(H) | |
| 295.05314 | 6 | A(H); B(H) | |||
| C4H9O7P | Tetrose-P | 203.015 | 4 | B(H) | |
| 202.011 | 3 | B(H) | |||
| C6H12O7 | Gluconate | 201.07116 | 6 | A(H) | |
| C12H22O11 | Disaccharide | 353.14920 | 389.12587 | 12d) | A(H,Cl); B(H,Cl) |
| 352.146 | 388.12252 | 11d) | A(Cl); B(H) | ||
| 383.10575 | 6 | A(Cl) | |||
| C18H32O16 | Trisaccharide | 557.19883 | 18 | A(Cl) – traces | |
a)The detected m/z is given for each ion species with the instrument given accuracy.
b)Labeled metabolites were considered to be present in extracts of DGM-D-13C15N-incubated EBs when peaks corresponding to the exact mass of the unlabeled metabolites were detected in the DGM-D-incubated controls and observed mass shifts were consistent with the exchange of 12C by 13C atoms. Metabolites containing single 13C atoms were also observed in extracts from DGM-D-incubated EBs, due to the natural isotopic distribution of carbon, and were thus excluded.
c)The detection method (A: ICR/FT-MS; B: UPLC-MS) is indicated, as well as the ion species detected (H: [M-H+]−; Cl: [M+Cl−]−).
d)These metabolites were detected by ICR/FT-MS analysis in purchased D-[U-13C6]-glucose and were thus not considered as host-free synthesized metabolites.
Figure 5. ESI(-)ICR/FT-MS spectra indicating host-free synthesis of hexose-P by P.

amoebophila EBs. An enlarged view on the mass range 265.00–265.12 in ESI(-)ICR/FT-MS spectra of DGM-D- and DGM-D-13C15N-incubated living and DGM-D-13C15N-incubated inactivated bacteria is shown. Note that the peak indicating fully 13C-labeled hexose-P (13C6H13O9P) can only be seen in spectra from DGM-D-13C15N-incubated living EBs, but not in the controls, demonstrating host-free synthesis of hexose-P by P. amoebophila EBs.
Altogether, detection of these labeled metabolites indicates synthesis of key intermediates of glycolysis/gluconeogenesis, PPP, and the TCA cycle in host-free P. amoebophila EBs (Fig. 6). Beside the detection of the 13C-labeled isotopologs, most of those metabolites were also detected as unlabeled molecules in extracts from DGM-D-13C15N-incubated EBs, indicating co-utilization of D-[U-13C6]-glucose with additional unlabeled carbon compounds. The observed abundance ratios of 12C and 13C atoms in the detected labeled metabolites suggest a rather minor glycolytic catabolic activity in host-free EBs and a predominant catabolism of D-glucose by the PPP. In fact, whereas labeled metabolites in the PPP were only detected as fully labeled molecules, clearly demonstrating their origin from D-[U-13C6]-glucose, the mass signal corresponding to biphosphorylated hexoses only indicated the presence of a partially labeled metabolite, which is inconsistent with its generation by glycolytic breakdown of fully labeled D-glucose, but may result from joining of one unlabeled C3 and one fully labeled C3 body by a reverse aldolase reaction during gluconeogenesis. This interpretation is consistent with the detection of traces of partially labeled phosphorylated hexose. In addition, the observed synthesis of a partially labeled disaccharide and traces of a labeled trisaccharide further support the occurrence of anabolic activities in host-free P. amoebophila EBs.
Figure 6. Central carbon metabolism in P. amoebophila EBs deduced from mass spectrometry-based metabolite analysis.

A schematic representation of the central carbon metabolism in P. amoebophila is shown in (A). 13C-labeled metabolites detected by ICR/FT-MS or UPLC-MS in extracts of DGM-D-13C15N-incubated living bacteria are indicated. The isotopologs that were observed are additionally specified by bars, consisting of a number of units equal to the number of C atoms in the molecules, whereby each unit of the bar indicates either a 12C (white) or a 13C (gray) atom. Percentage values next to the bars denote the relative abundance of the isotopologs calculated from the mass signal intensity or peak area of the respective peak (for ICR/FT-MS or UPLC-MS data, respectively) compared to peaks of the unlabeled metabolite detected in DGM-D-incubated bacteria. For citrate, for which all possible isotopologs were detected by UPLC-MS, instead of bars the complete isotopolog profile observed in DGM-D-13C15N-incubated living EBs is shown. In (B), mass signal intensities and peak areas (for ICR/FT-MS or UPLC-MS data, respectively) of selected fully 13C-labeled (“13C”) and corresponding unlabeled (“12C”) metabolites are displayed for DGM-D-13C15N-incubated living bacteria and the controls. Note the absence of fully 13C-labeled isotopologs in extracts from inactivated bacteria and the appearance of labeled intermediates and the concomitant reduction in the amount of the corresponding unlabeled metabolite in samples of DGM-D-1315N-incubated living bacteria compared to DGM-D-incubated bacteria. Exceptions were the detection of labeled glucose and phenylalanine in extracts of inactivated bacteria, presumably due to substrate adsorption to the surface of the bacterial cells.
Taken together, the ICR/FT-MS and UPLC-MS analyses were fully consistent with the results obtained by IRMS measurements; they provide first detailed information on the central carbon metabolism in host-free P. amoebophila EBs and show the occurrence of both catabolic as well as anabolic reactions.
Influence of Nutrient Availability on Maintenance of P. amoebophila Infectivity
To further explore the biological relevance of the host-free metabolic activity in EBs, which represent the infectious non-replicative developmental stage of chlamydiae [24], we analyzed the effect of nutrient availability on P. amoebophila infectivity. For this purpose host-free incubations were conducted in different media, including DGM-D, the modified medium in which D-glucose was replaced by L-glucose (DGM-L), a medium containing both D- and L-glucose (DGM-DL), as well as a nutrient-free buffer (phosphate-buffered saline (PBS)) or salt solution (0.6% NaCl solution) of similar pH and osmolarity. The capability of incubated bacteria to infect amoebae was then assessed at selected time points during a period of one week.
Overall, numbers of infectious particles appeared to decline over time in all tested media (Fig. 7A). In fact, under the applied incubation and infection conditions virtually no infection capability was left after a host-free period of 7 days. Initial infectivity, assessed after 2 h incubation, was similar in DGM-D and DGM-L. However, while it remained stable for the first two days of host-free incubation in DGM-D, a rapid reduction to 8.6% (±8.3) infectivity (relative to the initial value in DGM-D) was observed for bacteria incubated for this period of time in DGM-L (Fig. 7A–B) (p≤0.001; ANOVA). This finding cannot be explained by a potential toxicity of L-glucose, as incubation in DGM-DL, a medium containing both sugar stereoisomers, revealed a similar infectivity curve than observed for DGM-D (Fig. 7A). A rapid decline in the number of infectious particles was also observed in PBS and 0.6% NaCl solution. We also noted that in these nutrient-free media the initial infectivity after 2 h incubation was already significantly reduced compared to that of bacteria incubated in DGM-D (p≤0.001; ANOVA). This finding suggests that despite having a similar pH and osmolarity these media may also lack other essential components or differ in physicochemical properties required for chlamydial survival or stability. In order to exclude that D-glucose plays a role in infection beyond fueling metabolic reactions, we also assessed whether addition of D-glucose to bacteria that were incubated in DGM-L and thus starved could restore their infection capacity. However, this treatment did not affect the rapid decline of infectivity in DGM-L (Fig. S7), indicating that the supportive effect of D-glucose cannot be explained by a potential promotion of bacterial attachment or entry into host cells that might be mediated by sugar molecules adsorbed to the surface of EBs.
Figure 7. Effect of substrate availability on maintenance of infectivity.

P. amoebophila and C. trachomatis cells were harvested from infected amoeba and HeLa 229 cell cultures, respectively, and incubated for indicated periods of time in different host-free media. Subsequently, incubated bacteria were used to infect amoebae (P. amoebophila) or HeLa 229 cells (C. trachomatis), which were then fixed at 48 h or 24 h p.i., respectively. Bacteria were detected by FISH (P. amoebophila) or immunostaining (C. trachomatis). The observed infectivity, relative to that observed for 2 h incubation in DGM-D (P. amoebophila) or 30 min incubation in DGM-D6P (C. trachomatis) is depicted in (A) and (C), respectively. Data represent means and standard deviations from at least three replicate host-free incubations. For each sample a minimum of 600 amoebae (A) or 300 HeLa 229 cells (C) was counted. Statistically significant differences compared to the values obtained for DGM-D (A) or DGM-D6P (C) are indicated (ANOVA; ***, p≤0.001; **, p≤0.01; *, p≤0.05). In (B) representative fluorescence and DIC images of amoebae infected with P. amoebophila after 48 h host-free incubation in the indicated media are shown (FISH, red). The bar indicates 10 µm. In (D) representative confocal fluorescence images of HeLa 229 cells infected with C. trachomatis after 2 h host-free incubation in the indicated media are shown. Bacteria were detected by immunostaining (red), host cells and DNA were stained using HCS cytoplasmic stain (grey) and DAPI (blue), respectively. The bar indicates 25 µm.
Collectively, these findings demonstrate that the availability of D-glucose in the host-free environment is critical for P. amoebophila EBs as it significantly extends maintenance of their major biological role, which is the capacity to successfully infect new host cells and to initiate a new round of intracellular replication.
Influence of Nutrient Availability on Maintenance of C. trachomatis Infectivity
In order to explore whether a dependency of host-free EBs on nutrient availability can be observed for the pathogenic Chlamydiaceae, we compared maintenance of C. trachomatis (serovar L2) infectivity in different media. C. trachomatis, in contrast to P. amoebophila, lacks a gene encoding a glucokinase [12], [14]. This chlamydial species is thus unable to utilize D-glucose directly and is expected to rely on the phosphorylated derivative instead. The media used for host-free incubation of C. trachomatis consequently included nutrient-free Dulbecco's phosphate-buffered saline (DPBS), DGM-D, and DGM-L, as well as DGM containing D-glucose-6-phosphate instead of D-glucose (DGM-D6P) or containing both D-glucose and D-glucose-6-phosphate (DGM-DD6P). Assessment of infectivity for HeLa 229 cells conducted 30 minutes after suspension of purified bacteria in the respective incubation media indicated that already after this short exposure infectivity was significantly decreased in all media devoid of D-glucose-6-phosphate compared to DGM-D6P or DGM-DD6P (p≤0.01; ANOVA) (Fig. 7C). In addition, while infectivity remained relatively stable in DGM-D6P (90.8%±4.1) and DGM-DD6P (87.3%±7.5) during the first 2 h of host-free incubation, a larger reduction was observed in media lacking D-glucose-6-phosphate (DGM-D (59.1%±10.0), DGM-L (65.4%±3.5), and DPBS (53.0%±6.6)) (Fig. 7C–D). Surprisingly, infectivity was almost completely lost after 24 h host-free incubation in all tested media, which contrasts strongly to the prolonged extracellular survival of P. amoebophila.
These findings demonstrate that a dependency of infectivity maintenance on the availability of a metabolizable substrate is not restricted to the amoeba symbiont P. amoebophila, but can also be observed for the human pathogen C. trachomatis. This suggests that sustained metabolic activity in EBs may represent a more general and important feature of chlamydial biology.
Discussion
The chlamydial EB has long been regarded as a completely metabolically inert particle that can only be reactivated after entry into a suitable eukaryotic host cell. This notion has recently been challenged [43], [44] and the data presented in the present study confirm and greatly extend the concept of metabolic activity in the infective stage of chlamydiae. Our findings demonstrate that host-free EBs of P. amoebophila at least temporarily interact with their environment and maintain both catabolic as well as anabolic activities. Furthermore, these activities are of major biological relevance as they contribute to prolonged survival of infectious EBs.
The purification of chlamydial developmental forms and hence also a direct investigation of their biological properties, is a challenging task. A perfect enrichment and a complete removal of transition forms, some of which may be close to RBs or EBs but not yet fully differentiated, cannot be achieved [35], [43], [62], [63] nor can a contamination with host proteins be avoided completely [36]–[40]. Nevertheless, density gradient centrifugation and TEM, as used in the present study, currently represent the most powerful approach for the separation of and discrimination between chlamydial developmental stages and has enabled important insights into the biology of Chlamydiaceae RBs and EBs [22], [39], [44], [64]. By taking into account the purity of P. amoebophila EB and RB fractions defined by TEM (Fig. S1) [43] in combination with the application of single-cell based assays (Fig. 1, 2, and S2), our data clearly allow us to attribute metabolic activity to the EB stage for the reasons outlined below.
Several lines of evidence demonstrate that the observations reported in this study cannot be explained by residual host-derived activities: (i) respiratory activity, inferred from CTC reduction, was detectable in individual bacteria and could be clearly distinguished from the short-lived activity in lysates of uninfected host cells that was lost completely after pre-incubation (Fig. 1 and S2); (ii) import of 2-NBDG, as indicator for D-glucose uptake, could be detected at the single-cell level (Fig. 2); and (iii) D-glucose catabolism, as inferred from the release of 13CO2 from 13C-labeled D-glucose, could be observed in pre-incubated purified EBs, whereas no CO2 production was detected in equally treated highly concentrated host cell lysates (Fig. 3B).
Our data also clearly show that metabolic activity cannot be solely explained by co-purified RBs or transition stages, as CTC reduction and 2-NBDG uptake were detectable in about 50% of all bacterial cells (Fig. 1 and 2) in a highly enriched EB fraction that consists of about 76% mature EBs (defined as bacteria containing only electron-dense and electron-lucent material). The high proportion of inactive bacteria may be explained by the presence of dead bacteria. This would be consistent with previous observations that revealed that directly after harvesting of bacteria from infected amoeba cultures a significant proportion of the bacteria could be stained with the membrane-impermeable DNA dye propidium iodide, indicating that they had lost their membrane integrity [43]. Consistent with reports on Chlamydiaceae [22], [35], [44], in particular the RBs of P. amoebophila appeared to be very fragile, and hence clear differences in the host-free maintenance of respiratory activity were observed between developmental stages of P. amoebophila. Whereas EBs maintained their ability to reduce CTC during a 40 h incubation period, the proportion of active bacteria in the RB fraction dropped to a level similar to the expected proportion of co-purified EBs (Fig. 1). We therefore concluded that RB activity was essentially lost during this 40 h incubation. Based on this observation we exploited the instability of RBs and host-derived activity by including an initial 40 h host-free incubation step as pre-treatment of EB fractions prior to the detailed characterization of their central carbon metabolism. Alternative pre-treatment procedures, which have been applied by investigators in earlier studies on host-free activities of Chlamydiaceae – such as protease treatment to remove host cell-derived enzymes [65]–[67], sonication [28], or the addition of detergents to cause lysis of the more fragile RBs [68], [69] – were avoided in the present study due to potential detrimental effects on bacterial surface proteins or EB viability.
Altogether, the findings presented in this study clearly demonstrate metabolic activity in P. amoebophila EBs and thus strongly support recent appeals to revise the dogma of the metabolic inertness of the infective stage of chlamydiae [43], [44]. New methodological approaches, differences in media composition and purification and pre-treatment of EBs before assessment of activity might explain conflicting observations in previous studies [51], [68]–[70]. Indeed, the possibility of sustained activities in EBs, although not generally recognized by the scientific community, has already been indicated in a few earlier studies. For example, it has been shown that nucleoid decondensation during the redifferentiation of C. trachomatis EBs to RBs shortly after their uptake into host cells depends on bacterial de novo transcription and translation, implying that the capability of a certain level of activity must be maintained [71]. Consistently, Sarov and Becker could show earlier that purified EBs of C. trachomatis were able to synthesize RNA [72], and our previous findings suggested de novo protein synthesis in host-free C. trachomatis and P. amoebophila EBs [43]. Both findings could very recently be confirmed for C. trachomatis [44]. In the context of carbon metabolism, early investigations of host-free Chlamydiaceae also indicated that activities detected in mixed suspensions of RBs and EBs, but so far mainly attributed to the replicative stage, remained stable for at least two days [66], [73]. This finding appears to be inconsistent with the known fragility of RBs and thus may provide further evidence for metabolic activity in the infective stage. A biological role for metabolic activities in the EB stage was furthermore indicated by a direct comparison of the protein complements of C. trachomatis EBs and RBs, which demonstrated that proteins required for the central metabolism and glucose catabolism were, in fact, even predominant in the infective stage [39].
In addition to these conceptual considerations, the present study represents a hitherto unmatched detailed metabolomic analysis of a member of the Chlamydiae. It provides invaluable insights into the central carbon metabolism of P. amoebophila (Fig. 8) and indicates both similarities as well as major differences to observations reported for the Chlamydiaceae. While it was initially proposed that the latter can metabolize D-glucose under host-free conditions, as inferred from the production of 14CO2 from 14C-labeled D-glucose [74], [75], it was subsequently shown that the starting point for sugar catabolism in these bacteria is D-glucose-6-phosphate [65]. Moreover, experiments with substrates labeled at various carbon atoms revealed a combined action of glycolysis and PPP, yet complete TCA cycle activity could not be demonstrated [66], [74], [75]. In addition, anabolic reactions such as lipid and folate synthesis were detected in host-free Chlamydiaceae [76]–[79]. In contrast, while our findings from IRMS and the mass spectrometry-based metabolite analysis also indicate an involvement of the PPP in sugar metabolism and suggest occurrence of host-free anabolic reactions in P. amoebophila EBs, they additionally demonstrate that these bacteria are able to use non-phosphorylated D-glucose and that this sugar is at least to some extent completely catabolized via the TCA cycle (Fig. 3B, 5, and 6, Table 1).
Figure 8. Schematic representation of host-free activity of P. amoebophila EBs.

A metabolic model based on current knowledge is shown. The representation integrates observations from our previous investigations [43] and new findings obtained in the current study. Metabolic pathways and enzymes are illustrated in red, detected and postulated metabolites in blue. The techniques that provided experimental support for the indicated activities are shown in green (“ICR & UPLC” denotes activities confirmed by both, ICR/FT-MS and UPLC-MS). Dotted lines indicate metabolic reactions, whose occurrence in EBs was suggested, but not demonstrated. The electron transport chain, amino acid transporters, as well as a putative D-glucose importer, are depicted in the bacterial membrane as gray boxes.
Some of the host-free metabolic activities detected in P. amoebophila EBs are indeed not expected to occur in exactly the same manner in EBs of other chlamydial species due to known differences in their genomic repertoire. P. amoebophila, in contrast to Chlamydiaceae, encodes a glucokinase (glk, pc0935, UniProtKB Q6MCP0), which is required to activate D-glucose for metabolic reactions, and a complete enzyme set required for host-independent operation of the TCA cycle [14], [21]. Glucokinase, as well as most other enzymes involved in glycolysis/gluconeogenesis, PPP, TCA cycle, and in the electron transport chain, were recently also detected in the P. amoebophila EB proteome [40]. The mechanism by which D-glucose is imported in P. amoebophila remains to be elucidated, as the genome encodes a putative glucose-6-phosphate transporter (uhpC, pc0387, UniProtKB Q6ME88), the C. pneumoniae homolog of which has recently been functionally characterized [80], but does not provide evidence for a known importer for the non-phosphorylated sugar [14]. Early studies on host-free activities of Chlamydiaceae indicated that phosphorylation of D-glucose in suspensions of bacteria may also occur through the activity of a co-purified host-derived hexokinase [65]. However, this activity was shown to be strictly dependent on the availability of extensive amounts of ATP in the incubation medium [73]. Due to the pre-incubation step and the absence of externally added ATP we thus exclude significant contributions of host-derived kinase activity in the experiments presented in the present study.
Several lines of evidence suggest that host-free P. amoebophila EBs co-utilize medium-derived D-glucose with other internal or external carbon compounds that may even partially substitute for the sugar in its absence. Accordingly, during conditions of D-glucose deprivation, i.e. in DGM-L, CTC reducing activity was still detectable in a small proportion of the bacteria (Fig. 1 and S2F), suggesting that EBs may contain storage compounds, such as glycogen that may compensate D-glucose shortage for a period of time. The abundance patterns of differently labeled metabolic intermediates and the co-occurrence of unlabeled metabolites detected during the mass spectrometry-based analysis indicate an additional contribution of alternative substrates even when D-glucose is present in the extracellular medium. Thus, the fact that partially labeled citrate that contained predominately either three or four 13C atoms could be detected after incubation with fully labeled D-glucose (Fig. 6, Table 1) can only be explained by a mixed entry of labeled and unlabeled molecules into the TCA cycle. However, the high relative abundance of labeled metabolites in the PPP (59–94%, Fig. 6), as well as the fact that the absolute abundance of unlabeled molecules increased with proximity to the TCA cycle, contradicts extensive utilization of D-glucose from storage compounds during incubation in the nutrient-rich medium, but rather suggests a predominant co-utilization of substrates that can enter the central carbon metabolism at a level further downstream. These may include products from protein or lipid degradation or, even more likely considering their availability in the medium, imported amino acids. In fact, a potential utilization of amino acids is supported by a recent IRMS-based analysis conducted in our lab, which indicated that besides L-phenylalanine also L-glutamate, L-aspartate, and L-threonine could be imported by host-free P. amoebophila (data not shown). In addition, L-glutamate has also been proposed to represent a major carbon source for C. trachomatis based on their predicted metabolic repertoire [12]. However, the fact that CO2 production could not be detected for P. amoebophila incubated in DGM-L (Fig. 3B) and the rapid loss of its metabolic activity in this medium (Fig. 1 and S2), demonstrate that these additional carbon compounds are less effective than D-glucose, which thus appears to be an essential nutrient for maintenance of metabolic activity in host-free P. amoebophila EBs under the applied conditions. A similar substrate dependence may occur in C. trachomatis EBs, for which it was very recently shown that host-free metabolic activity can be greatly enhanced by the presence of D-glucose-6-phosphate [44].
The exclusive detection of only partially labeled six-carbon compounds in the glycolytic/gluconeogenic pathway, most likely derived from joining of 12C and 13C precursors, together with the observation that for all detected intermediates in the PPP a high proportion of the metabolite pool appeared to be fully labeled (Fig. 6), suggests that the latter represents the preferred route of D-glucose catabolism in host-free P. amoebophila. In addition to being an alternative pathway for the breakdown of sugars into products that can be further metabolized for ATP generation, the PPP represents the main route for regeneration of NADPH, a reducing agent that is not only required for lipid synthesis, but is also indispensable for maintaining the intracellular redox homeostasis, which in turn sustains protein function and counteracts oxidative stress [81]. An additional physiological function of D-glucose metabolism in EBs might be indicated by the detected synthesis of a disaccharide (Table 1) that could play a role in osmoprotection, though other functions, such as carbon storage, may be equally plausible.
The biological relevance of host-free activity of chlamydiae and its implications for their lifestyle have, to our knowledge, not been assessed before. A recent study that focused on C. trachomatis and several environmental chlamydiae reported differences in infectivity maintenance in nutrient-rich growth medium compared to sterile tap water [82]. The effects of the fundamentally different physicochemical properties of these incubation media, however, prohibited a correlation of the observed differences with nutrient availability. This is well illustrated by our observation of that P. amoebophila infectivity is markedly decreased after only a 2 h incubation in PBS or NaCl solution (Fig. 7A). In the present study, however, we demonstrate that the absence of D-glucose alone during host-free incubation of P. amoebophila, achieved by an exchange with its non-metabolizable stereoisomer, which does not affect the medium osmolarity, pH, or overall composition, is sufficient to cause a rapid decrease in the number of infectious particles (Fig. 7A–B). Likewise, exchange of D-glucose-6-phosphate with D-glucose resulted in a more rapid decline of C. trachomatis infectivity, consistent with the inability of this chlamydial species to utilize the non-phosphorylated compound (Fig. 7C–D). Addition of D-glucose to starved P. amoebophila failed to restore infectivity (Fig. S7), which indicates that a continuous supply of metabolizable substrates is required for the host-free survival of infectious EBs and thus demonstrates that metabolic activity in EBs is linked to their biological role as a dispersal stage. The more rapid decline of infectivity observed for C. trachomatis compared to P. amoebophila during host-free incubation may reflect differences in their metabolic potential, their requirement for host-free survival, or their adaptation to a host-free environment.
In conclusion, we provide evidence for D-glucose utilization and metabolic activity in host-free P. amoebophila EBs, which disagrees with the current perception of the infectious stage of chlamydiae as being metabolically inert and further establishes the chlamydial EB as being a developmental stage with a defined metabolic activity. The observed link between the availability of a metabolizable substrate and survival of infectious particles observed for P. amoebophila and C. trachomatis implies that the detection of metabolic activity in EBs is relevant for the main biological function of this infective stage, which thus appears to be more sensitive to its environment than has been thus far appreciated.
Materials and Methods
Cell Culture
Acanthamoeba sp. UWC1 containing P. amoebophila UWE25 [7] and symbiont-free isogenic amoebae were maintained at 20°C in TSY medium (30 g/l trypticase soy broth, 10 g/l yeast extract). HeLa 229 cells (ATCC, CCL-2.1) were cultivated at 37°C, 5% CO2 in Dulbecco's Modified Eagle's Medium (DMEM, Invitrogen) supplemented with 10% fetal bovine serum (PAA). C. trachomatis L2 was propagated in HeLa 229 cells by transfer of supernatant from infected to uninfected cultures every 2–3 days. Cultures were regularly screened for contamination by fluorescence microscopy using the DNA dye DAPI and fluorescence in situ hybridization (FISH). Mammalian cells were additionally shown to be free of contamination with Mycoplasma spp. by using the Venor GeM PCR kit (Minerva Biolab).The identity of the chlamydiae was verified by 16S rRNA gene sequence analysis, as described recently [83].
Media for Extracellular Incubation
Extracellular incubations of P. amoebophila and C. trachomatis were conducted in media that were based on the chemically defined Acanthamoeba medium DGM-21A [42], but that, as a modification, contained L-phenylalanine (5.4 mM) instead of the racemic mixture DL-phenylalanine and were additionally supplemented with 0.25 g/l NaHCO3. Specific media used in this study included DGM-D, which like the original DGM-21A contained 83.2 mM D-glucose, DGM-D/2 with a reduced D-glucose concentration of 41.6 mM, DGM-L containing 83.2 mM L-glucose instead of D-glucose, DGM-DL containing both 83.2 mM D-glucose and 83.2 mM L-glucose, DGM-D6P containing 83.2 mM D-glucose-6-phosphate instead of D-glucose, and DGM-DD6P containing both 83.2 mM D-glucose and 83.2 mM D-glucose-6-phosphate. In addition, DGM-D-based media in which certain endogenous substrates were completely replaced by stable isotope-labeled variants were also used. These media included DGM-D-13C (containing fully 13C-labeled D-glucose (D-[U-13C6]-glucose, 99%)), DGM-D-1-13C (containing D-glucose labeled at carbon 1 (D-[1-13C]-glucose, 98–99%)), DGM-D-6-13C (containing D-glucose labeled at carbon 6 (D-[6-13C]-glucose, 99%)), and DGM-D-13C15N (containing D-[U-13C6]-glucose and fully 13C15N-labeled L-phenylalanine (L-[U-13C9,15N]-phenylalanine, 97–99%)). The composition of all incubation media is summarized in Table S2. Stable isotope-labeled substrates were purchased from Euriso-top.
Purification of P. amoebophila EBs and RBs
Recently, we developed a protocol for an efficient purification of P. amoebophila EBs and RBs and investigated the purity of obtained fractions by an ultrastructural analysis (Fig. S1) [43]. In the current study a slightly modified protocol, including thicker layers in the density gradients for improved phase separation, was applied. Briefly, after host cell disruption and filtration, released bacteria were directly subjected to density gradient centrifugation using a gradient consisting of 3.5 ml 30% (v/v) gastrografin (Bayer Schering Pharma) in Page's amoebic saline (PAS; 0.12 g/l NaCl, 0.004 g/l MgSO4×7H2O, 0.004 g/l CaCl2×2H2O, 0.142 g/l Na2HPO4, 0.136 g/l KH2PO4) and 3.5 ml 50% (w/v) sucrose. The gradient applied during the second centrifugation consisted either of 3.5 ml 34% (v/v) and 3.5 ml 40% (v/v) gastrografin or of 3.5 ml 40% (v/v) and 3.5 ml 46% (v/v) gastrografin. RB-enriched and intermediate fractions were collected at the 34/40% or 40/46% interface, respectively. A highly enriched EB fraction was collected at the bottom of the 40/46% gradient. For applications requiring large amounts of biomass, such as the analysis of biomass by IRMS or the preparation of metabolite extracts for ICR/FT-MS and UPLC-MS analysis, the EB-enriched pellet of the 34/40% gastrografin gradient (in this study explicitly referred to as “EB-enriched fraction”) was used instead. Purified bacteria were washed once in 10 ml PAS (12 860× g, 10 min), resuspended in DGM-D, and analyzed immediately or after a 40 h pre-incubation (27°C, 200 rpm). Bacteria that were heat-inactivated (30 min, 80°C, 700 rpm) directly before assessment of activity were included as control when indicated.
Preparation of Host Cell Lysates
Host cell lysates, that were included as negative control when indicated, were prepared analogously to the first steps applied during the purification of bacteria [43]. Briefly, uninfected Acanthamoeba sp. UWC1 were harvested at 3200× g, washed with PAS, and resuspended in 6.5 ml sucrose-phosphate-glutamate buffer (75 g/l sucrose, 0.52 g/l KH2PO4, 1.53 g/l Na2HPO4×2H2O, 0.75 g/l glutamic acid) per 1 g wet weight. After cell disruption on ice by using a dounce homogenizer (Wheaton), the suspension was filtrated (1.2 µm). Cell debris was collected at 12 860× g (10 min, 4°C), resuspended in DGM-D, and analyzed immediately or after a 40 h pre-incubation (27°C, 200 rpm).
Fluorescence Microscopic Detection of Respiratory Activity
Respiratory activity in fractions of living or heat-inactivated bacteria and in host lysates was analyzed immediately or after pre-incubation. For that purpose, bacteria or cell debris were collected by centrifugation (10 620× g, 10 min, 4°C), resuspended in 220 µl DGM-D containing 5 mM CTC (Sigma-Aldrich), and incubated for 2 h (27°C, 200 rpm). For the assessment of the effect of D-glucose deprivation, purified bacteria were washed twice in 1 ml DGM-L directly after the purification and both the pre-incubation and the incubation with CTC were subsequently conducted in DGM-L. After the incubation with CTC, bacteria and amoebal cell debris were collected at 10 620× g (10 min), fixed in 400 µl 4% formaldehyde (15 min, room temperature), and washed once with 1 ml PBS (10 mM NaxPO4, 0.76% NaCl (if not stated otherwise), pH 7.3). Pellets were then resuspended in a small volume PBS and transferred to microscope slides. Bacteria and cell debris were dried (46°C), stained with DAPI (0.5 µg/ml in PBS, 10 min), washed once with PBS, and embedded in mowiol [84]. Images were taken with a CCD camera (AxioCam HRc; Carl Zeiss) connected to an epifluorescence microscope (Axioplan 2 imaging; Carl Zeiss). The percentage of DAPI-stained bacteria containing red fluorescent CTC crystals was determined. At least 1500 bacteria per sample, 500 for each of three replicate wells on the microscope slide, were counted. In addition, the efficiency of DAPI staining, i.e. the percentage of bacteria observable in DIC that could be detected by DAPI staining, was also assessed. For that purpose, at least 450 bacteria per sample, including 150 per replicate well, were considered. Data were collected for three independent experiments (throughout this study, the term “independent experiments” refers to experiments conducted with separate purifications of bacteria).
Fluorescence Microscopic Detection of D-Glucose Uptake
Purified living and heat-inactivated EBs were analyzed for D-glucose uptake either immediately or after pre-incubation. For that purpose, bacteria were collected by centrifugation (10 620× g, 10 min, 4°C), resuspended in 220 µl DGM-D/2 containing 100 µM 2-NBDG (Invitrogen), and incubated for 10 h (27°C, 200 rpm). After the incubation, bacteria were washed once with 1 ml PBS and transferred to microscope slides. Images were obtained as described above. The percentage of stained cells was determined for three separate incubations (representing 2 independent experiments), for each of which at least 500 bacterial cells were evaluated.
Sample Preparation for IRMS Analysis
For the detection of 13C-D-glucose uptake and catabolism by IRMS, a pre-incubated EB-enriched fraction or a highly pure EB fraction were applied for the first and second experimental approach, respectively. After pre-incubation, the suspension of bacteria was mixed by vortexing and transferred to 1.5 ml tubes, so that each tube contained the same number of cells. Bacteria were then collected by centrifugation (10 620× g, 10 min), resuspended in 1 ml of the respective incubation medium (DGM-D, DGM-L, DGM-D-13C, DGM-D-1-13C, or DGM-D-6-13C), and transferred to 15 ml glass vials that were subsequently closed with gas impermeable butyl rubber stoppers (GMT) and incubated for 48 h (27°C, 200 rpm). Prior to the incubation in DGM-L, bacteria were washed twice in 1 ml of this medium. When indicated, incubations of heat-inactivated bacteria or host cell lysates in DGM-D-13C were included as control. After the 48 h period, gas and biomass samples were collected and pre-processed for IRMS analysis. For the CO2 measurements, defined volumes (between 6.5 and 7.5 ml per sample) of the head-space of the incubations, as well as of parallel incubations of bacteria-free media (that served as blanks for the gas measurements), were collected with a syringe, transferred to evacuated glass tubes (exetainers, 12 ml, Labco), and brought to a volume of 15 ml with N2 gas prior to IRMS analysis. For the biomass measurements, incubated bacteria were collected by centrifugation (20 820× g, 5 min, 4°C) and washed twice with 1 ml PBS. Prior to the wash steps, bacteria incubated in DGM-D, which served as blank for biomass measurements, were shortly washed in DGM-D-13C to allow substrate adsorption to the surface of the bacteria. Bacterial pellets were finally heat-inactivated (80°C, 10 min), dried for 6 h in a speedvac (Concentrator 5301, Eppendorf) and subsequently overnight at 60°C. Defined amounts of biomass (between 0.3 and 0.5 mg per sample) were transferred to tin capsules and subjected to IRMS analysis. Prior to the processing of biomass for IRMS, aliquots were withdrawn from bacterial suspensions for the quantification of bacterial particles using a previously described procedure [83]. Applied bacterial numbers were similar between replicate experiments (between 3.9×10⁸ and 5.9×10⁹ or between 6.3×10⁸ and 1.0×10⁹ bacteria per incubation, for the first and second experimental approach, respectively). The applied amount of host cell lysate exceeded that of the bacterial biomass, based on the size of the pellets. Samples for IRMS measurements were obtained from three independent experiments each consisting of two replicate incubations per condition. An exception was the incubation in DGM-L, for which only two independent experiments were conducted.
IRMS Measurements and Data Analysis
Analysis of bacterial biomass for total carbon and C isotopes (13C, 12C) was conducted using an elemental analyzer (EA 1110, CE Instruments) interfaced via a ConFlo III device (Thermo Finnigan) to a continuous flow stable isotope ratio mass spectrometer (DeltaPLUS, Thermo Finnigan). A mixture of proline and sucrose was used as standard, which was regularly calibrated against international standards (IAEA) for 13C and against atropine for total C content. Stable isotopes (13C, 12C) in CO2 of gas samples were analyzed against CO2 reference gas by an isotope ratio mass spectrometer (Delta Advantage V, Thermo Fisher Scientific) coupled to a headspace gas sampler (GasBench II, Thermo Fisher Scientific) with a GC-PAL autosampler (CTC Analytics). CO2 reference gas was calibrated using ISO-TOP gas standards with certified 13C concentrations (Air Liquide) and counterchecked by elemental analysis coupled with IRMS of international standards (IAEA). The averages of peak area and At%13C of three consecutive injections of each sample were used to calculate concentrations of CO2 and 13C, respectively. For calibration of CO2 concentration, gas standards containing 495 and 1020 ppm were analyzed together with the samples. For gas samples, measures for bacterial CO2 production and 13C enrichment in CO2 were calculated based on equations (1) and (2), respectively.
 |
(1) |
 |
(2) |
In these equations, [CO2] and At%13C represent the measured values for CO2 (in ppm/ml) and At%13C for the sample and for the two corresponding blank incubations (i.e. incubations of bacteria-free media) of the respective experiment. Based on the APE13C observed for incubations in media with differently labeled D-glucose isotopologs the contributions of different metabolic pathways to 13CO2 release were estimated using a script written in Python 2.7.2. The working procedure of the calculation is depicted in Fig. S4. Bacterial 13C incorporation (per mg DW) was calculated for each sample by applying equation (3).
 |
(3) |
In this equation, Amt%C indicates the measured proportional amount of carbon in the sample and M13C the atomic mass of 13C (13.00335). The APE13C is calculated from the measured At%13C of the sample by subtracting the mean of the At%13C of the two blank incubations of the respective experiment (i.e. bacteria incubated in DGM-D) (as described in equation (2)).
Sample Preparation for Metabolite Analysis
For the analysis of metabolite extracts, a pre-incubated EB-enriched fraction was mixed by vortexing and transferred to 1.5 ml tubes, so that each tube contained the same number of cells. After centrifugation (10 620× g, 10 min), bacteria were resuspended in 1 ml of the respective incubation medium (DGM-D or DGM-D-13C15N) and incubated for 48 h (27°C, 200 rpm). Bacteria that were heat-inactivated prior to incubation in DGM-D-13C15N were included as control. For preparation of metabolite extracts, bacteria were centrifuged (20 820× g, 5 min, 4°C) and washed once with 1.5 ml cold PBS. Bacterial pellets were then resuspended in 400 µl cold (−20°C) methanol (≥99.9%, CHROMASOLV, Fluka), frozen in liquid nitrogen (1 min), and thawed on ice, followed by two cycles consisting of vortexing (30 sec) and 5 min incubation on ice. After centrifugation (20 820× g, 5 min, 4°C) extracts were transferred to pre-cooled 1.5 ml tubes and pellets were extracted a second time with 400 µl of a cold (−20°C) 1∶1 mixture of methanol (≥99.9%, CHROMASOLV) and water (LC-MS Ultra CHROMASOLV, Fluka) by the same procedure as described above. Both extracts were pooled and stored at −80°C until analysis. As extraction blank, empty 1.5 ml tubes were subjected to the same extraction procedure. Metabolite extracts were obtained for three independent experiments each consisting of two replicate incubations per incubation condition. Bacterial numbers, which were assessed by quantification of bacterial particles in an aliquot that was withdrawn from the bacterial suspension during the pre-incubation, were highly similar between replicate experiments, ranging from 2.6×10⁹ to 2.8×10⁹ bacteria per incubation.
ICR/FT-MS Measurements and Data Analysis
Ultrahigh resolution mass spectra were acquired on a solariX ICR/FT mass spectrometer (Bruker Daltonics) equipped with an Apollo II electrospray source (Bruker Daltonics) and a 12 Tesla super conducting magnet (Magnex Scientific). The mass spectrometer was tuned in order to obtain highest sensitivity for metabolites in the m/z range of about 150 to 500 Da in broad band detection mode with a time domain transient of 2 Megaword. The instrument was calibrated with a 1 ppm arginine solution. A mass error below 100 ppb and a resolving power of ∼300 000 at m/z 300 was achieved. Negative electrospray ionization (ESI) mode was chosen due to favored ionization of carbohydrates and their metabolic derivatives by proton loss or chloride attachment [85]. Diluted extracts (1∶100 in methanol (≥99.9%, CHROMASOLV) were cooled (8°C) and injected (2 µl/min flow rate) through a Gilson autosampler (sample changer 223, Gilson). In total 600 scans were acquired for one spectrum of each sample. The obtained spectra were internally calibrated against naturally abundant fatty acids and analyzed in DataAnalysis 4.0 SP2 (Bruker Daltonics). Mass lists were generated with a signal-to-noise ratio (S/N) of four, exported, and combined to one data matrix by applying a 1 ppm window [86]. Subsequently, mass lists were filtered very conservatively. Masses that were also detected in the extraction blanks were excluded if their detected intensity in the samples did not exceed ten times the detected intensity in the blank. Furthermore, for each incubation condition, masses found in less than two out of the three independent biological experiments were also excluded. Detected metabolites in extracts from DGM-D-incubated EBs were annotated with MassTRIX (<1 ppm) [61]. For the detection of 13C-labeled metabolites an application of mass difference-based networks [87] was developed and applied. Hereby, mass differences of peaks detected in samples from DGM-D- and DGM-D-13C15N-incubated bacteria were compared by a polynomial-time algorithm. Labeled metabolites were considered to be present in extracts of DGM-D-13C15N-incubated EBs when peaks corresponding to the exact mass of the unlabeled metabolites were detected in the DGM-D-incubated controls and observed mass shifts were consistent with the exchange of 12C by 13C atoms.
UPLC-MS Measurements and Data Analysis
UPLC-MS analysis of metabolite extracts was conducted on an UHR QqToF instrument (maXis, Bruker Daltonics) hyphenated to an ACQUITY UPLC (Waters). Prior to injection, extracts were dried (SpeedVac Concentrator, Savant SPD 121P, Thermo Fisher Scientific) and re-solved in solvent A (see below), using half of the original sample volume. Separation was performed on a ACQUITY UPLC BEH Amide column (150×2.1 mm, 1.5 µm, Waters) using a 3 min gradient from 10% to 90% solvent B, followed by 2 min plateau on 90% B (solvent A: 80% acetonitrile, 20% water, 0.1% (v/v) ammonium hydroxide; solvent B: 70% water, 30% acetonitrile, 0.1% (v/v) ammonium hydroxide). A column equilibration time of 5 min was applied after each analysis. The flow rate was optimized to 0.1 ml/min with a column temperature of 45°C. ToF mass spectra were acquired in negative ESI mode. Parameters were tuned for best resolution and sensitivity in the mass range of about 100 to 400 Da. A quality control consisting of an aliquot of all samples and a mixture of different standard compounds (including raffinose, ribose, arabinose, galactose, fructose, fucose, gentiobiose, erythrol, glucose, pyruvate, and citrate) was used to monitor drifts in retention time and mass accuracy. The acquired spectra were calibrated internally against naturally abundant fatty acids (DataAnalysis 4.0 SP2, Bruker Daltonics) and exported to MZmine 2.7 [88] for data evaluation. Annotation of the m/z features in spectra from DGM-D-incubated bacteria was carried out with MassTRIX applying a maximal mass error of 0.005 Da [61]. Corresponding masses of fully or partially labeled metabolites were calculated and their presence in spectra of DGM-D-13C15N-incubated samples was checked manually. Masses of putatively labeled metabolites were taken in consideration if the retention time and peak shape matched with the corresponding parameters of unlabeled metabolites detected in DGM-D-incubated EBs and the mass difference between putatively labeled and unlabeled metabolites was consistent with a shift corresponding to the exchange of 12C by 13C atoms.
Infectivity Assay (P. amoebophila)
For the analysis of the effect of nutrient availability on infectivity, P. amoebophila were purified from host cells using a protocol without density gradient centrifugation in order to mimic more closely the natural situation of bacterial dispersal in the environment. Briefly, Acanthamoeba sp. UWC1 infected with P. amoebophila, as well as released bacteria in supernatants of respective cultures, were harvested and washed, followed by disruption of host cells, as described for the purification of EBs by density gradient centrifugation [43]. After filtration (1.2 µm), bacteria were collected by centrifugation (12 800× g, 10 min), washed once with 20 ml PBS, and then resuspended in a small volume of PBS. A small aliquot was withdrawn for the quantification of bacterial particles (see above). The bacterial suspension was then transferred into 1.5 ml tubes for parallel host-free incubations in different media, including a 0.6% NaCl solution, PBS (containing 0.6% NaCl), DGM-D, DGM-L, and DGM-DL. After centrifugation, bacteria were resuspended in the respective media and incubated at 27°C (200 rpm) for 2, 48, 94, or 168 h before being added to amoebae that had been seeded into a 24-well plate (Nunc; 1×10⁵ cells per well) at a multiplicity of infection (MOI) of 5. Amoebae and bacteria in each well were mixed by pipetting, followed by 15 min incubation at 27°C, centrifugation (130× g, 15 min, 23°C), and incubation at 27°C for 48 h. Amoebae were then transferred to microscope slides, fixed with 4% formaldehyde (10 min, room temperature), and washed with PAS. For the detection of bacteria by FISH, cells were dehydrated by incubation in increasing concentrations of ethanol (50%, 80% and 96%, 3 min incubation with each) and hybridized with a combination of two Cy3-labeled probes, targeting different positions at the 16S rRNA, to increase signal strength. Applied probes (purchased from Thermo Fisher Scientific) included the Chlamydiae-specific probe Chls-0523 [89] and the probe E25-454 (5′-GGA TGT TAG CCA GCT CAT-3′) that had been designed to target P. amoebophila. Hybridization occurred at 46°C for 1.5 h at a formamide concentration of 20%, using hybridization and wash buffers described elsewhere [90]. Cells were embedded in mowiol and images were taken as described above. The percentage of infected cells (containing at least six intracellular bacteria) was determined taking into account a minimum of 600 cells per sample. Infectivity was expressed relative to the infectivity observed for bacteria incubated for 2 h in DGM-D. Data were collected for at least three independent experiments, each consisting of three parallel host-free incubations per incubation medium and duration.
Infectivity Assay (C. trachomatis)
HeLa 229 cells infected with C. trachomatis were harvested at 40 h p.i (when significant host cell lysis was first observed), washed with DPBS (Invitrogen), resuspended in SPG buffer [83], and disrupted by two rounds of freezing (dry ice/ethanol bath) and thawing (37°C). After removal of host cell debris by centrifugation (250× g, 5 min, 4°C), the supernatant was filtered (1.2 µm). Bacteria were collected by centrifugation (15 557× g, 10 min, 4°C) and resuspended in SPG buffer. The bacterial suspension was then transferred into 1.5 ml tubes for parallel host-free incubations in different media, including DPBS, DGM-D, DGM-L, DGM-D6P, and DGM-DD6P. After centrifugation (12 851× g, 10 min, 4°C), bacteria were resuspended in the respective media and incubated at 37°C (200 rpm) for 30 min, 2 h, 6 h, or 24 h before being added to HeLa 229 cells that had been seeded into a 24-well plate (Nunc; 7×10⁴ cells per well). Multi-well plates were incubated at 37°C, 5% CO2 for 24 h. Cells were fixed with 4% formaldehyde (1 h, room temperature) and washed with DPBS. For the detection of bacteria by immunostaining, cells were first permeabilized in 0.2% Triton-X-100 in PBS for 15 min, followed by incubation in blocking solution (2% BSA in PBS, 20 min), and subsequent incubations with primary antibodies (raised against recombinant P. amoebophila heat shock protein DnaK [91]) and secondary antibodies (Cy3-labled, Dianova) diluted in blocking solution (for 1 h each). HeLa 229 cells were counter-stained with HCS CellMask Deep Red cytoplasmic stain (Life technologies; 10 µg/ml, 20 min) and DNA was stained with DAPI (0.5 µg/ml in PBS, 10 min). Cells were embedded in Mowiol and images were taken at a confocal laser scanning microscope (TCS SP8 X, Leica). The percentage of infected cells was determined taking into account at least 300 cells per sample. Infectivity was expressed relative to the infectivity observed for bacteria incubated for 30 min in DGM-D6P. Data were collected for three parallel host-free incubations per incubation medium and duration.
Statistical Analysis
Throughout the study values are given as means with standard deviations. Unpaired two-sided student's t-test and one-way ANOVA were carried out using the software PASW statistics 17.0 (SPSS Inc.). Dunnett's T3 test was chosen as post-hoc test for ANOVA due to the fact that experimental data did frequently not comply with the criteria of variance homogeneity. The following notation of significance levels was used throughout the study: ***, p≤0.001; **, p≤0.01; *, p≤0.05. The multivariate modeling was done in SIMCA-P 9 (Umetrics). PCA models were used for data visualization and discovery of naturally occurring differences in the metabolite pattern of living and heat-inactivated EBs and of EBs incubated in different media. Mean centering in combination with unit variance scaling was applied. Data were further analyzed with PLS-DA to extract the most discriminative compounds characterizing living EBs compared to heat-inactivated bacteria. A seven-fold cross-validation, as well as a permutation test using 200 iterations, was conducted for model validation.
Supporting Information
Transmission electron micrographs of purified P. amoebophila developmental stages. P. amoebophila developmental forms were purified from amoebal host cells and separated from each other by density gradient centrifugation, using a previously established protocol [43]. TEM was carried out as described in the respective study [43]. Micrographs of a highly pure EB fraction (collected below 46% gastrografin), as well as of an RB-enriched and an intermediate fraction (collected above 40% gastrografin or at the 40/46% interface, respectively), are shown. A quantitative evaluation indicated a high enrichment of the replicative stage in RB fractions (5% EB, 34% IB, 61% RB), whereas EB fractions were highly enriched in EBs (76% EB, 16% IB, 8% RB) and intermediate fractions represented a more uniform mixture of all stages (38% EB, 35% IB, 27% RB). Bacteria were classified as RBs, EBs, and IBs based on their characteristic morphological features. Thus, bacteria containing reticulated material and a relaxed nucleoid were considered as mature RBs (white arrows), bacteria containing only electron-dense and electron-lucent material were considered as mature EBs (black arrows), and intermediate morphologies were considered as IBs (gray arrowheads). The bar indicates 1 µm.
(TIF)
Visualization of respiratory activity in P. amoebophila developmental stages and the effect of D-glucose deprivation. Activity of P. amoebophila developmental forms was assessed by application of CTC as indicator for respiration. RB (A), intermediate (B), and EB (C) fractions of P. amoebophila were subjected to host-free incubation in DGM-D containing 5 mM CTC either immediately after purification or after a 40 h pre-incubation in DGM-D. A heat-inactivated EB fraction (D) and a lysate of uninfected amoebae (E) were included as controls. The effect of D-glucose deprivation on EB activity was tested by replacement of DGM-D with DGM-L during pre-incubation and incubation with CTC (F). Incubation with CTC was followed by formaldehyde fixation and DNA staining with DAPI. Fluorescence and corresponding DIC images are shown (reduced CTC, red; DAPI, blue). The bar indicates 10 µm.
(TIF)
D-glucose uptake in host-free P. amoebophila EBs revealed by IRMS. An EB-enriched fraction of P. amoebophila was pre-incubated for 40 h in DGM-D, followed by 48 h incubation in DGM-D or DGM-D-13C and subsequent analysis of bacterial biomass by IRMS. Heat-inactivated bacteria incubated in DGM-D-13C were included as control. The amount of incorporated 13C (in nmol 13C/mg DW) in DGM-D-13C-incubated bacteria was calculated by considering the 13C content of DGM-D-incubated bacteria as blank. Diamonds indicate results from individual replicates, bars display mean values. Results from three independent experiments each consisting of two replicate incubations per condition are shown. Bacterial numbers applied per incubation were similar between replicate experiments (between 3.9×10⁹ and 5.9×10⁹ bacteria). The observed difference in 13C incorporation between living and heat-inactivated bacteria was statistically significant (t-test; ***, p≤0.001).
(TIF)
Working scheme for the estimation of the contributions of different metabolic pathways to 13CO2 release. In respect to the release of certain carbon atoms from D-glucose as CO2, three major metabolic scenarios (A–C) were distinguished, which are indicated in the gray box and will here be termed “pathways” for simplicity. The pathway ratio was calculated based on the APE13C in CO2 observed for incubations in media with different labeled D-glucose isotopologs (blue box). Initially, these experimental values were used to calculate an experimental APE13C ratio and the pathway ratio was set to 0∶0∶1 (A∶B∶C), assuming that all D-glucose is completely catabolized (red box). Based on this pathway ratio a corresponding expected ratio of APE13C for the differently labeled substrates was calculated, assuming that pathways A, B, and C lead to a release of 1.83, 1, and 6, respectively, carbons from D-[U-13C6]-glucose, 0, 1, and 1, respectively, carbons from D-[1-13C]-glucose, and 0, 0, and 1, respectively, carbons from D-[6-13C]-glucose. The assumed release of 1.83 carbon atoms per molecule D-[U-13C6]-glucose by pathway A was based on the assumption that pyruvate, as starting molecule for scenario A, is produced with equal probability from glycolysis and PPP activity, the latter of which already releases carbon 1 as CO2 and thus yields a lower amount of pyruvate per molecule glucose. The calculated expected APE13C ratio was then compared to the experimental APE13C ratio. This was followed by stepwise adjustments of B and A until the expected APE13C ratio coincided with the experimentally observed ratio (yellow box). The finally obtained pathway ratio represents an estimation of the contributions of the three considered metabolic scenarios to 13CO2 release by host-free P. amoebophila EBs (green box).
(TIF)
Comparison of ICR/FT-MS metabolite profiles from DGM-D- and DGM-D-13C15N-incubated living and heat-inactivated EBs. In (A) representative ESI(-)ICR/FT-MS spectra of DGM-D- and DGM-D-13C15N-incubated living bacteria, as well as of DGM-D-13C15N-incubated inactivated bacteria, are shown. Spectra illustrate the m/z range of 150–800. In addition, an enlarged view on the m/z range of 175–190 (indicated in gray in the overview spectra), is displayed. A comparison of spectra from living bacteria incubated in the two different media revealed a shift of the D-glucose peak from m/z ∼179 (12C-D-glucose) to m/z ∼185 (13C-D-glucose), while the remaining pattern was unaltered. The exchange of D-glucose and L-phenylalanine in the incubation medium against their stable isotope-labeled analogs thus did not profoundly change the metabolite profile of P. amoebophila EBs. This visual impression, as well as the effect of heat-inactivation, was further tested by pairwise PCA comparisons of spectra from DGM-D- and DGM-D-13C15N-incubated living bacteria (B), and of spectra from DGM-D-1315N-incubated inactivated bacteria with those from DGM-D-incubated living EBs (C) or DGM-D-13C15N-incubated living EBs (D). Note that this analysis revealed a separation of spectra from living and dead bacteria, whereas no separation could be observed for samples from living bacteria incubated in the two different media.
(TIF)
PLS-DA analysis for the extraction of metabolites discriminative for living compared to heat-inactivated EBs. ICR/FT-MS spectra were analyzed by PLS-DA to extract the most discriminative compounds characterizing living compared to inactivated EBs. The PLS-DA model included data from DGM-D-incubated living and DGM-D-13C15N-incubated inactivated EBs. The assignment of discriminative and non-discriminative metabolites to KEGG pathways is displayed in Fig. 4.
(TIF)
Lack of infectivity restoration by addition of D-glucose to starved P. amoebophila . P. amoebophila were harvested from amoebal host cell cultures followed by host-free incubation for the indicated periods of time in DGM-D or DGM-L. Subsequently, bacteria incubated in DGM-L were supplemented with D-glucose (83.2 mM final concentration). After an additional incubation of the bacteria for 15 min (27°C, 200 rpm), amoebae were infected at a MOI of 4.3 and the percentage of infected cells was assessed at 48 h p.i. after detection of intracellular bacteria by FISH. The observed infectivity, relative to that observed for 2 h incubation in DGM-D, is shown. Data represent means and standard deviations of three independent experiments, each consisting of three replicate host-free incubations. For each sample at least 600 cells were counted. Statistically significant differences in infectivity observed between the incubation media at selected time points after start of host-free incubation are indicated (t-test; ***, p≤0.001; **, p≤0.01).
(TIF)
Non-annotated 13C-labeled metabolites detected by ICR/FT-MS in DGM-D-13C15N-incubated EBs.
(DOCX)
Media for extracellular incubation of P. amoebophila .
(DOCX)
Acknowledgments
The authors would like to thank David Berry, Martina Grill, Alexander Galushko, Lena König, Michael Wagner, and Wolfgang Wanek from the Department of Microbiology and Ecosystem Science (University of Vienna), as well as Volker Egelhofer from the Department of Ecogenomics and Systems Biology (University of Vienna), for excellent advice and valuable discussions at various stages during this study. Waltraud Klepal and the team of the Core Facility Cell Imaging and Ultrastructure Research (University of Vienna) are gratefully acknowledged for advice and assistance with electron microscopy. The authors thank Katharina Herbst and Georg Häcker from the Institute for Medical Microbiology and Hygiene (University Hospital Freiburg) for kindly donating HeLa 229 cells and C. trachomatis L2.
Funding Statement
The study was funded by the Austrian Science Fund FWF (I291-B09) and the German Federal Ministry of Education and Research in the framework of the ERA-NET project “Pathogen-host metabolomics and interactomics (Pathomics).” BSS is a recipient of a DOC-fFORTE fellowship of the Austrian Academy of Sciences at the Department of Microbial Ecology, University of Vienna, Austria. MH acknowledges support from the European Research Council (ERC StG “EvoChlamy”). The funders had no role in study design, data collection and analysis, decision to publish, or preparation of the manuscript.
References
- 1. Wright HR, Turner A, Taylor HR (2008) Trachoma. Lancet 371: 1945–1954. [DOI] [PubMed] [Google Scholar]
- 2. Bébéar C, de Barbeyrac B (2009) Genital Chlamydia trachomatis infections. Clin Microbiol Infect 15: 4–10. [DOI] [PubMed] [Google Scholar]
- 3. Blasi F, Tarsia P, Aliberti S (2009) Chlamydophila pneumoniae . Clin Microbiol Infect 15: 29–35. [DOI] [PubMed] [Google Scholar]
- 4. Horn M (2008) Chlamydiae as symbionts in eukaryotes. Annu Rev Microbiol 62: 113–131. [DOI] [PubMed] [Google Scholar]
- 5.Kuo CC, Horn M, Stephens RS (2011) The order Chlamydiales In: Krieg NR, Staley JT, Brown DR, Hedlund BP, Paster BJ, et al., editors. Bergey's Manual of Systematic Bacteriology - The Bacteroidetes, Spirochaetes, Tenericutes (Mollicutes), Acidobacteria, Fibrobacteres, Fusobacteria, Dictyoglomi, Gemmatimonadetes, Lentisphaerae, Verrucomicrobia, Chlamydiae, and Planctomycetes. New York: Springer. pp. 844–845. [Google Scholar]
- 6. Corsaro D, Greub G (2006) Pathogenic potential of novel chlamydiae and diagnostic approaches to infections due to these obligate intracellular bacteria. Clin Microbiol Rev 19: 283–297. [DOI] [PMC free article] [PubMed] [Google Scholar]
- 7. Collingro A, Toenshoff ER, Taylor MW, Fritsche TR, Wagner M, et al. (2005) ‘Candidatus Protochlamydia amoebophila’, an endosymbiont of Acanthamoeba spp. Int J Syst Evol Microbiol 55: 1863–1866. [DOI] [PubMed] [Google Scholar]
- 8. Amann R, Springer N, Schonhuber W, Ludwig W, Schmid EN, et al. (1997) Obligate intracellular bacterial parasites of acanthamoebae related to Chlamydia spp. Appl Environ Microbiol 63: 115–121. [DOI] [PMC free article] [PubMed] [Google Scholar]
- 9. Corsaro D, Venditti D (2006) Diversity of the parachlamydiae in the environment. Crit Rev Microbiol 32: 185–199. [DOI] [PubMed] [Google Scholar]
- 10. Haider S, Collingro A, Walochnik J, Wagner M, Horn M (2008) Chlamydia-like bacteria in respiratory samples of community-acquired pneumonia patients. FEMS Microbiol Lett 281: 198–202. [DOI] [PubMed] [Google Scholar]
- 11. Greub G (2009) Parachlamydia acanthamoebae, an emerging agent of pneumonia. Clin Microbiol Infect 15: 18–28. [DOI] [PubMed] [Google Scholar]
- 12. Stephens RS, Kalman S, Lammel C, Fan J, Marathe R, et al. (1998) Genome sequence of an obligate intracellular pathogen of humans: Chlamydia trachomatis . Science 282: 754–759. [DOI] [PubMed] [Google Scholar]
- 13. Kalman S, Mitchell W, Marathe R, Lammel C, Fan J, et al. (1999) Comparative genomes of Chlamydia pneumoniae and C. trachomatis . Nat Genet 21: 385–389. [DOI] [PubMed] [Google Scholar]
- 14. Horn M, Collingro A, Schmitz-Esser S, Beier CL, Purkhold U, et al. (2004) Illuminating the evolutionary history of chlamydiae. Science 304: 728–730. [DOI] [PubMed] [Google Scholar]
- 15.Dean D, Myers GS, Read TD (2006) Lessons and challenges arising from the ‘first wave’ of Chlamydia genome sequencing. In: Bavoil PM, Wyrick PB, editors. Chlamydia - genomics and pathogenesis. Norfolk: Horizon Bioscience. pp. 1–24.
- 16. Greub G, Kebbi-Beghdadi C, Bertelli C, Collyn F, Riederer BM, et al. (2009) High throughput sequencing and proteomics to identify immunogenic proteins of a new pathogen: the dirty genome approach. PLoS One 4: e8423. [DOI] [PMC free article] [PubMed] [Google Scholar]
- 17. Bertelli C, Collyn F, Croxatto A, Ruckert C, Polkinghorne A, et al. (2010) The Waddlia genome: a window into chlamydial biology. PLoS One 5: e10890. [DOI] [PMC free article] [PubMed] [Google Scholar]
- 18. Collingro A, Tischler P, Weinmaier T, Penz T, Heinz E, et al. (2011) Unity in variety - the pan-genome of the Chlamydiae . Mol Biol Evol 28: 3253–3270. [DOI] [PMC free article] [PubMed] [Google Scholar]
- 19.Horn M, Collingro A, Schmitz-Esser S, Wagner M (2006) Environmental chlamydia genomics. In: Bavoil PM, Wyrick PB, editors. Chlamydia: genomics and pathogenesis. Norfolk, UK: Horizon Bioscience. pp. 25–44.
- 20. Iliffe-Lee ER, McClarty G (1999) Glucose metabolism in Chlamydia trachomatis: the ‘energy parasite’ hypothesis revisited. Mol Microbiol 33: 177–187. [DOI] [PubMed] [Google Scholar]
- 21.McClarty G (1999) Chlamydial metabolism as inferred from the complete genome sequence. In: Stephens RS, editor. Chlamydia. Washington DC: American Society for Microbiology. pp. 69–100.
- 22.Matsumoto A (1988) Structural characteristics of chlamydial bodies. In: Barron AL, editor. Microbiology of Chlamydia. Boca Raton, FL: CRC Press. pp. 21–45.
- 23. Abdelrahman YM, Belland RJ (2005) The chlamydial developmental cycle. FEMS Microbiol Rev 29: 949–959. [DOI] [PubMed] [Google Scholar]
- 24.Hatch TP (1999) Developmental Biology. In: Stephens RS, editor. Chlamydia. Washington DC: American Society for Microbiology. pp. 29–67.
- 25. Hackstadt T, Todd WJ, Caldwell HD (1985) Disulfide-mediated interactions of the chlamydial major outer membrane protein: role in the differentiation of chlamydiae? J Bacteriol 161: 25–31. [DOI] [PMC free article] [PubMed] [Google Scholar]
- 26. Hatch T (1996) Disulfide cross-linked envelope proteins: the functional equivalent of peptidoglycan in chlamydiae? J Bacteriol 178: 1–5. [DOI] [PMC free article] [PubMed] [Google Scholar]
- 27. Bavoil P, Ohlin A, Schachter J (1984) Role of disulfide bonding in outer membrane structure and permeability in Chlamydia trachomatis . Infect Immun 44: 479–485. [DOI] [PMC free article] [PubMed] [Google Scholar]
- 28. Peeling RW, Peeling J, Brunham RC (1989) High-resolution 31P nuclear magnetic resonance study of Chlamydia trachomatis: induction of ATPase activity in elementary bodies. Infect Immun 57: 3338–3344. [DOI] [PMC free article] [PubMed] [Google Scholar]
- 29. Hackstadt T, Baehr W, Ying Y (1991) Chlamydia trachomatis developmentally regulated protein is homologous to eukaryotic histone H1. Proc Natl Acad Sci U S A 88: 3937–3941. [DOI] [PMC free article] [PubMed] [Google Scholar]
- 30. Barry CE, Hayes SF, Hackstadt T (1992) Nucleoid condensation in Escherichia coli that express a chlamydial histone homolog. Science 256: 377–379. [DOI] [PubMed] [Google Scholar]
- 31. Perara E, Ganem D, Engel JN (1992) A developmentally regulated chlamydial gene with apparent homology to eukaryotic histone H1. Proc Natl Acad Sci U S A 89: 2125–2129. [DOI] [PMC free article] [PubMed] [Google Scholar]
- 32. Christiansen G, Pedersen LB, Koehler JE, Lundemose AG, Birkelund S (1993) Interaction between the Chlamydia trachomatis histone H1-like protein (Hc1) and DNA. J Bacteriol 175: 1785–1795. [DOI] [PMC free article] [PubMed] [Google Scholar]
- 33. Barry CE 3rd, Brickman TJ, Hackstadt T (1993) Hc1-mediated effects on DNA structure: a potential regulator of chlamydial development. Mol Microbiol 9: 273–283. [DOI] [PubMed] [Google Scholar]
- 34. Pedersen LB, Birkelund S, Christiansen G (1996) Purification of recombinant Chlamydia trachomatis histone H1-like protein Hc2, and comparative functional analysis of Hc2 and Hc1. Mol Microbiol 20: 295–311. [DOI] [PubMed] [Google Scholar]
- 35. Tamura A, Matsumoto A, Higashi N (1967) Purification and chemical composition of reticulate bodies of the meningopneumonitis organisms. J Bacteriol 93: 2003–2008. [DOI] [PMC free article] [PubMed] [Google Scholar]
- 36. Vandahl BB, Birkelund S, Demol H, Hoorelbeke B, Christiansen G, et al. (2001) Proteome analysis of the Chlamydia pneumoniae elementary body. Electrophoresis 22: 1204–1223. [DOI] [PubMed] [Google Scholar]
- 37. Shaw AC, Gevaert K, Demol H, Hoorelbeke B, Vandekerckhove J, et al. (2002) Comparative proteome analysis of Chlamydia trachomatis serovar A, D and L2. Proteomics 2: 164–186. [DOI] [PubMed] [Google Scholar]
- 38. Skipp P, Robinson J, O'Connor CD, Clarke IN (2005) Shotgun proteomic analysis of Chlamydia trachomatis . Proteomics 5: 1558–1573. [DOI] [PubMed] [Google Scholar]
- 39. Saka HA, Thompson JW, Chen YS, Kumar Y, Dubois LG, et al. (2011) Quantitative proteomics reveals metabolic and pathogenic properties of Chlamydia trachomatis developmental forms. Mol Microbiol 82: 1185–1203. [DOI] [PMC free article] [PubMed] [Google Scholar]
- 40. Sixt BS, Heinz C, Pichler P, Heinz E, Montanaro J, et al. (2011) Proteomic analysis reveals a virtually complete set of proteins for translation and energy generation in elementary bodies of the amoeba symbiont Protochlamydia amoebophila . Proteomics 11: 1868–1892. [DOI] [PubMed] [Google Scholar]
- 41. Byers TJ, Akins RA, Maynard BJ, Lefken RA, Martin SM (1980) Rapid growth of Acanthamoeba in defined media; induction of encystment by glucose-acetate starvation. J Protozool 27: 216–219. [DOI] [PubMed] [Google Scholar]
- 42. Schuster FL (2002) Cultivation of pathogenic and opportunistic free-living amebas. Clin Microbiol Rev 15: 342–354. [DOI] [PMC free article] [PubMed] [Google Scholar]
- 43. Haider S, Wagner M, Schmid MC, Sixt BS, Christian JG, et al. (2010) Raman microspectroscopy reveals long-term extracellular activity of chlamydiae. Mol Microbiol 77: 687–700. [DOI] [PubMed] [Google Scholar]
- 44. Omsland A, Sager J, Nair V, Sturdevant DE, Hackstadt T (2012) Developmental stage-specific metabolic and transcriptional activity of Chlamydia trachomatis in an axenic medium. Proc Natl Acad Sci U S A 109: 19781–19785. [DOI] [PMC free article] [PubMed] [Google Scholar]
- 45. Friis RR (1972) Interaction of L cells and Chlamydia psittaci: entry of the parasite and host responses to its development. J Bacteriol 110: 706–721. [DOI] [PMC free article] [PubMed] [Google Scholar]
- 46. Rodriguez GG, Phipps D, Ishiguro K, Ridgway HF (1992) Use of a fluorescent redox probe for direct visualization of actively respiring bacteria. Appl Environ Microbiol 58: 1801–1808. [DOI] [PMC free article] [PubMed] [Google Scholar]
- 47. Creach V, Baudoux AC, Bertru G, Rouzic BL (2003) Direct estimate of active bacteria: CTC use and limitations. J Microbiol Methods 52: 19–28. [DOI] [PubMed] [Google Scholar]
- 48. Cook KL, Garland JL (1997) The relationship between electron transport activity as measured by CTC reduction and CO2 production in mixed microbial communities. Microb Ecol 34: 237–247. [DOI] [PubMed] [Google Scholar]
- 49. Smith JJ, McFeters GA (1997) Mechanisms of INT (2-(4-iodophenyl)-3-(4-nitrophenyl)-5-phenyl tetrazolium chloride), and CTC (5-cyano-2,3-ditolyl tetrazolium chloride) reduction in Escherichia coli K-12. J Microbiol Methods 29: 161–175. [DOI] [PubMed] [Google Scholar]
- 50. Smith EM (1998) Coherence of microbial respiration rate and cell-specific bacterial activity in a coastal planktonic community. Aquat Microb Ecol 16: 27–35. [Google Scholar]
- 51. Hatch TP, Miceli M, Silverman JA (1985) Synthesis of protein in host-free reticulate bodies of Chlamydia psittaci and Chlamydia trachomatis . J Bacteriol 162: 938–942. [DOI] [PMC free article] [PubMed] [Google Scholar]
- 52. Rudney H (1940) The utilization of L-glucose by mammalian tissues and bacteria. Science 92: 112–113. [DOI] [PubMed] [Google Scholar]
- 53. Sun HJ, Saccomanno V, Hedlund B, McKay CP (2009) Stereo-specific glucose consumption may be used to distinguish between chemical and biological reactivity on Mars: a preliminary test on Earth. Astrobiology 9: 443–446. [DOI] [PubMed] [Google Scholar]
- 54. Warmflash D, Chu H, Siefert J, Fox GE (2009) Life detection using glucose and tetrasaccharide enantiomer pairs. Astrobiology 9: 297–303. [DOI] [PubMed] [Google Scholar]
- 55. Yoshioka K, Takahashi H, Homma T, Saito M, Oh KB, et al. (1996) A novel fluorescent derivative of glucose applicable to the assessment of glucose uptake activity of Escherichia coli . Biochim Biophys Acta 1289: 5–9. [DOI] [PubMed] [Google Scholar]
- 56. Muccio Z, Jackson GP (2009) Isotope ratio mass spectrometry. Analyst 134: 213–222. [DOI] [PubMed] [Google Scholar]
- 57. Moseley HN (2010) Correcting for the effects of natural abundance in stable isotope resolved metabolomics experiments involving ultra-high resolution mass spectrometry. BMC Bioinformatics 11: 139. [DOI] [PMC free article] [PubMed] [Google Scholar]
- 58. Ohta D, Kanaya S, Suzuki H (2010) Application of Fourier-transform ion cyclotron resonance mass spectrometry to metabolic profiling and metabolite identification. Curr Opin Biotechnol 21: 35–44. [DOI] [PubMed] [Google Scholar]
- 59. Dunn WB (2008) Current trends and future requirements for the mass spectrometric investigation of microbial, mammalian and plant metabolomes. Phys Biol 5: 011001. [DOI] [PubMed] [Google Scholar]
- 60. Lei Z, Huhman DV, Sumner LW (2011) Mass spectrometry strategies in metabolomics. J Biol Chem 286: 25435–25442. [DOI] [PMC free article] [PubMed] [Google Scholar]
- 61. Suhre K, Schmitt-Kopplin P (2008) MassTRIX: mass translator into pathways. Nucleic Acids Res 36: W481–484. [DOI] [PMC free article] [PubMed] [Google Scholar]
- 62. Tamura A, Higashi N (1963) Purification and chemical composition of meningopneumonitis virus. Virology 20: 596–604. [DOI] [PubMed] [Google Scholar]
- 63. Kahane S, Kimmel N, Friedman MG (2002) The growth cycle of Simkania negevensis . Microbiology 148: 735–742. [DOI] [PubMed] [Google Scholar]
- 64.Nelson DE (2012) The chlamydial cell envelope. In: Ming T, Bavoil PM, editors. Intracellular pathogens I: Chlamydiales. Washington, DC: ASM Press. pp. 74–96.
- 65. Vender J, Moulder JW (1967) Initial step in catabolism of glucose by the meningopneumonitis agent. J Bacteriol 94: 867–869. [DOI] [PMC free article] [PubMed] [Google Scholar]
- 66. Weiss E (1967) Transaminase activity and other enzymatic reactions involving pyruvate and glutamate in Chlamydia (psittacosis-trachoma group). J Bacteriol 93: 177–184. [DOI] [PMC free article] [PubMed] [Google Scholar]
- 67. Weiss E, Neptune EM Jr, Gaugler RW (1968) Influence of gas environment on catabolic activities and on reoxidation of reduced nicotinamide adenine dinucleotide phosphate in Chlamydia . J Bacteriol 96: 1567–1573. [DOI] [PMC free article] [PubMed] [Google Scholar]
- 68. Hatch TP, Al-Hossainy E, Silverman JA (1982) Adenine nucleotide and lysine transport in Chlamydia psittaci . J Bacteriol 150: 662–670. [DOI] [PMC free article] [PubMed] [Google Scholar]
- 69.Hatch TP (1988) Metabolism of Chlamydia In: Barron AL, editor. Microbiology of Chlamydia. Boca Raton, Florida: CRC Press. pp. 97–109.
- 70. Plaunt MR, Hatch TP (1988) Protein synthesis early in the developmental cycle of Chlamydia psittaci . Infect Immun 56: 3021–3025. [DOI] [PMC free article] [PubMed] [Google Scholar]
- 71. Grieshaber NA, Fischer ER, Mead DJ, Dooley CA, Hackstadt T (2004) Chlamydial histone-DNA interactions are disrupted by a metabolite in the methylerythritol phosphate pathway of isoprenoid biosynthesis. Proc Natl Acad Sci U S A 101: 7451–7456. [DOI] [PMC free article] [PubMed] [Google Scholar]
- 72. Sarov I, Becker Y (1971) Deoxyribonucleic acid-dependent ribonucleic acid polymerase activity in purified trachoma elementary bodies - effect of sodium chloride on ribonucleic acid transcription. J Bacteriol 107: 593–598. [DOI] [PMC free article] [PubMed] [Google Scholar]
- 73. Weiss E (1965) Adenosine triphosphate and other requirements for the utilization of glucose by agents of the psittacosis-trachoma group. J Bacteriol 90: 243–253. [DOI] [PMC free article] [PubMed] [Google Scholar]
- 74. Ormsbee RA, Weiss E (1963) Trachoma agent: glucose utilization by purified suspensions. Science 142: 1077–1078. [DOI] [PubMed] [Google Scholar]
- 75. Weiss E, Myers WF, Dressler HR, Chun-Hoon H (1964) Glucose metabolism by agents of the psittacosis-trachoma group. Virology 22: 551–562. [DOI] [PubMed] [Google Scholar]
- 76. Colón JI (1960) Enzymes for formation of citrovorum factor in members of the psittacosis group of microorganisms. J Bacteriol 79: 741–746. [DOI] [PMC free article] [PubMed] [Google Scholar]
- 77. Colón JI (1962) The role of folic acid in the metabolism of members of the psittacosis group of microorganisms. Ann N Y Acad Sci 98: 234–249. [DOI] [PubMed] [Google Scholar]
- 78. Gaugler RW, Neptune EM, Adams GM, Sallee TL, Weiss E, et al. (1969) Lipid synthesis by isolated Chlamydia psittaci . J Bacteriol 100: 823–826. [DOI] [PMC free article] [PubMed] [Google Scholar]
- 79. Weiss E, Wilson NN (1969) Role of exogenous adenosine triphosphate in catabolic and synthetic activities of Chlamydia psittaci . J Bacteriol 97: 719–724. [DOI] [PMC free article] [PubMed] [Google Scholar]
- 80. Schwöppe C, Winkler HH, Neuhaus HE (2002) Properties of the glucose-6-phosphate transporter from Chlamydia pneumoniae (HPTcp) and the glucose-6-phosphate sensor from Escherichia coli (UhpC). J Bacteriol 184: 2108–2115. [DOI] [PMC free article] [PubMed] [Google Scholar]
- 81. Li J, Ward KM, Zhang D, Dayanandam E, Denittis AS, et al. (2012) A bioactive probe of the oxidative pentose phosphate cycle: Novel strategy to reverse radioresistance in glucose deprived human colon cancer cells. Toxicol In Vitro 27: 367–377. [DOI] [PMC free article] [PubMed] [Google Scholar]
- 82. Coulon C, Eterpi M, Greub G, Collignon A, McDonnell G, et al. (2012) Amoebal host range, host-free survival and disinfection susceptibility of environmental chlamydiae as compared to Chlamydia trachomatis . FEMS Immunol Med Microbiol 64: 364–373. [DOI] [PubMed] [Google Scholar]
- 83. Sixt BS, Hiess B, König L, Horn M (2012) Lack of effective anti-apoptotic activities restricts growth of Parachlamydiaceae in insect cells. PloS one 7: e29565. [DOI] [PMC free article] [PubMed] [Google Scholar]
- 84. Heinz E, Rockey DD, Montanaro J, Aistleitner K, Wagner M, et al. (2010) Inclusion membrane proteins of Protochlamydia amoebophila UWE25 reveal a conserved mechanism for host cell interaction among the Chlamydiae . J Bacteriol 192: 5093–5102. [DOI] [PMC free article] [PubMed] [Google Scholar]
- 85. Boutegrabet L, Kanawati B, Gebefugi I, Peyron D, Cayot P, et al. (2012) Attachment of chloride anion to sugars: mechanistic investigation and discovery of a new dopant for efficient sugar ionization/detection in mass spectrometers. Chemistry 18: 13059–13067. [DOI] [PubMed] [Google Scholar]
- 86.Marianna L, Fekete A, Frommberger M, Schmitt-Kopplin P (2011) Metabolomics: High-resolution tools offer to follow bacterial growth on a molecular level. In: de Bruijn FJ, editor. Handbook of Molecular Microbial Ecology I: Metagenomics and Complementary Approaches. Hoboken, NJ, USA: John Wiley & Sons, Inc.
- 87. Tziotis D, Hertkorn N, Schmitt-Kopplin P (2011) Kendrick-analogous network visualisation of ion cyclotron resonance Fourier transform mass spectra: improved options for the assignment of elemental compositions and the classification of organic molecular complexity. Eur J Mass Spectrom (Chichester, Eng) 17: 415–421. [DOI] [PubMed] [Google Scholar]
- 88. Pluskal T, Castillo S, Villar-Briones A, Oresic M (2010) MZmine 2: modular framework for processing, visualizing, and analyzing mass spectrometry-based molecular profile data. BMC Bioinformatics 11: 395. [DOI] [PMC free article] [PubMed] [Google Scholar]
- 89. Poppert S, Essig A, Marre R, Wagner M, Horn M (2002) Detection and differentiation of Chlamydiae by fluorescence in situ hybridization. Appl Environ Microbiol 68: 4081–4089. [DOI] [PMC free article] [PubMed] [Google Scholar]
- 90.Daims H, Stoecker K, Wagner M (2005) Fluorescence in situ hybridization for the detection of prokaryotes. In: Osborn AM, Smith CJ, editors. Advanced Methods in Molecular Microbial Ecology. Abingdon, UK: Bios-Garland. pp. 213–239.
- 91. Aistleitner K, Heinz C, Hörmann A, Heinz E, Montanaro J, et al. (2013) Identification and characterization of a novel porin family highlights a major difference in the outer membrane of chlamydial symbionts and pathogens. PLoS One 8: e55010. [DOI] [PMC free article] [PubMed] [Google Scholar]
Associated Data
This section collects any data citations, data availability statements, or supplementary materials included in this article.
Supplementary Materials
Transmission electron micrographs of purified P. amoebophila developmental stages. P. amoebophila developmental forms were purified from amoebal host cells and separated from each other by density gradient centrifugation, using a previously established protocol [43]. TEM was carried out as described in the respective study [43]. Micrographs of a highly pure EB fraction (collected below 46% gastrografin), as well as of an RB-enriched and an intermediate fraction (collected above 40% gastrografin or at the 40/46% interface, respectively), are shown. A quantitative evaluation indicated a high enrichment of the replicative stage in RB fractions (5% EB, 34% IB, 61% RB), whereas EB fractions were highly enriched in EBs (76% EB, 16% IB, 8% RB) and intermediate fractions represented a more uniform mixture of all stages (38% EB, 35% IB, 27% RB). Bacteria were classified as RBs, EBs, and IBs based on their characteristic morphological features. Thus, bacteria containing reticulated material and a relaxed nucleoid were considered as mature RBs (white arrows), bacteria containing only electron-dense and electron-lucent material were considered as mature EBs (black arrows), and intermediate morphologies were considered as IBs (gray arrowheads). The bar indicates 1 µm.
(TIF)
Visualization of respiratory activity in P. amoebophila developmental stages and the effect of D-glucose deprivation. Activity of P. amoebophila developmental forms was assessed by application of CTC as indicator for respiration. RB (A), intermediate (B), and EB (C) fractions of P. amoebophila were subjected to host-free incubation in DGM-D containing 5 mM CTC either immediately after purification or after a 40 h pre-incubation in DGM-D. A heat-inactivated EB fraction (D) and a lysate of uninfected amoebae (E) were included as controls. The effect of D-glucose deprivation on EB activity was tested by replacement of DGM-D with DGM-L during pre-incubation and incubation with CTC (F). Incubation with CTC was followed by formaldehyde fixation and DNA staining with DAPI. Fluorescence and corresponding DIC images are shown (reduced CTC, red; DAPI, blue). The bar indicates 10 µm.
(TIF)
D-glucose uptake in host-free P. amoebophila EBs revealed by IRMS. An EB-enriched fraction of P. amoebophila was pre-incubated for 40 h in DGM-D, followed by 48 h incubation in DGM-D or DGM-D-13C and subsequent analysis of bacterial biomass by IRMS. Heat-inactivated bacteria incubated in DGM-D-13C were included as control. The amount of incorporated 13C (in nmol 13C/mg DW) in DGM-D-13C-incubated bacteria was calculated by considering the 13C content of DGM-D-incubated bacteria as blank. Diamonds indicate results from individual replicates, bars display mean values. Results from three independent experiments each consisting of two replicate incubations per condition are shown. Bacterial numbers applied per incubation were similar between replicate experiments (between 3.9×10⁹ and 5.9×10⁹ bacteria). The observed difference in 13C incorporation between living and heat-inactivated bacteria was statistically significant (t-test; ***, p≤0.001).
(TIF)
Working scheme for the estimation of the contributions of different metabolic pathways to 13CO2 release. In respect to the release of certain carbon atoms from D-glucose as CO2, three major metabolic scenarios (A–C) were distinguished, which are indicated in the gray box and will here be termed “pathways” for simplicity. The pathway ratio was calculated based on the APE13C in CO2 observed for incubations in media with different labeled D-glucose isotopologs (blue box). Initially, these experimental values were used to calculate an experimental APE13C ratio and the pathway ratio was set to 0∶0∶1 (A∶B∶C), assuming that all D-glucose is completely catabolized (red box). Based on this pathway ratio a corresponding expected ratio of APE13C for the differently labeled substrates was calculated, assuming that pathways A, B, and C lead to a release of 1.83, 1, and 6, respectively, carbons from D-[U-13C6]-glucose, 0, 1, and 1, respectively, carbons from D-[1-13C]-glucose, and 0, 0, and 1, respectively, carbons from D-[6-13C]-glucose. The assumed release of 1.83 carbon atoms per molecule D-[U-13C6]-glucose by pathway A was based on the assumption that pyruvate, as starting molecule for scenario A, is produced with equal probability from glycolysis and PPP activity, the latter of which already releases carbon 1 as CO2 and thus yields a lower amount of pyruvate per molecule glucose. The calculated expected APE13C ratio was then compared to the experimental APE13C ratio. This was followed by stepwise adjustments of B and A until the expected APE13C ratio coincided with the experimentally observed ratio (yellow box). The finally obtained pathway ratio represents an estimation of the contributions of the three considered metabolic scenarios to 13CO2 release by host-free P. amoebophila EBs (green box).
(TIF)
Comparison of ICR/FT-MS metabolite profiles from DGM-D- and DGM-D-13C15N-incubated living and heat-inactivated EBs. In (A) representative ESI(-)ICR/FT-MS spectra of DGM-D- and DGM-D-13C15N-incubated living bacteria, as well as of DGM-D-13C15N-incubated inactivated bacteria, are shown. Spectra illustrate the m/z range of 150–800. In addition, an enlarged view on the m/z range of 175–190 (indicated in gray in the overview spectra), is displayed. A comparison of spectra from living bacteria incubated in the two different media revealed a shift of the D-glucose peak from m/z ∼179 (12C-D-glucose) to m/z ∼185 (13C-D-glucose), while the remaining pattern was unaltered. The exchange of D-glucose and L-phenylalanine in the incubation medium against their stable isotope-labeled analogs thus did not profoundly change the metabolite profile of P. amoebophila EBs. This visual impression, as well as the effect of heat-inactivation, was further tested by pairwise PCA comparisons of spectra from DGM-D- and DGM-D-13C15N-incubated living bacteria (B), and of spectra from DGM-D-1315N-incubated inactivated bacteria with those from DGM-D-incubated living EBs (C) or DGM-D-13C15N-incubated living EBs (D). Note that this analysis revealed a separation of spectra from living and dead bacteria, whereas no separation could be observed for samples from living bacteria incubated in the two different media.
(TIF)
PLS-DA analysis for the extraction of metabolites discriminative for living compared to heat-inactivated EBs. ICR/FT-MS spectra were analyzed by PLS-DA to extract the most discriminative compounds characterizing living compared to inactivated EBs. The PLS-DA model included data from DGM-D-incubated living and DGM-D-13C15N-incubated inactivated EBs. The assignment of discriminative and non-discriminative metabolites to KEGG pathways is displayed in Fig. 4.
(TIF)
Lack of infectivity restoration by addition of D-glucose to starved P. amoebophila . P. amoebophila were harvested from amoebal host cell cultures followed by host-free incubation for the indicated periods of time in DGM-D or DGM-L. Subsequently, bacteria incubated in DGM-L were supplemented with D-glucose (83.2 mM final concentration). After an additional incubation of the bacteria for 15 min (27°C, 200 rpm), amoebae were infected at a MOI of 4.3 and the percentage of infected cells was assessed at 48 h p.i. after detection of intracellular bacteria by FISH. The observed infectivity, relative to that observed for 2 h incubation in DGM-D, is shown. Data represent means and standard deviations of three independent experiments, each consisting of three replicate host-free incubations. For each sample at least 600 cells were counted. Statistically significant differences in infectivity observed between the incubation media at selected time points after start of host-free incubation are indicated (t-test; ***, p≤0.001; **, p≤0.01).
(TIF)
Non-annotated 13C-labeled metabolites detected by ICR/FT-MS in DGM-D-13C15N-incubated EBs.
(DOCX)
Media for extracellular incubation of P. amoebophila .
(DOCX)