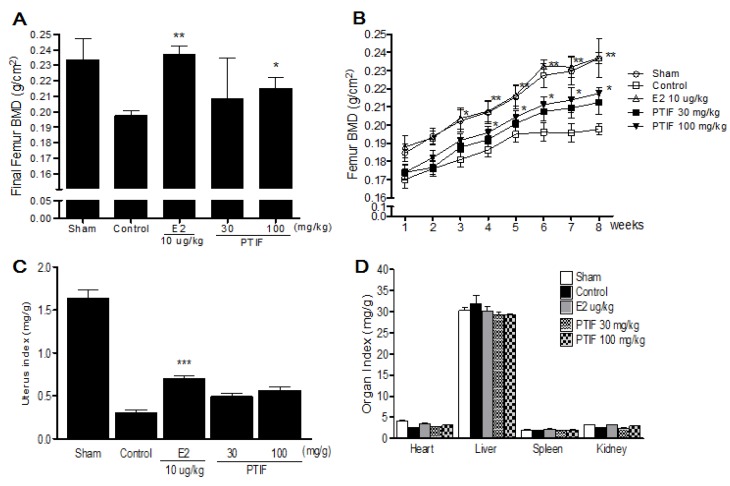
Figure 4.
Effects of PTIF on final femur one mineral density (BMD) (A), femur BMD changes (B), uterus index (C) and organ index (D). Data are the mean ± SEM values (n = 12 per group). Femur BMD changes were statically significant vs. control by repeated-measure ANOVA. Final femur BMD and organs weights were compared with control (one-way ANOVA). * p < 0.05, ** p < 0.01 and *** p < 0.001, significantly different from the OVX-control group.

