

Abstract
Risk of clinically significant prostate adenocarcinoma (CaP) varies worldwide, although there is a uniform prevalence of latent disease. A hormone-responsive tissue, the prostate possesses the metabolizing capacity to biotransform a variety of environmental procarcinogens or endogenous hormones. Whether such metabolizing capacity or estrogen receptor (ER) status underlies these demographic differences in susceptibility to CaP remains unclear. With appropriate ethical permission, verified-benign tissues were obtained following transurethral resection of the prostate from a high-risk region (n = 12 UK-resident Caucasians) and a typically low-risk region (n = 14 India-resident Asians). Quantitative gene expression analysis was employed for cytochrome P450 (CYP)1B1, N-acetyltransferase (NAT)1, NAT2, catechol-O-methyl transferase (COMT), sulfotransferase (SULT)1A1, ERα, ERβ and aromatase (CYP19A1). To quantify the presence or absence of CYP1B1, ERα or ERβ, and to identify their in situ localization, immunohistochemistry was carried out. The two cohorts had reasonably well-matched serum levels of prostate-specific antigen or hormones. Expression levels for the candidate genes investigated were similar. However, clear differences in protein levels for CYP1B1 and ERβ were noted. Staining for CYP1B1 tended to be nuclear-associated in the basal glandular epithelial cells, and in UK-resident Caucasian tissues was present at a higher (P = 0.006) level compared with that from India-resident Asians. In contrast, a higher level of positive ERβ staining was noted in prostates from India-resident Asians. These study findings point to differences in metabolizing capacity and ER status in benign prostate tissues that might modulate susceptibility to the emergence of clinically significant CaP in demographically distinct populations.
Keywords: CYP1B1, estrogen receptor, immunohistochemistry, inter-ethnic, prostate, real-time reverse transcriptase-polymerase chain reaction
Introduction
Risk of prostate adenocarcinoma (CaP) varies worldwide and the etiological mechanisms for this remains obscure. Genetic, environmental, dietary and other lifestyle factors may influence the progression of clinically significant CaP 1; three lines of evidence implicate non-heritable environmental and/or lifestyle factors. First, occurrence of CaP increases in ethnic groups that migrate from low-risk to high-risk regions 2, 3, 4, 5. Second, autopsy studies on latent CaP show a uniform prevalence of the disease in different populations despite the apparent disparity in occurrence of the clinically significant entity. This could suggest that, although initiating factors for latent CaP may be similar in different populations, the mechanisms through which the disease is promoted and/or progressed so that it becomes invasive might be different 6. Finally, there is evidence of a dramatic rise in CaP incidence in traditionally low-risk countries that might be associated with the adoption of a more western lifestyle and diet 7, 8.
There is almost an 80-fold difference in CaP occurrence between low-risk (for example, China) and high-risk (for example, USA) regions; the differences in mortality between the same areas is almost 16-fold 8, 9. CaP incidence in the India-resident Asian population is approximately ninefold lower than that among UK-resident Caucasians. Yet when groups from the same India-resident population migrate to this higher-risk region, they acquire a similar occurrence of clinically significant CaP as in the UK overall; these epidemiological observations point toward an important role for environmental/dietary factors 5, 10. Various endogenous and exogenous substances including procarcinogens, xeno-estrogens or hormones may be biotransformed by the phase I and/or II metabolizing enzymes 11, 12. These procarcinogenic substances may be converted into electrophiles that as ultimate carcinogens are capable of causing cellular damage and DNA mutations that in turn give rise to cancer 11. The presence in the prostate of many such phase I and II enzymes has been shown 13. For instance, cytochrome P450 (CYP)1B1 will bio-activate a wide range of different procarcinogens 14, and this phase I enzyme is expressed at a higher level in the cancer-susceptible peripheral zone (PZ) compared with the transition zone (TZ) of the gland 15.
CaP occurs in a hormone-responsive tissue that possesses the apparent metabolizing capacity to biotransform a variety of environmental procarcinogens 12, 15 or endogenous hormones 16, 17 to DNA-reactive species. Whether such mechanisms underlie the main initiation, promotion and/or progression events giving rise to CaP, remains to be determined. To the best of our knowledge, there have been no molecular studies designed to investigate whether differences in such fundamental mechanisms exist between individuals from high-risk compared with low-risk regions. To this end, we obtained two separate cohorts of prostate tissues, one from a high-risk region (n = 12, UK-resident Caucasians) and the other from a typically low-risk area (n = 14, India-resident Asians). Collected following transurethral resection of the prostate (TURP), these two cohorts of tissues were examined using quantitative real-time reverse transcriptase polymerase chain reaction (RT-PCR) to differentially compare the expression of candidate genes for phase I and II metabolizing enzymes (CYP1B1, N-acetyltransferase [NAT]1, NAT2, catechol-O-methyl transferase [COMT] and sulfotransferase [SULT]1A1), estrogen receptor (ER) isoforms and aromatase (CYP19A1). The aim of this preliminary study was to determine whether in the two reasonably well-matched verified-benign prostate tissue sets, there might be evidence of distinguishing molecular factors that might modulate susceptibility to the emergence of clinically significant CaP in demographically distinct populations.
Materials and methods
Study participants
This study was conducted with appropriate ethical approval at the two centers (LREC No. 06/Q1309/76 for UK-resident participants; institutional ethical approval Workhardt Hospital [Kolkata, India] for India-resident participants). Patients undergoing TURP were identified and prospectively consented on the basis of their having a low risk of harboring CaP (no previous history of CaP, benign-feeling gland on digital rectal examination and prostate-specific antigen (PSA) < 10 ng mL−1 serum), except for one patient who had an open prostatectomy for a > 200 g-sized prostate (PSA = 34 ng mL−1, final histology benign) (CAU 3; see Appendix). Morning (08:00–01:00 hours) blood samples were also collected from all participants to measure serum levels of testosterone, 17β-estradiol (E2) and serum hormone-binding globulin (SHBG).
Tissue collection and storage
Following TURP, prostate chips were immersed in cold normal saline (0.9%) and transported to the laboratory within 5 min. Using aseptic precautions, the prostate tissue from each patient was processed as follows:
(i) A few prostate chips were immersed in RNAlater solution (QIAGEN Ltd, Crawley, West Sussex, UK), kept at −4°C for 24 h and then transferred for storage at −85°C.
(ii) A few prostate chips were formalin-fixed, after which they were paraffin-blocked for subsequent immunohistochemistry (IHC).
The tissues from India were transported to the UK with adequate precautions taken to maintain the appropriate temperature throughout the journey.
Quantitative real-time RT-PCR
The method of RNA extraction, reverse transcription and real-time RT-PCR for prostate tissues has been described previously 12, 15. Briefly, the prostate tissue was ground under liquid nitrogen. Total RNA extraction was performed using the Qiagen RNeasy Kit in combination with the Qiagen RNase-free DNase kit (QIAGEN Ltd.). RNA (0.4 μg) was reverse transcribed in a final volume of 20 μL containing Taqman reverse transcription reagents (Applied Biosystems, Warrington, Cheshire, UK): 1 × Taqman RT buffer, MgCl2 (5.5 mmol L−1); oligo d(T)16 (2.5 μmol L−1); dNTP mix (dGTP, dCTP, dATP and dTTP; each at a concentration of 500 μmol L−1), RNase inhibitor (0.4 U μL−1), reverse transcriptase (MultiScribe) (1.25 U μL−1) and RNase-free water. Reaction mixtures were then incubated at 25°C (10 min), 48°C (30 min) and 95°C (5 min). cDNA samples were stored at −20°C before use.
Primers (Table 1) for CYP1B1, NAT1, NAT2, COMT, SULT1A1, ERα, ERβ, CYP19A1 and the endogenous control β-ACTIN were chosen using Primer Express software 2.0 (Applied Biosystems, Warrington, UK) and designed so that one primer spanned an exon boundary. Specificity was confirmed using the NCBI BLAST search tool. Quantitative real-time PCR was performed using the ABI Prism 7000 Sequence Detection System (Applied Biosystems). Reaction mixtures contained 1 × SYBR Green PCR master mix (Applied Biosystems), forward and reverse primers (Invitrogen, Paisley, UK) at a concentration of 300 nmol L−1 for CYP1B1, NAT1, NAT2, COMT, SULT1A1, ERα, ERβ and CYP19A1 amplification 20 ng cDNA template or for β-ACTIN amplification 5 ng cDNA template, made to a total volume of 25 μL with sterile H2O. Thermal cycling parameters included activation at 95°C (10 min) followed by 40 cycles each of denaturation at 95°C (15 s) and annealing/extending at 60°C (1 min). Each reaction was performed in triplicate and 'no-template' controls were included in each experiment. Dissociation curves were run to eliminate non-specific amplification, including primer-dimers.
Table 1. Primers used for quantitative real-time RT-PCR analyses.
| Gene symbol (GenBank accession No.) | Name | Sequence (5′→3′) |
|---|---|---|
| CYP1B1 (NM_000104) | CYP1B1-F | GTACCGGCCACTATCACTGACA |
| CYP1B1-R | CACATCAGGATACCTGGTGAAGAG | |
| NAT1 (NM_000662) | NAT1-F | TGGGTTTGGACGCTCATACC |
| NAT1-R | TCCGTCAAACGGAAGACACA | |
| NAT2 (NM_000015) | NAT2-F | TGCTGGCCAAAGGGATCA |
| NAT2-R | GGGAACAGCCCGGATCTG | |
| COMT (NM_007310) | COMT-F | CTGGAGGCCATTGACACCTACT |
| COMT-R | TCCACGATCTTGCCTTTCTTG | |
| SULT1A1 (NM_177536.1) | SULT1A1-F | TTCTACGCCGGTATGAGCATT |
| SULT1A1-R | AGGTGTTCCAGAATTTCTGTTTCAG | |
| ERα (NM_000125.3) | ERα-F | TGGACAGGAACCAGGGAAAAT |
| ERα-R | GAGATGATGTAGCCAGCAGCAT | |
| ERβ (NM_001040275.1) | ERβ-F | TGTAAACAGAGAGACACTGAAAAGGAA |
| ERβ-R | CCTCTTTGAACCTGGACCAGTAA | |
| CYP19A1 (Aromatase) (NM_000103.2) | CYP19A1-F | ATACCAGGTCCTGGCTACTGCAT |
| CYP19A1-R | GATCCCCATCCACAGGAATCT | |
| β-ACTIN (AK222925) | β-ACTIN-F | CCTGGCACCCAGCACAAT |
| β-ACTIN-R | GCCGATCCACACGGAGTACT |
Nucleotide sequences were obtained from GenBank; F, forward primer; R, reverse primer.
An unpaired t-test was used to determine any significant difference in differential expression of these genes between the two population sets. Pearson's correlation coefficient was employed to investigate any relevant correlations.
Immunohistochemistry (IHC) staining
Tissues were fixed in formalin before wax embedding and subsequent IHC staining of tissue sections (4-μm thick) was performed manually. Staining took place following de-waxing and re-hydration, and endogenous peroxidase was blocked by flooding the tissue sections with peroxidase blocking reagent (Dako, Envision FLEX, DM801). High-temperature antigen retrieval was performed by heating the tissue sections in citrate buffer (pH 6.0) for 4 min, under pressure and at full power (800 W) in a microwave oven. The antisera anti-CYP1B1 (ME001; Alpha Diagnostic, San Antonio, TX, USA), anti-ERα (ABCAM; ab9269) or anti-ERβ (ABCAM; ab288) were diluted at 1:200 (anti-CYP1B1), 1:20 (anti-ERα) or 1:50 (anti-ERβ) in 0.2% bovine serum albumin in Tris-buffered saline (BSAT) (pH 7.6). The tissue sections were incubated with primary antibody for 30 min at room temperature (except for anti-ERβ, which was incubated overnight at 4°C). Following the manufacturer's instructions for the Vectastain universal Elite ABC kit (Vector Laboratories, Peterborough, UK), the tissue sections were washed with Tris-buffered saline (TBS) for 5 min, incubated for 30 min with secondary antisera (goat anti-rabbit) in BSAT and washed with TBS for 5 min. The tissue sections were then incubated with tertiary antisera (avidin–biotin complex) in BSAT for 30 min and washed again with TBS for 5 min. 3,3′-Diaminobenzidine chromogen in 0.05 mol L−1 Tris/HCl buffer (pH 7.4) with 0.1% H2O2 was applied to preparations for 5 min after which they were washed for 5 min with tap water. Finally, slides were stained (15 s) with Harris' hematoxylin, rinsed with tap water, blued in warm tap water (15 s) and rinsed again. Preparations were dehydrated with graded alcohol solutions through to xylene and mounted with coverslips using Styrolite mounting medium (VWR International, Poole, UK). Parallel control slides, in the absence of primary antibody, were prepared to verify the absence of non-specific staining.
On the basis of the amount of staining, a quantity score was assigned (that is, no staining = 0, 1%–10% positively staining cells = 1, 11%–50% positively staining cells = 2, 51%–80% positively staining cells = 3 and 81%–100% positively staining cells = 4). Furthermore, an intensity score was given depending on whether there was no staining (0), weak staining (1), moderate staining (2) or strong staining (3). For quantification, an IHC score per sample was calculated, which was taken as a multiple of the quantity score and the intensity score for that tissue. The scoring was assigned to be completed by a single senior uro-pathologist (Caroline M. Nicholson) with > 15 years of experience in reporting prostate pathology. Scoring was conducted by the pathologist in a blinded fashion, that being, in a random order without knowledge of the origin of the stained slides or clinical details of the individual participants.
Results
For this study, a cohort of prostate tissues was obtained from each of two distinct demographic regions designated as either high-risk (UK-resident Caucasians, n = 12) or low-risk (India-resident Asians, n = 14) for CaP. These two cohorts were reasonably well matched in terms of age (years), PSA levels (ng mL−1) and serum hormone levels (Table 2). In terms of individual patient demographics (see Table 1S, Appendix), the India-resident cohort tended to be younger (P < 0.05) than their UK counterparts and to exhibit a lower PSA level. There were no significant differences in the serum levels of testosterone or E2. However, a lower (P < 0.0005) level of SHBG was observed in the India-resident cohort. All the retrieved tissue sets were verified as benign by a single pathologist.
Table 2. Demographics of the two participant groups.
| Participant demographics | UK-resident Caucasians (n = 12) (mean; median [range]) | India-resident Asians (n = 14) (mean; median [range]) | P-value |
|---|---|---|---|
| Age (years) | 74.2; 73.0 (62–82) | 65.9; 64.5 (47–79) | < 0.05* |
| PSA (ng mL−1) | 7.3; 5.0 (2.5–34.0§) | 1.5; 1.3 (0.2–3.2) | < 0.05* |
| S. Testosterone (nmol L−1) | 18.0; 17.5 (12.1–25.6) | 16.1; 16.6 (7.3–29.4) | 0.43 |
| S. 17β-Estradiol (pmol L−1) | 127.2; 125.4 (64.8–183.6) | 118.3; 115.6 (36.7–238.6) | 0.62 |
| S. SHBG (nmol L−1) | 56.3; 52.4 (34.4–98.0) | 31.4; 28.4 (19.0–50.0) | < 0.0005* |
| Final histology | Benign; BPH | Benign; BPH |
Abbreviations: BPH, benign prostatic hyperplasia; S, serum; SHBG, serum hormone-binding globulin.
Except for a single patient who had open prostatectomy for a > 200 g-sized prostate (PSA = 34 ng mL−1, final histology benign), all other samples had PSA < 10 ng mL−1 serum.
Statistically significant.
Table 1S. Individual patient age (years), PSA and serum hormone levels.
| Code | Age (years) | PSA (ng mL−1) | S.Testosterone (nmol L−1) | S. 17β-Estradiol (pmol L−1) | S. SHBG (nmol L−1) |
|---|---|---|---|---|---|
| CAU 1 | 81 | 5.0 | 22.1 | 119.7 | 58.2 |
| CAU 2 | 62 | 5.7 | 17.5 | 104.4 | 64.4 |
| CAU 3* | 82 | 34.0 | NK | NK | NK |
| CAU 4 | 71 | 3.75 | 12.2 | 151.0 | 41.0 |
| CAU 5 | 81 | 4.99 | 12.1 | 88.0 | 34.4 |
| CAU 6 | 72 | NK | 17.2 | 125.4 | 48.6 |
| CAU 7 | 72 | 4.96 | 12.7 | 64.8 | 51.5 |
| CAU 8 | 73 | 2.49 | 25.6 | 162.0 | 63.8 |
| CAU 9 | 74 | 6.25 | 16.5 | 183.6 | 65.7 |
| CAU 10 | 79 | 3.75 | 20.4 | 107.0 | 98.0 |
| CAU 11 | 71 | 4.19 | 21.1 | 130.0 | 52.4 |
| CAU 12 | 73 | 5.0 | 21.3 | 163.3 | 41.1 |
| IND 1 | 58 | 1.2 | 24.6 | 124.8 | 35.1 |
| IND 2 | 60 | 2.4 | 16.8 | 77.1 | 44.4 |
| IND 3 | 63 | 0.3 | 16.3 | 113.8 | 37.9 |
| IND 4 | 76 | 3.2 | 13.8 | 80.8 | 24.0 |
| IND 5 | 75 | 0.3 | 7.7 | 36.7 | 50.1 |
| IND 6 | 65 | 0.2 | 8.1 | 80.8 | 21.0 |
| IND 7 | 79 | 2.5 | 18.8 | 238.6 | 32.8 |
| IND 8 | 74 | 0.3 | 7.8 | 124.8 | 19.0 |
| IND 9 | 65 | 0.6 | 7.3 | 99.1 | 24.0 |
| IND 10 | 62 | 3.3 | 29.4 | 157.9 | 50.0 |
| IND 11 | 47 | 2.4 | 16.8 | 165.2 | 20.7 |
| IND 12 | 64 | 2.4 | 13.8 | 88.1 | 21.8 |
| IND 13 | 60 | 0.3 | 24.6 | 117.5 | 35.2 |
| IND 14 | 74 | 1.4 | 19.6 | 150.5 | 24.0 |
Abbreviations: CAU, UK-resident Caucasian; IND, India-resident Asian; NK, not known; PSA, prostate-specific antigen; S, Serum; SHBG, serum hormone-binding globulin
open prostatectomy.
Quantitative gene expression (mRNA) analysis
Quantitative analyses of candidate genes were carried out without earlier knowledge of the histopathological findings. The ranges of averaged threshold cycle (CT) values of amplified cDNA for CYP1B1 were 28.7–38.8 and 28.2–36.1 (one undetectable, IND 5), for COMT 27.7–33.9 and 26.2–34.5, for NAT1 30.9–36.9 and 30.2–37.9, for SULT1A1 30.8–37.5 and 30.4–37.9, for ERα 30.6–37.5 and 29.4–36.4, for ERβ 30.7–38.3 (one undetectable, CAU 10) and 29.7–38.9, and for CYP19A1 31.0–39.3 and 30.3–38.5, for UK-resident Caucasians and India-resident Asians, respectively (see Table 2S, Appendix). However, NAT2 mRNA transcripts were quantifiable in only three (CAU 6, CAU 8 and CAU 12) of 12 UK-resident Caucasian tissues and five (IND 1, IND 6, IND 8, IND 9 and IND 10) of 14 India-resident Asian tissues. Despite this, expression was generally readily quantifiable in all the tissues examined and results were in agreement with previous findings 12, 15.
Table 2S. CT values for mRNA transcripts in human prostate tissues.
| Code | Mean CT values (mean β-ACTIN CT value) |
|||||||
|---|---|---|---|---|---|---|---|---|
| CYP1B1 | COMT | NAT1 | NAT2 | SULT1A1 | ERα | ERβ | CYP19A1 | |
| CAU 1 | 34.5 (23.4) | 30.3 (26.9) | 34.6 (27.6) | nd | 34.2 (26.8) | 33.7 (24.8) | 35.9 (25.1) | 36.9 (26.4) |
| CAU 2 | 32.8 (23.4) | 30.6 (26.7) | 30.9 (27.4) | nd | 34.4 (26.5) | 29.2 (23.9) | 30.7 (25.3) | 31.0 (26.3) |
| CAU 3 | 29.3 (19.7) | 28.4 (23.8) | 33.0 (24.3) | nd | 31.5 (23.6) | 30.6 (21.1) | 33.7 (22.0) | 35.3 (23.2) |
| CAU 4 | 33.2 (23.7) | 31.4 (27.6) | 34.4 (27.7) | nd | 34.6 (24.9) | 33.2 (25.2) | 34.7 (25.3) | 35.7 (26.9) |
| CAU 5 | 32.6 (23.6) | 30.8 (26.9) | 33.7 (27.2) | nd | 35.3 (27.5) | 31.9 (24.0) | 33.7 (25.3) | 34.2 (26.8) |
| CAU 6 | 28.7 (18.6) | 27.7 (21.1) | 32.5 (22.6) | 35.6 (23.0) | 30.8 (21.1) | 30.9 (19.9) | 35.6 (20.7) | 38.7 (22.2) |
| CAU 7 | 37.6 (26.1) | 31.5 (25.7) | 34.7 (26.0) | nd | 35.3 (26.0) | 35.8 (25.3) | 38.3 (25.6) | 36.6 (26.0) |
| CAU 8 | 34.9 (25.0) | 30.5 (25.0) | 34.3 (26.0) | 35.7 (25.7) | 32.1 (23.4) | 34.1 (22.6) | 37.8 (24.0) | 39.3 (25.0) |
| CAU 9 | 37.0 (27.8) | 33.9 (27.8) | 34.4 (27.6) | nd | 35.9 (27.6) | 35.3 (27.8) | 36.3 (27.8) | 34.7 (27.6) |
| CAU 10 | 38.8 (28.4) | 33.1 (28.4) | 36.9 (28.7) | nd | 34.9 (26.6) | 37.5 (26.4) | nd | 38.8 (28.4) |
| CAU 11 | 38.3 (28.0) | 33.1 (28.1) | 35.2 (28.5) | nd | 32.9 (23.8) | 33.3 (26.3) | 33.9 (27.1) | 35.0 (28.4) |
| CAU 12 | 33.9 (22.9) | 29.2 (23.0) | 34.4 (23.4) | 37.0 (24.0) | 32.0 (21.8) | 32.0 (21.3) | 34.9 (21.3) | 37.8 (23.3) |
| IND 1 | 28.2 (19.1) | 26.2 (21.8) | 30.4 (21.7) | 34.9 (21.9) | 32.3 (22.9) | 30.4 (20.3) | 37.2 (20.6) | 37.5 (20.7) |
| IND 2 | 34.0 (24.6) | 31.2 (27.5) | 32.7 (27.4) | nd | 34.8 (28.2) | 31.1 (25.8) | 33.0 (26.2) | 33.9 (26.3) |
| IND 3 | 31.8 (21.3) | 27.5 (23.8) | 30.2 (24.0) | nd | 32.8 (24.6) | 29.8 (22.5) | 30.9 (23.1) | 31.0 (22.5) |
| IND 4 | 34.1 (23.6) | 30.0 (26.3) | 34.7 (26.7) | nd | 35.2 (26.2) | 35.3 (25.1) | 38.9 (25.3) | 38.5 (24.6) |
| IND 5 | UD (27.2) | 34.5 (30.2) | 37.7 (30.2) | nd | 35.9 (30.1) | 36.2 (28.6) | 38.2 (29.1) | 38.6 (28.6) |
| IND 6 | 31.1 (21.3) | 29.1 (23.5) | 31.5 (24.5) | 37.3 (24.3) | 32.5 (24.1) | 29.4 (22.4) | 30.3 (23.7) | 30.4 (23.5) |
| IND 7 | 34.2 (24.1) | 31.2 (25.6) | 30.9 (25.7) | nd | 34.4 (25.3) | 30.1 (24.1) | 29.7 (24.6) | 30.3 (24.3) |
| IND 8 | 28.6 (19.8) | 28.4 (22.3) | 32.6 (22.9) | 34.8 (21.1) | 31.5 (20.6) | 32.3 (20.3) | 36.7 (21.1) | 36.1 (20.1) |
| IND 9 | 33.2 (21.9) | 28.3 (23.7) | 33.1 (24.5) | nd | 32.8 (23.2) | 34.5 (22.2) | 37.3 (22.6) | 38.5 (22.3) |
| IND 10 | 34.4 (22.9) | 29.6 (25.1) | 35.3 (25.8) | 36.7 (23.6) | 33.3 (23.7) | 34.3 (24.2) | 36.1 (24.5) | 36.6 (23.1) |
| IND 11 | 31.4 (20.5) | 25.3 (20.4) | 30.3 (21.2) | 36.5 (24.3) | 30.4 (21.2) | 33.2 (21.4) | 37.3 (20.4) | 36.1 (21.2) |
| IND 12 | 35.8 (26.7) | 30.9 (26.7) | 31.8 (26.8) | nd | 34.0 (26.8) | 31.6 (26.6) | 33.1 (26.7) | 31.1 (26.8) |
| IND 13 | 32.8 (20.8) | 27.0 (21.2) | 33.7 (22.9) | nd | 32.6 (22.9) | 33.7 (22.7) | 33.4 (26.7) | 35.5 (22.9) |
| IND 14 | 36.1 (25.3) | 30.5 (25.8) | 37.9 (29.1) | nd | 37.9 (29.1) | 36.4 (26.5) | 36.7 (21.2) | 37.9 (29.1) |
Abbreviation: CT, threshold cycle; nd, not detectable.
CYP1B1 was expressed in readily quantifiable levels in all the samples except one India-resident sample (IND 5). Up to a five-fold difference in inter-individual expression of this enzyme was observed (Table 3) but there was no significant difference between the two population samples (P = 0.6). The results of the quantitative gene expression analysis of the examined phase II metabolizing enzymes (COMT, NAT1, NAT2, and SULT1A1) are also shown in Table 3. There was a low but uniformly quantifiable level of COMT expression in both cohorts. NAT1 expression was more variable with up to a 10-fold inter-individual difference, whereas NAT2 was present in quantifiable amounts in only eight samples. The expression of SULT1A1 was also more uniform with only up to three-fold inter-individual variation in both cohorts. No significant difference in the quantified gene expression levels for these enzymes was observed between UK-resident and India-resident cohorts.
Table 3. Relative gene expression in prostate tissues derived from UK-resident Caucasians versus India-resident Asians.
| Code | CYP1B1 | COMT | NAT1 | NAT2 | SILT1A1 | ERα | ERβ | CYP19A1 |
|---|---|---|---|---|---|---|---|---|
| CAU 1 | 1* | 1* | 1* | UD | 1* | 1* | 1* | 1* |
| CAU 2 | 3.138 | 0.710 | 10.853 | UD | 0.735 | 12.154 | 40.504 | 54.317 |
| CAU 3 | 2.732 | 0.442 | 0.310 | UD | 0.689 | 0.698 | 0.546 | 0.332 |
| CAU 4 | 2.915 | 0.749 | 1.248 | UD | 0.204 | 1.866 | 2.726 | 3.287 |
| CAU 5 | 4.019 | 0.691 | 1.414 | UD | 0.727 | 1.950 | 5.205 | 8.112 |
| CAU 6 | 1.883 | 0.107 | 0.133 | 1* | 0.214 | 0.236 | 0.060 | 0.015 |
| CAU 7 | 0.696 | 0.179 | 0.308 | UD | 0.253 | 0.345 | 0.277 | 0.924 |
| CAU 8 | 2.308 | 0.229 | 0.398 | 5.762 | 0.408 | 0.168 | 0.126 | 0.075 |
| CAU 9 | 3.802 | 0.159 | 1.104 | UD | 0.509 | 2.738 | 4.779 | 10.363 |
| CAU 10 | 1.584 | 0.395 | 0.431 | UD | 0.529 | 0.210 | UD | 1.087 |
| CAU 11 | 1.655 | 0.321 | 1.228 | UD | 0.323 | 3.724 | 15.816 | 14.554 |
| CAU 12 | 1.042 | 0.144 | 0.065 | 0.749 | 0.147 | 0.290 | 0.142 | 0.063 |
| IND 1 | 4.106 | 0.483 | 0.318 | 0.788 | 0.247 | 0.451 | 0.017 | 0.012 |
| IND 2 | 3.234 | 0.833 | 3.287 | UD | 1.786 | 12.381 | 15.455 | 7.362 |
| IND 3 | 1.569 | 0.801 | 1.717 | UD | 0.554 | 3.074 | 8.037 | 3.991 |
| IND 4 | 1.471 | 0.847 | 0.476 | UD | 0.334 | 0.412 | 0.149 | 0.090 |
| IND 5 | UD | 0.540 | 0.693 | UD | 2.949 | 2.316 | 3.124 | 1.419 |
| IND 6 | 2.502 | 0.208 | 0.973 | 0.747 | 0.511 | 3.672 | 18.442 | 11.713 |
| IND 7 | 1.950 | 0.213 | 3.379 | UD | 0.297 | 7.484 | 50.917 | 22.943 |
| IND 8 | 4.970 | 0.156 | 0.154 | 0.456 | 0.085 | 0.116 | 0.036 | 0.022 |
| IND 9 | 0.891 | 0.449 | 0.306 | 0.675 | 0.226 | 0.091 | 0.069 | 0.020 |
| IND 10 | 0.765 | 0.452 | 0.187 | 1.382 | 0.218 | 0.458 | 0.541 | 0.122 |
| IND 11 | 1.146 | 0.372 | 0.237 | UD | 0.287 | 0.132 | 0.015 | 0.046 |
| IND 12 | 3.900 | 0.589 | 3.767 | UD | 1.079 | 15.067 | 16.564 | 71.506 |
| IND 13 | 0.515 | 0.200 | 0.068 | UD | 0.196 | 0.235 | 0.039 | 0.224 |
| IND 14 | 1.240 | 0.430 | 0.282 | UD | 0.358 | 0.502 | 0.561 | 3.146 |
Abbreviations: CAU, UK-resident Caucasian; IND, India-resident Asian; UD, undetectable or unquantifiable.
calibrator control.
Patients who donated prostate tissue were chronologically numbered. Following resection, mRNA transcripts were compared in tissue sets taking the first measurable sample as the calibrator control. Quantitative gene expression was carried out exactly as previously described 15.
The expression levels of both ER isoforms exhibited wide inter-individual variation (Table 3). ERα was quantifiable in all the samples with up to a 15-fold expression difference in levels of mRNA transcripts between the samples in both cohorts. ERβ was quantifiable in all but one sample (CAU 10) with up to a 50-fold difference compared with the calibrator control (CAU 1). Similarly, aromatase (CYP19A1) expression was up to 70-fold differentially expressed between the prostate tissues derived from study participants (Table 3). However, the overall expression of ERα, ERβ or CYP19A1 did not point to either a consistent under- or over-expression between the two populations and no significant inter-ethnic differences were observed. The ERα/ERβ ratios were also examined and no differences between the two population cohorts were observed (data not shown).
Additionally, no significant correlation was observed between the serum-tested sex steroid hormone levels and the levels of expression of the phase I and/or II metabolizing enzymes or ER isoforms. However, there were positive correlations between ERα and NAT1 (P < 0.0001; Pearson's r = 0.7960) or CYP19A1 (P < 0.0001; Pearson's r = 0.8628). Similarly strong correlations were seen between ERβ and NAT1, and between ERβ and CYP19A1. Correlation was significant though less so between both ER isoforms and SULT1A1.
IHC
IHC analysis of de-waxed 4-μm thick tissue sections for CYP1B1 protein showed that it was detected in nine (of 11 examined) UK-resident Caucasian and nine (of 14) India-resident Asian prostate tissue samples (Table 4). In the glandular elements, characteristic nuclear-associated staining was noted especially in the flattened basal epithelial cells; strong staining in the stroma was also noted (Figure 1A and B; Figure 1S A and B, see Appendix). Quantity scores were higher for the UK-resident Caucasian samples, although most of the samples showed weak staining. A higher (P = 0.006) IHC score was observed in the UK-resident Caucasian compared with the India-resident Asian samples. Although not quantified, this difference seemed to be confined to the epithelial cells lining the glandular elements and there seemed to be relatively equal levels of positive staining for CYP1B1 in the surrounding stroma of both cohorts.
Table 4. Immunohistochemical scores for prostate tissues derived from UK-resident Caucasians versus India-resident Asians.
| Code | CYP1B1 | ERα | ERβ | ||||||
|---|---|---|---|---|---|---|---|---|---|
| Quantity score* | Staining intensity score+ | IHC score (quantity score × intensity score) | Quantity score | Staining intensity score | IHC score (quantity score × intensity score) | Quantity score | Staining intensity score | IHC score (quantity score × intensity score) | |
| CAU 1 | 2 | 1 | 2 | 0 | 0 | 0 | 2 | 3 | 6 |
| CAU 2 | 2 | 1 | 2 | 0 | 0 | 0 | 3 | 3 | 9 |
| CAU 3 | 3 | 1 | 3 | 1 | 2 | 2 | 4 | 3 | 12 |
| CAU 4 | 3 | 1 | 3 | 0 | 0 | 0 | 3 | 2 | 6 |
| CAU 5 | 3 | 1 | 3 | 0 | 0 | 0 | 3 | 2 | 6 |
| CAU 6 | ND | ND | ND | ND | ND | ND | ND | ND | ND |
| CAU 7 | 0 | 0 | 0 | 0 | 0 | 0 | 2 | 1 | 2 |
| CAU 8 | 0 | 0 | 0 | 0 | 0 | 0 | 2 | 1 | 2 |
| CAU 9 | 3 | 2 | 6 | 0 | 0 | 0 | 3 | 3 | 9 |
| CAU 10 | 3 | 1 | 3 | 0 | 0 | 0 | 3 | 3 | 9 |
| CAU 11 | 2 | 1 | 2 | 0 | 0 | 0 | 2 | 2 | 4 |
| CAU 12 | 3 | 1 | 3 | 0 | 0 | 0 | 3 | 2 | 6 |
| IND 1 | 0 | 0 | 0 | 1 | 1 | 1 | 4 | 3 | 12 |
| IND 2 | 0 | 0 | 0 | 0 | 0 | 0 | 4 | 3 | 12 |
| IND 3 | 2 | 1 | 2 | 1 | 1 | 1 | 4 | 3 | 12 |
| IND 4 | 0 | 0 | 0 | 0 | 0 | 0 | 4 | 2 | 8 |
| IND 5 | 1 | 1 | 1 | 0 | 0 | 0 | 3 | 2 | 6 |
| IND 6 | 0 | 0 | 0 | 0 | 0 | 0 | 3 | 2 | 6 |
| IND 7 | 2 | 1 | 2 | 0 | 0 | 0 | 3 | 2 | 6 |
| IND 8 | 1 | 1 | 1 | 2 | 2 | 4 | 3 | 2 | 6 |
| IND 9 | 0 | 0 | 0 | 0 | 0 | 0 | 3 | 2 | 6 |
| IND 10 | 1 | 1 | 1 | 0 | 0 | 0 | 3 | 2 | 6 |
| IND 11 | 2 | 1 | 2 | 0 | 0 | 0 | 4 | 3 | 12 |
| IND 12 | 1 | 1 | 1 | 1 | 1 | 1 | 3 | 3 | 9 |
| IND 13 | 1 | 1 | 1 | 0 | 0 | 0 | 3 | 3 | 9 |
| IND 14 | 2 | 1 | 2 | 0 | 0 | 0 | 3 | 3 | 9 |
Abbreviations: CAU, UK-resident Caucasian; IND, India-resident Asian; ND, immunohistochemistry not performed; IHC, immunohistochemistry.
Quantity score: no staining = 0, 1%–10%; positive staining = 1; 11%–50% positive staining = 2; 51%–80% positive staining = 3 and 81%–100% positive staining = 4.
Staining intensity score: none = 0; weakly-staining = 1, moderate staining = 2 and strong staining = 3.
Figure 1.
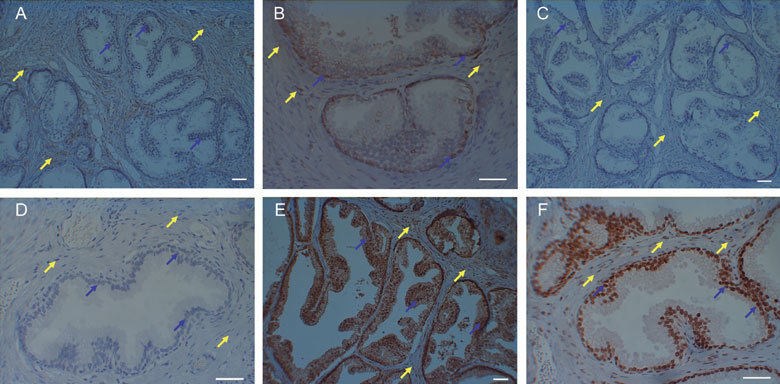
Immunohistochemical staining of prostate tissues. Anti-CYP1B1 staining in (A) tissue derived from an India-resident Asian prostate showing the absence of nuclear-associated staining in cancer-free glandular epithelial cells (blue arrows) but which is present in stroma (yellow arrows); and (B) tissue derived from a UK-resident Caucasian prostate showing the presence of nuclear-associated staining in cancer-free glandular epithelial cells (blue arrows) that is also present in stroma (yellow arrows). Anti-ERα staining in (C) tissue derived from an India-resident Asian prostate showing the absence of nuclear-associated staining in cancer-free glandular epithelial cells (blue arrows) and stroma (yellow arrows); and (D) tissue derived from a UK-resident Caucasian prostate showing the absence of nuclear-associated staining in cancer-free glandular epithelial cells (blue arrows) and stroma (yellow arrows). Anti-ERβ staining in (E) tissue derived from an India-resident Asian prostate showing the presence of intense nuclear-associated and cytosolic staining in cancer-free glandular epithelial cells (blue arrows); and (F) tissue derived from a UK-resident Caucasian prostate showing the presence of nuclear-associated staining in cancer-free glandular epithelial cells (blue arrows). Scale bars = 50 μm.
ERα-positive staining was only noted in five prostate tissue samples: one UK-resident Caucasian (CAU 3) and four India-resident Asians (IND 1, IND 3, IND 8 and IND 12); in general, the staining for this protein was negative (Figure 1C and D). However, positive staining for ERβ protein was observed in all the tissues examined; although no significance (P =0.086) between the UK-resident Caucasian and India-resident Asian cohorts was noted, an elevated level of staining (nuclear-associated and cytosolic) was noted in the latter low-risk group (Figure 1E and F; Figure 1S C and D, [see Appendix]).
Discussion
Differences in the expression of various metabolizing enzymes and ER isoforms in the prostate among high-risk (UK-resident Caucasians) compared with low-risk (India-resident Asians) populations might point to factors or mechanisms responsible for demographic differences in susceptibility to the emergence of clinically significant CaP. In the main, hormone serum levels (testosterone or E2) are similar between the two population cohorts (Table 2) but this might not reflect tissue micro-environmental production or metabolism 12. Although there was a significant difference in SHBG levels (Table 2), the relevance of this significance in such a small study might be questionable, as previous larger population studies examining the role of serum steroid hormones have been inconclusive 16. Examining the tissues themselves, the findings of this study point to differences at the protein level in the expression of CYP1B1 and ERβ in the glandular epithelial cells from which CaP might arise.
Several studies have looked into the presence and role of phase I and/or II enzymes in the prostate. Primary cultures of prostate epithelial cells are capable of bio-activating various procarcinogens 18 and the gland per se harbors many of the enzymes that are capable of activating these agents 19. Amongst the cytochrome P450 (CYP) enzymes, we chose to examine CYP1B1 because previous studies show it to be consistently expressed in this tissue, whereas other CYP1A enzymes are inconsistently detected 13, 15, 16. CYP1B1 is capable in transforming polycyclic aromatic hydrocarbons (PAHs) and heterocyclic aromatic amines (HAAs) into reactive electrophile metabolites 13, forming carcinogenic catechol estrogens 20, 21 and deactivating anticancer drugs 22. COMT metabolizes and deactivates catechol estrogens that mediate estrogen-induced tumorigenesis 23. SULT and NAT can form unstable conjugates of PAHs and HAAs that are DNA-reactive 24, 25.
No significant differences in the expression of the examined phase I and/or II metabolizing enzymes were detected between the two population cohorts (UK-resident Caucasians versus India-resident Asians) (Table 3). However, such mRNA quantification gives no indication of the protein activities of these enzymes. In addition, polymorphic variants of these enzymes, which we have not attempted to determine, might also contribute to inter-ethnic differences in susceptibility to CaP 26. Certain variants of CYP1B1 have been seen to modify CaP risk in different ethnicities 27 and predict response to chemotherapy for CaP 28. Similarly, for phase II enzymes the polymorphism or enzyme activity (that is, slow versus fast acetylation status) may dictate varying risk for a particular disease between different populations 29, 30. Despite inter-individual variation, protein expression of CYP1B1 detected using IHC showed a significant difference in the IHC score between the population samples. This enzyme is known to be over-expressed in CaP tissues when compared with benign or pre-malignant prostatic lesions 31.
Similar to studies on serum levels of other sex hormones, serum estrogen levels may not accurately reflect the intra-prostatic estrogenic milieu. Prostate tissue itself has the necessary enzyme aromatase to produce estrogen locally from testosterone 32, 33. Estrogens at low concentrations can be genotoxic 34, and such effects might have a role in the promotion of CaP 16, 35. In rodent models, estrogen is capable of inducing a variety of tumors and CaP is seen to develop at a shorter interval and with increased frequency when this hormone is administered in addition to testosterone 36, 37. Apart from the direct genotoxicity of catechol estrogens, estrogen might also exert its action through the ER isoforms. ERα is expressed in the cells of the stromal compartment, whereas ERβ is predominantly found in the basal epithelial cells and to a lesser extent in the stromal cell nuclei. There seems to be a progressive loss of ERβ expression in CaP, suggesting a regulatory role for this receptor in suppressing the abnormal growth of the gland 38, 39. Paradoxically, ERβ re-emerges as the predominant ER isoform in advanced metastatic CaP 39, suggesting that a simple regulatory role might be an oversimplification of its function. In our study, ER expression was uniform across both population cohorts. Immunostaining pointed to sparse ERα positivity, whereas staining for ERβ was much more pronounced, especially in the tissues obtained from the India-resident group. This finding is actually counter-intuitive, as E2-mediated transcription activation of CYP1B1 is thought to be mediated through ERα 40, although this latter observation was based on cell lines.
Though studies examined in the Oncomine gene expression analysis database 41 seem to downplay the role of genes like the CYP1B1 and ERβ in CaP, one should be wary of making such conclusions based on the limited number of transcriptomic studies that such databases contain. Furthermore, such transcriptomic studies give no indication of protein or gene expression relative to susceptibility towards developing disease, something this study attempts to do. Of course, our pilot study findings will require verification in a larger population-based study. Additionally, the interplay between the estrogen-signaling mechanisms and androgen receptor pathways remains unknown and, as studies into green tea consumption suggest, might have important roles in chemoprevention of CaP 42, 43.
In addition to the small sample size, there are other limitations to the current study. The affluent (private hospital-treated), cosmopolitan, non-vegetarian cohort of India-resident Asian patients designated as the low-risk cohort may not be completely ideal to reflect the demographic differences in risk factors, as such participants may be influenced by or practicing a more westernized life style compared currently with the general India population. Also, the tissues examined in this study would be expected to consist mostly of TZ of prostate, as this is the region predominantly resected during TURP. Though the TZ accounts for some 25%–30% CaP, the ideal prostate tissue region to conduct such comparative analyses would be the PZ, which accounts for nearly 75% of CaP occurrence. Finally, though we have tried to employ uniform tissue collection, retrieval and storage methods in the two study centers, other unexpected influences may have impacted on our study findings. However, our observations point to differences in benign tissue between a high-risk and low-risk population for CaP that may have important implications for the etiology of this disease.
Figure 1S.
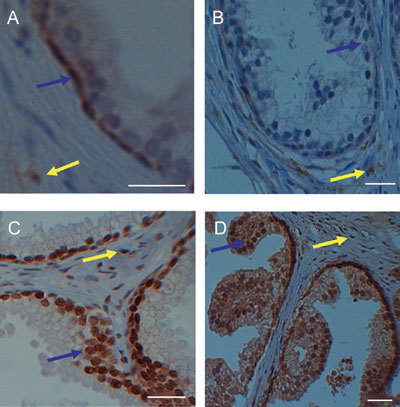
High magnification of immunohistochemical staining of prostate tissues. Anti-CYP1B1staining in (A) tissue derived from a UK-resident Caucasian prostate showing the presence of nuclear-associated staining in cancer-free glandular basal epithelial cells (blue arrow) that is also present in stroma (yellow arrow); and (B) tissue derived from an India-resident Asian prostate showing the absence of nuclear-associated staining in cancer-free glandular epithelial cells (blue arrow) but which is present in stroma (yellow arrow). Anti-ERβ staining in (C) tissue derived from a UK-resident Caucasian prostate showing the presence of nuclear-associated staining in cancer-free glandular epithelial cells (blue arrow) that is also present in stroma (yellow arrow); and (D) tissue derived from an India-resident Asian prostate showing the presence of intense nuclear-associated and cytosolic staining in cancer-free glandular epithelial cells (blue arrow) that is also present in stroma (yellow arrow). Scale bars = 50 μm.
Acknowledgments
This work was funded by Rosemere Cancer Foundation, a medical research charity within Lancashire Teaching Hospitals NHS Trust, Preston, UK.
References
- Schaid DJ.The complex genetic epidemiology of prostate cancer Hum Mol Genet 2004. 13 Spec No 1: R103–21. [DOI] [PubMed]
- Muir CS, Nectoux J, Staszewski J. The epidemiology of prostatic cancer. Geographical distribution and time-trends. Acta Oncol. 1991;30:133–40. doi: 10.3109/02841869109092336. [DOI] [PubMed] [Google Scholar]
- Shimizu H, Ross RK, Bernstein L, Yatani R, Henderson BE, et al. Cancers of the prostate and breast among Japanese and white immigrants in Los Angeles County. Br J Cancer. 1991;63:963–6. doi: 10.1038/bjc.1991.210. [DOI] [PMC free article] [PubMed] [Google Scholar]
- Grover PL, Martin FL. The initiation of breast and prostate cancer. Carcinogenesis. 2002;23:1095–102. doi: 10.1093/carcin/23.7.1095. [DOI] [PubMed] [Google Scholar]
- Rastogi T, Devesa S, Mangtani P, Mathew A, Cooper N, et al. Cancer incidence rates among South Asians in four geographic regions: India, Singapore, UK and US. Int J Epidemiol. 2008;37:147–60. doi: 10.1093/ije/dym219. [DOI] [PubMed] [Google Scholar]
- Yatani R, Chigusa I, Akazaki K, Stemmermann GN, Welsh RA, et al. Geographic pathology of latent prostatic carcinoma. Int J Cancer. 1982;29:611–6. doi: 10.1002/ijc.2910290602. [DOI] [PubMed] [Google Scholar]
- Sim HG, Cheng CW. Changing demography of prostate cancer in Asia. Eur J Cancer. 2005;41:834–45. doi: 10.1016/j.ejca.2004.12.033. [DOI] [PubMed] [Google Scholar]
- Hsing AW, Devesa SS. Trends and patterns of prostate cancer: what do they suggest. Epidemiol Rev. 2001;23:3–13. doi: 10.1093/oxfordjournals.epirev.a000792. [DOI] [PubMed] [Google Scholar]
- Parkin DM, Bray F, Ferlay J, Pisani P. Global cancer statistics, 2002. CA Cancer J Clin. 2005;55:74–108. doi: 10.3322/canjclin.55.2.74. [DOI] [PubMed] [Google Scholar]
- Parkin DM, Whelan SL, Ferlay J, Teppo L, Thomas DB.Cancer Incidence in Five ContinentsVolumeVIIILyon: IARC; 2002 [Google Scholar]
- Nebert DW, Dalton TP. The role of cytochrome P450 enzymes in endogenous signalling pathways and environmental carcinogenesis. Nat Rev Cancer. 2006;6:947–60. doi: 10.1038/nrc2015. [DOI] [PubMed] [Google Scholar]
- John K, Ragavan N, Pratt MM, Singh PB, Al-Buheissi S, et al. Quantification of phase I/II metabolizing enzyme gene expression and polycyclic aromatic hydrocarbon-DNA adduct levels in human prostate. Prostate. 2009;69:505–19. doi: 10.1002/pros.20898. [DOI] [PMC free article] [PubMed] [Google Scholar]
- Williams JA, Martin FL, Muir GH, Hewer A, Grover PL, et al. Metabolic activation of carcinogens and expression of various cytochromes P450 in human prostate tissue. Carcinogenesis. 2000;21:1683–9. doi: 10.1093/carcin/21.9.1683. [DOI] [PubMed] [Google Scholar]
- Shimada T, Hayes CL, Yamazaki H, Amin S, Hecht SS, et al. Activation of chemically diverse procarcinogens by human cytochrome P-450 1B1. Cancer Res. 1996;56:2979–84. [PubMed] [Google Scholar]
- Ragavan N, Hewitt R, Cooper LJ, Ashton KM, Hindley AC, et al. CYP1B1 expression in prostate is higher in the peripheral than in the transition zone. Cancer Lett. 2004;215:69–78. doi: 10.1016/j.canlet.2004.06.051. [DOI] [PubMed] [Google Scholar]
- Singh PB, Matanhelia SS, Martin FL. A potential paradox in prostate adenocarcinoma progression: oestrogen as the initiating driver. Eur J Cancer. 2008;44:928–36. doi: 10.1016/j.ejca.2008.02.051. [DOI] [PubMed] [Google Scholar]
- Martin FL. Complex mixtures that may contain mutagenic and/or genotoxic components: a need to assess in vivo target-site effect(s) associated with in vitro-positive(s) Chemosphere. 2007;69:841–8. doi: 10.1016/j.chemosphere.2007.05.066. [DOI] [PubMed] [Google Scholar]
- Martin FL, Cole KJ, Muir GH, Kooiman GG, Williams JA, et al. Primary cultures of prostate cells and their ability to activate carcinogens. Prostate Cancer Prostatic Dis. 2002;5:96–104. doi: 10.1038/sj.pcan.4500579. [DOI] [PubMed] [Google Scholar]
- Finnström N, Bjelfman C, Söderstrom TG, Smith G, Egevad L, et al. Detection of cytochrome P450 mRNA transcripts in prostate samples by RT-PCR. Eur J Clin Invest. 2001;31:880–6. doi: 10.1046/j.1365-2362.2001.00893.x. [DOI] [PubMed] [Google Scholar]
- Badawi AF, Cavalieri EL, Rogan EG. Role of human cytochrome P450 1A1, 1A2, 1B1, and 3A4 in the 2-, 4-, and 16α-hydroxylation of 17β-estradiol. Metabolism. 2001;50:1001–3. doi: 10.1053/meta.2001.25592. [DOI] [PubMed] [Google Scholar]
- Hayes CL, Spink DC, Spink BC, Cao JQ, Walker NJ, et al. 17β-Estradiol hydroxylation catalyzed by human cytochrome P450 1B1. Proc Natl Acad Sci USA. 1996;93:9776–81. doi: 10.1073/pnas.93.18.9776. [DOI] [PMC free article] [PubMed] [Google Scholar]
- Rochat B, Morsman JM, Murray GI, Figg WD, McLeod HL. Human CYP1B1 and anticancer agent metabolism: mechanism for tumor-specific drug inactivation. J Pharmacol Exp Ther. 2001;296:537–41. [PubMed] [Google Scholar]
- Zhu BT, Liehr JG. Inhibition of the catechol-O-methyl-transferase-catalyzed O-methylation of 2- and 4-hydroxye-stradiol by catecholamine: implications for the mechanism of estrogen-induced carcinogenesis. Arch Biochem Biophys. 1993;304:248–56. doi: 10.1006/abbi.1993.1346. [DOI] [PubMed] [Google Scholar]
- Glatt H. Sulfation and sulfotransferases 4: bioactivation of mutagens via sulfation. FASEB J. 1997;11:314–21. doi: 10.1096/fasebj.11.5.9141497. [DOI] [PubMed] [Google Scholar]
- Hein DW. Molecular genetics and function of NAT1 and NAT2: role in aromatic amine metabolism and carcinogenesis. Mutat Res. 2002;506507:65–77. doi: 10.1016/s0027-5107(02)00153-7. [DOI] [PubMed] [Google Scholar]
- Cussenot O, Azzouzi AR, Nicolaiew N, Fromont G, Mangin P, et al. Combination of polymorphisms from genes related to estrogen metabolism and risk of prostate cancers: the hidden face of estrogens. J Clin Oncol. 2007;25:3596–602. doi: 10.1200/JCO.2007.11.0908. [DOI] [PubMed] [Google Scholar]
- Beuten J, Gelfond JA, Byrne JJ, Balic I, Crandall AC, et al. CYP1B1 variants are associated with prostate cancer in non-Hispanic and Hispanic Caucasians. Carcinogenesis. 2008;29:1751–7. doi: 10.1093/carcin/bgm300. [DOI] [PMC free article] [PubMed] [Google Scholar]
- Sissung TM, Danesi R, Price DK, Steinberg SM, de Wit R, et al. Association of the CYP1B1*3 allele with survival in patients with prostate cancer receiving docetaxel. Mol Cancer Ther. 2008;7:19–26. doi: 10.1158/1535-7163.MCT-07-0557. [DOI] [PubMed] [Google Scholar]
- Garcia-Closas M, Malats N, Silverman D, Dosemeci M, Kogevinas M, et al. NAT2 slow acetylation, GSTM1 null genotype, and risk of bladder cancer: results from the Spanish Bladder Cancer Study and meta-analyses. Lancet. 2005;366:649–59. doi: 10.1016/S0140-6736(05)67137-1. [DOI] [PMC free article] [PubMed] [Google Scholar]
- Nowell S, Ratnasinghe DL, Ambrosone CB, Williams S, Teague-Ross T, et al. Association of SULT1A1 phenotype and genotype with prostate cancer risk in African-Americans and Caucasians. Cancer Epidemiol Biomarkers Prev. 2004;13:270–6. doi: 10.1158/1055-9965.epi-03-0047. [DOI] [PubMed] [Google Scholar]
- Tokizane T, Shiina H, Igawa M, Enokida H, Urakami S, et al. Cytochrome P450 1B1 is overexpressed and regulated by hypomethylation in prostate cancer. Clin Cancer Res. 2005;11:5793–801. doi: 10.1158/1078-0432.CCR-04-2545. [DOI] [PubMed] [Google Scholar]
- Matzkin H, Soloway MS. Immunohistochemical evidence of the existence and localization of aromatase in human prostatic tissues. Prostate. 1992;21:309–14. doi: 10.1002/pros.2990210407. [DOI] [PubMed] [Google Scholar]
- Stone NN, Fair WR, Fishman J. Estrogen formation in human prostatic tissue from patients with and without benign prostatic hyperplasia. Prostate. 1986;9:311–8. doi: 10.1002/pros.2990090402. [DOI] [PubMed] [Google Scholar]
- Yared E, McMillan TJ, Martin FL. Genotoxic effects of oestrogens in breast cells detected by the micronucleus assay and the Comet assay. Mutagenesis. 2002;17:345–52. doi: 10.1093/mutage/17.4.345. [DOI] [PubMed] [Google Scholar]
- Yager JD. Endogenous estrogens as carcinogens through metabolic activation. J Natl Cancer Inst Monogr. 2000;27:63–73. doi: 10.1093/oxfordjournals.jncimonographs.a024245. [DOI] [PubMed] [Google Scholar]
- Noble RL, Hochachka BC, King D. Spontaneous and estrogen-produced tumors in Nb rats and their behavior after transplantation. Cancer Res. 1975;35:766–80. [PubMed] [Google Scholar]
- Noble RL. The development of prostatic adenocarcinoma in Nb rats following prolonged sex hormone administration. Cancer Res. 1977;37:1929–33. [PubMed] [Google Scholar]
- Latil A, Bieche I, Vidaud D, Lidereau R, Berthon P, et al. Evaluation of androgen, estrogen (ER alpha and ER beta), and progesterone receptor expression in human prostate cancer by real-time quantitative reverse transcription-polymerase chain reaction assays. Cancer Res. 2001;61:1919–26. [PubMed] [Google Scholar]
- Leav I, Lau KM, Adams JY, McNeal JE, Taplin ME, et al. Comparative studies of the estrogen receptors beta and alpha and the androgen receptor in normal human prostate glands, dysplasia, and in primary and metastatic carcinoma. Am J Pathol. 2001;159:79–92. doi: 10.1016/s0002-9440(10)61676-8. [DOI] [PMC free article] [PubMed] [Google Scholar]
- Tsuchiya Y, Nakajima M, Kyo S, Kanaya T, Inoue M, et al. Human CYP1B1 is regulated by estradiol via estrogen receptor. Cancer Res. 2004;64:3119–25. doi: 10.1158/0008-5472.can-04-0166. [DOI] [PubMed] [Google Scholar]
- Compendia Bioscience. Ann Arbor, MI: Available from http://www.oncomine.org (Cited 2009 September 9).
- Wang SI, Mukhtar H. Gene expression profile in human prostate LNCaP cancer cells by (–) epigallocatechin-3-gallate. Cancer Lett. 2002;182:43–51. doi: 10.1016/s0304-3835(02)00065-4. [DOI] [PubMed] [Google Scholar]
- Chuu CP, Chen RY, Kokontis JM, Hiipakka RA, Liao S. Suppression of androgen receptor signaling and prostate specific antigen expression by (-)-epigallocatechin-3-gallate in different progression stages of LNCaP prostate cancer cells. Cancer Lett. 2009;275:86–92. doi: 10.1016/j.canlet.2008.10.001. [DOI] [PMC free article] [PubMed] [Google Scholar]