

Abstract
It is now well known that levels of sperm disomy correlate to levels of infertility (as well as other factors). The risk of perpetuating aneuploidy to the offspring of infertile males undergoing intracytoplasmic sperm injection (ICSI) has become a hotly debated issue in assisted reproduction; however, there remain barriers to the practical implementation of offering sperm disomy screening in a clinical setting. The major barrier is the operator time taken to analyze a statistically meaningful (sufficient) number of cells. The introduction of automated 'spot counting' software–hardware combinations presents a potential solution to this problem. In this preliminary validation study, we analyzed 10 patients, both manually and using a commercially available spot counter. Results show a statistically significant correlation between both approaches for scoring of sperm disomy, but no correlation is found when scoring for diploid sperm. The most likely explanation for the latter is an apparent overscoring of two closely associated sperm heads as a single diploid cell. These results, and similar further studies that will ensue, help to inform cost–benefit analyses that individual clinics need to carry out in order to decide whether to adopt sperm aneuploidy screening as a routine tool for the assessment of sperm from men requiring ICSI treatment.
Keywords: aneuploidy, assisted reproductive technologies, automation, fluorescent in situ hybridization, methods, scoring spermatozoa
Introduction
It has been well documented that severe male infertility correlates with a significant increase in sperm aneuploidy; in addition, other factors such as paternal age, chemotherapy treatment, smoking and alcohol have also been associated with increased sperm aneuploidy 1, 2, 3, 4, 5, 6, 7, 8, 9, 10, 11, 12, 13, 14, 15, 16. Given the significant increased risk of sperm aneuploidy in infertile men, concerns have been raised regarding whether these individuals are at a higher risk of giving rise to aneuploid pregnancies when treated by intracytoplasmic sperm injection (ICSI) 17. Recent ICSI follow-up studies suggest that there is indeed an increased risk of aneuploid conceptuses for the sex chromosomes 18, 19, 20; however, no such increase has been reported for autosomal aneuploidies. Sperm aneuploidy screening before ICSI is rarely carried out despite the evidence that many in vitro fertilization (IVF) practitioners consider it to be an important consideration for ICSI men 21. Since the advent of fluorescent in situ hybridization (FISH), sperm aneuploidy has been rapidly adopted by researchers worldwide to study the aetiology of aneuploidy; however, there are a number of practicalities that have precluded its widespread use as a basic screening tool within the clinical setting. That is, although sperm FISH is not a prohibitively expensive technique in terms of probes and sperm preparation, it involves a large amount of training to appreciate and apply the strict scoring criteria; moreover, the large number of sperm cells that have to be scored (1 000–10 000) is costly in terms of operator time. In our experience, scoring FISH signals from an appropriate number of sperms from even a good quality sample, while adhering to strict scoring criteria, takes 30 min to 3 h for 1 000 sperms and between 10 and 20 h for 10 000 sperms, longer if the quality of the sample is suboptimal as oligozoospermic samples often are. Sperm disomy screening does not provide aneuploidy information on individual spermatozoa that could be used subsequently for ICSI; nevertheless, it has the potential to provide individuals with an aneuploidy risk estimate before treatment compared with normal fertile counterparts, and thus, an estimate of the potential of treatment success. Sperm FISH screening in the clinical setting has the potential to provide individuals with valuable information to enable informed decisions to be made regarding their reproductive choices. Patients who may benefit from such screening include cancer patients, recurrent pregnancy loss or repeated unexplained IVF failure patients, patients with structural chromosome aberrations and constitutional sex chromosome aneuploidies 4, 8, 16, 22, 23, 24. Given that the practicalities involved in scoring sperm FISH preparations may impede its introduction into the clinic, an obvious solution is automated 'spot counting' of FISH signals in each cell. Despite the claims of the manufacturers regarding the spot counting capabilities of their various systems, there are few reports in the literature of the successful application of automated spot counting for sperm disomy screening using standard FISH capture systems adapted for automation 25, 26 and laser-scanning cytometry 27, 28. The aim of this study was to determine, whether an automated approach to score disomy and diploidy in sperm was broadly comparable to the current 'gold standard' of manual scoring, and also to make semiquantitative judgements, analyses and comments regarding the relative efficacies of the two approaches.
Materials and methods
Study design
A total of 10 individuals from the London Bridge Fertility Centre (London, UK) with varying semen parameters (from normozoospermia to severe oligoasthenoteratozoospermia, as defined by World Health [WHO] criteria) were identified and recruited to this study. Each gave informed consent, and the study was approved by the University of Kent Local Research and Ethics Committee. FISH was carried out for chromosomes X,Y and 18 using the Aneu Vysion Vysis probe set (Vysis, Downers Grove, IL, USA), as described previously 29. In brief, semen samples were washed five times in 10 mmol L-1 TrisHCl and 10 mmol L-1 NaCl. Following this, 10–20 μL of the washed sample was smeared onto a slide, and once dry, dehydrated through an ethanol series (70%, 80% and 100%) and air dried. Sperm heads were swelled using 0.1 mol L-1 dithiothreitol for 30 min in the dark at room temperature and then dehydrated through an ethanol series and air dried. Probe application, denaturation and post-hybridization washes were carried out as per the manufacturer's guidelines (Vysis), as described previously 29.
Sperm aneuploidy scoring
Following FISH, slides were manually scored on an Olympus BX61 microscope (Olympus, Essex, UK) using Applied Imaging Software (v3.8, Build 212; Applied Imaging, Newcastle upon Tyne, UK). The same slides were subsequently scored by automation using the Olympus BX61 using the Spot AX system, an integrated system from Applied Imaging combining the scanning, relocation, capturing and analysis functions of Cytovision (CV) ChromoScan with a FISH Signal Analysis Database and Review programme. On completion of scoring, the review programme displays a 'gallery' of potentially abnormal cells from which the operator(s) can manually eliminate those that are considered to be neither disomic nor diploid. Our particular system allows for the scoring of eight slides continuously, through use of an automated stage; however, newer hardware options from Applied Imaging include a multiple slide loader, which has the capability to analyze 120 slides without manual intervention.
For the manual analysis, strict scoring criteria were applied as previously described 29, 30. In brief, hybridization efficiency greater than 95%, sperm nuclei of similar size, intact and not overlapping, signals clearly located in the nuclei, distinct, of similar size and intensity with at least one signal distance apart for the same chromosome (to be scored as disomic) and two copies of the gonosomes and autosomes were to be scored as diploid. For the automated scoring of sperm nuclei (Figure 1), the same strict scoring criteria were applied by programming a cell 'DAPI classifier' that enabled the operator to define the parameters for inclusion or exclusion of cells by defining the appropriate size and shape of the sperm nuclei (thus excluding overlapping cells, etc). In addition, the 'DAPI classifier' could be programmed to include or exclude signals on the basis of the scoring criteria requirements (for example, probe size, shape, intensity, location within the nuclei and relative distance between signals).
Figure 1.
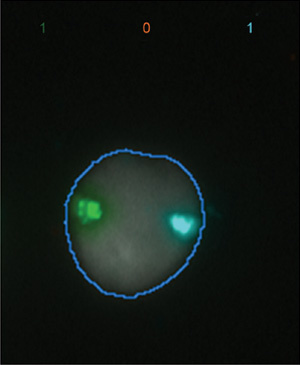
Normal sperm head with single X (Green) and 18 (Aqua) chromosomes, as scored by the automated spot counter.
Statistical analysis
An average of 1 429 sperms were scored per patient and individual sperm were identified as either normal (X-18 or Y-18); sex chromosome disomic (XY-18, XX-18 or YY-18); disomy 18 (X-18-18 or Y-18-18); or diploid (XY-18-18, XX-18-18 or YY-18-18) (Table 1). In keeping with the majority of studies in the literature (reviewed in Tempest and Griffin 31), apparent nullisomic cells were disregarded from the analysis, as they could not be distinguished from failure of FISH hybridization; cells with multiple additional signals were also disregarded. In order to ensure reproducibility of the results, two independent operators carried out both manual scoring and review of the 'gallery' of potentially abnormal sperm cells (following automated scoring). Analysis of variation between the two independent operators was carried out using the kappa statistic. Values were expressed as percentage of abnormal cells (that is, total abnormal cells divided by total cells scored) for both manual and automated scoring. To determine whether there was a correlation between values obtained by automated versus manual scoring, percentage values were entered into Microsoft Excel and expressed as a scatter plot (manual on the x-axis and automated on the y-axis) (Figure 2). The R2 Pearson's correlation coefficient was used to establish whether there was an association between the two types of scoring for total disomy, sex chromosome disomy, disomy 18 and diploidy (retrospectively).
Table 1. Percentage of disomy and diploidy for chromosomes XY and 18 as determined by manual and automated scoring.
| Patient | Scoring | Total cells counted | Sex chromosome disomy (%) | Chromosome 18 disomy (%) | Total disomy (%) | Diploidy (%) |
|---|---|---|---|---|---|---|
| 1 | Manual | 1 000 | 0.90 | 0.30 | 1.20 | 0.2 |
| Automated | 1 964 | 0.41 | 0.10 | 0.51 | 0 | |
| 2 | Manual | 1 000 | 1.00 | 0.10 | 1.10 | 0.1 |
| Automated | 1 395 | 0.79 | 0.07 | 0.86 | 0 | |
| 3 | Manual | 1 080 | 1.48 | 0.37 | 1.85 | 0.46 |
| Automated | 1 317 | 0.99 | 0.22 | 1.21 | 0.38 | |
| 4 | Manual | 1 100 | 2.27 | 0.91 | 3.18 | 0.64 |
| Automated | 1 174 | 1.87 | 1.28 | 3.15 | 0.17 | |
| 5 | Manual | 4 524 | 0.73 | 0.13 | 0.86 | 0.31 |
| Automated | 1 294 | 2.16 | 0.77 | 2.94 | 0.31 | |
| 6 | Manual | 1 050 | 2.19 | 0.29 | 2.48 | 0.38 |
| Automated | 1 360 | 1.99 | 0.15 | 2.13 | 0.29 | |
| 7 | Manual | 1 090 | 1.83 | 0.55 | 2.39 | 0.46 |
| Automated | 2 248 | 1.20 | 0.31 | 1.51 | 0.13 | |
| 8 | Manual | 1 055 | 3.41 | 0.38 | 3.79 | 1.61 |
| Automated | 1 341 | 1.64 | 0.22 | 1.86 | 0.45 | |
| 9 | Manual | 1 009 | 4.46 | 0.30 | 4.76 | 1.88 |
| Automated | 1 103 | 3.45 | 0.18 | 3.63 | 0 | |
| 10 | Manual | 1 038 | 1.73 | 0.29 | 2.02 | 0.48 |
| Automated | 1 439 | 1.04 | 0.21 | 1.25 | 0.28 |
Figure 2.
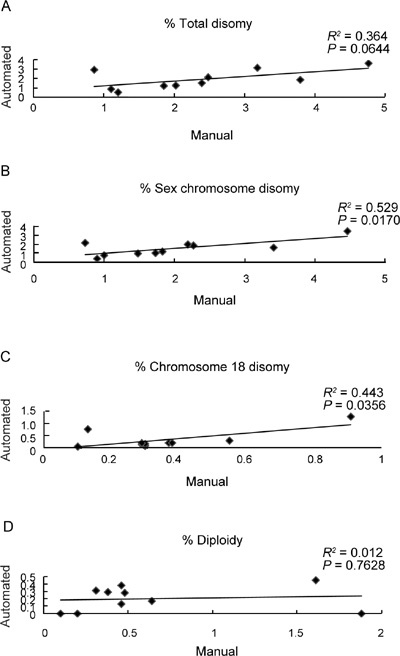
Percentage of cells scored manually (x-axis) vs. automated scoring (y-axis) for (A): Total disomy—R2= 0.364; P = 0.0644; (B): Sex chromosome disomy—R2= 0.529; P = 0.0170; (C): Disomy 18—R2 = 0.443; P = 0.0356 and (D): Diploidy—R2 = 0.012; P = 0.7628.
Results
Reproducibility of the results obtained by the two independent operators was shown to have a substantial degree of agreement beyond that of chance alone, with kappa values of k ≥ 0.71 for all samples and investigated chromosomes. Our results provide statistically significant evidence for a close correlation between the values obtained for automated and manual spot counting in the majority of patients when considering total disomy (sex chromosomes plus disomy 18 combined; R2 = 0.364; P = 0.0644) (Table 1, Figure 2A), as well as individual disomies (that is, sex chromosomes and disomy 18 individually; R2 = 0.529, P = 0.0170; and R2 = 0.443, and P = 0.0356, respectively) (Table 1, Figures 2B and C). For diploidy, however, no correlation was observed, with a significant difference observed between the values obtained for automated and manual scoring (R2 = 0.012; P = 0.7628) (Table 1, Figure 2D).
Discussion
The results in this study suggest that automated sperm scoring may become a feasible and comparable alternative to the manual approach for screening of the levels of sperm disomy. This is in agreement with a recent report using another automated system (that is, MetaSystems) 25; however, Molina et al. 26 using the same Applied Imaging system identified statistical differences between manual and automated scoring in 3.33% of cases. In the current study, our own single outlier (patient 5) reinforces these findings, and thus, the extent to which such discrepancies are acceptable and resolvable (given improved classifiers and training) will remain a matter of debate. In terms of elapsed time taken to carry out the analysis, we found manual and automated scoring to be broadly comparable. Given the variables of operator breaks between scoring sessions and tiredness/concentration of the operator, etc., it was difficult to put empirical values on the manual scoring times. In general terms, however, with a good sample and clear signals, an experienced manual operator could score up to 2 000 cells per hour (this number declined extensively if the operator was less experienced or if the preparation was suboptimal). Interestingly, by and large the automated system scoring time periods also declined with the quality of the sample. Moreover, although the time taken to score the sample was not noticeably different between the two methods, the advantage of automation, however, was that once set up, the system could be left to run unsupervised to score 1–120 slides consecutively (depending on the system installed), perhaps overnight (although with a requirement of manual inspection of the 'gallery' at the end), whereas the manual approach required the operator's undivided attention throughout. In other words, the real advantage of automated analysis derives from the large number of samples that can be analyzed per day. That is, the automated analysis has a higher cost-benefit ratio and it seems likely that, with increased computer power and more efficient hardware, analysis times can only improve. Paradoxically, the observation that diploidy levels were not correlated when comparing the two approaches warrants further analysis. In our experience, when visually inspecting the putative diploid cells, the majority seemed to be two sperm heads 'stuck together' with a clear furrow between the two cells. Such a phenomenon was, in the majority of cases, only visible when the DAPI signal was thresholded and the background glare removed using the image analysis software. Relocation of these individual cells is made possible using the systems hardware and software, thus enabling visual inspection under the microscope. On doing so, around 53%–78% of these cells (depending on the sample) would have been classified as diploid according to the strict scoring criteria used in manual scoring, as there was no evidence to suggest the presence of two cells. However, digital capturing and thresholding of the DAPI background in many cases clearly revealed two cells. It seems reasonable to suggest, therefore, that previous estimates of diploidy levels by manual counting methods in ejaculated sperm, without capturing, may well be overestimates due to the mis-scoring of two cells stuck together as a diploid sperm. This, in part, agrees with Molina et al. 26 who suggested that the lack of correlation between the two approaches for the detection of diploid sperm could be related to the efficiency of the DAPI classifier. A possible point for consideration is whether the concentration of the sample has an effect on the degree to which this phenomenon occurs. Although this would be difficult to measure empirically, anecdotally, at least we have seen no evidence for it. That is, particularly with oligozoospermic samples, cells were usually at a lower density, but did not seem to have a corresponding decrease in 'stuck together' cells. Indeed, in all our preparations, sperms were on average 10–20 cell widths apart.
Although most samples were comparable for disomy scores, at least one (patient 5) had very different scores (0.86% for manual scoring and 2.94% for automated). Although this may well be a statistical anomaly, we have no evidence from repeated analyses to suggest that anything other than similar results would be obtained. One possible explanation is that overswelling of the sperm head led to a greater degree of 'split signals' that caused the classifier to score as two and after visual inspection, the thresholded image still appeared as two signals. We were careful to monitor this, however, and looked back at the images once the results (which were originally scored blind) had been revealed, and could find no evidence for it. Therefore, in future studies similar to this one, we should be diligent for a repeat of similar results.
For the most part, automated scoring is comparable with manual scoring; however, there is still a lack of data to validate the benefit of testing and clinical guidelines, for which patients should be evaluated 22. Undoubtedly, future research and clinical cases, in which sperm disomy scoring is implemented, should be carefully evaluated in an attempt to provide useful information that will ultimately provide clear guidelines for the application of widespread routine clinical sperm disomy screening. In any event, to ensure reproducibility as in this study, independent observers are a minimum requirement.
There are still a number of barriers to the implementation of an automated system. First, automation does not substitute for the training of staff in the correct identification of normal and abnormal cells. Indeed, a degree of manual intervention will probably always be necessary to eliminate mis-scored cells and to 'train' the software classifiers for scoring. Second, the equipment (both software and hardware) and the training time necessary for staff is not an insignificant cost. Standard fluorescent microscopes need to be fitted with automated stages, as well as capture and analysis software. Thus, although it is easy to argue that sperm aneuploidy could, and should be tested, considerable cost-benefit analyses need to be made on a clinic-by-clinic basis. We are confident that the results presented here, though preliminary and requiring further validation on much larger cohorts of patients, go some way towards informing clinics in the formulation of these analyses.
Acknowledgments
We would like to thank Mr Karl Laczko (Applied Imaging, Newcastle upon Tyne, UK) for working with us to apply the spot counting system to sperm aneuploidy and his valuable advice and system training.
References
- Asada H, Sueoka K, Hashiba T, Kuroshima M, Kobayashi N, et al. The effects of age and abnormal sperm count on the non-disjunction of spermatozoa. J Assist Reprod Genet. 2000;17:51–9. doi: 10.1023/A:1009454114973. [DOI] [PMC free article] [PubMed] [Google Scholar]
- Bosch M, Rajmil O, Egozcue J, Templado C. Linear increase of structural and numerical chromosome 9 abnormalities in human sperm regarding age. Eur J Hum Genet. 2003;11:754–9. doi: 10.1038/sj.ejhg.5201049. [DOI] [PubMed] [Google Scholar]
- Faure AK, Aknin-Seifer I, Frerot G, Pelletier R, De Robertis C, et al. Predictive factors for an increased risk of sperm aneuploidies in oligo-astheno-teratoozoosperic males. Int J Androl. 2007;30:153–62. doi: 10.1111/j.1365-2605.2006.00726.x. [DOI] [PubMed] [Google Scholar]
- Frias S, Van Hummelen P, Meistrich ML, Lowe XR, Hagemeister FB, et al. NOVP chemotherapy for Hodgkin's disease transiently induces sperm aneuploidies associated with the major clinical aneuploidy syndromes involving chromosomes X, Y, 18, and 21. Cancer Res. 2003;63:44–51. [PubMed] [Google Scholar]
- Griffin DK, Abruzzo MA, Millie EA, Sheean LA, Feingold E, et al. Non-disjunction in human sperm: evidence for an effect of increasing paternal age. Hum Mol Genet. 1995;4:2227–32. doi: 10.1093/hmg/4.12.2227. [DOI] [PubMed] [Google Scholar]
- Harkonen K, Viitanen T, Larsen SB, Bonde JP, Lähdetie J. Aneuploidy in sperm and exposure to fungicides and lifestyle factors. ASCLEPIOS. A European Concerted Action on Occupational Hazards to Male Reproductive Capability. Environ Mol Mutagen. 1999;34:39–46. doi: 10.1002/(sici)1098-2280(1999)34:1<39::aid-em6>3.0.co;2-f. [DOI] [PubMed] [Google Scholar]
- Lowe X, Eskenazi B, Nelson DO, Kidd S, Alme A, et al. Frequency of XY sperm increases with age in fathers of boys with Klinefelter syndrome. Am J Hum Genet. 2001;69:1046–54. doi: 10.1086/323763. [DOI] [PMC free article] [PubMed] [Google Scholar]
- Martin RH, Ernst S, Rademaker A, Barclay L, Ko E, et al. Chromosomal abnormalities in sperm from testicular cancer patients before and after chemotherapy. Hum Genet. 1997;99:214–8. doi: 10.1007/s004390050342. [DOI] [PubMed] [Google Scholar]
- Martin RH. Chromosome abnormalities in human sperm. Adv Exp Med Biol. 2003;518:181–8. doi: 10.1007/978-1-4419-9190-4_15. [DOI] [PubMed] [Google Scholar]
- Martin RH. Cytogenetic determinants of male fertility. Hum Reprod Update. 2008;14:379–90. doi: 10.1093/humupd/dmn017. [DOI] [PMC free article] [PubMed] [Google Scholar]
- Robbins WA, Baulch JE. Moore D 2nd, Weier HU, Blakey D, et al. Three-probe fluorescence in situ hybridization to assess chromosome X, Y and 8 aneuploidy in sperm of 14 men from two healthy groups: evidence for a paternal age effect on sperm aneuploidy. Reprod Fertil Dev. 1995;7:799–809. doi: 10.1071/rd9950799. [DOI] [PubMed] [Google Scholar]
- Robbins WA, Vine MF, Truong KY, Everson RB. Use of fluorescence in situ hybridization (FISH) to assess effects of smoking, caffeine, and alcohol on aneuploidy load in sperm of healthy men. Environ Mol Mutagenesis. 2005;30:145–83. doi: 10.1002/(sici)1098-2280(1997)30:2<175::aid-em10>3.0.co;2-a. [DOI] [PubMed] [Google Scholar]
- Robbins WA, Elashoff DA, Xun L, Jia J, Li N, et al. Effect of lifestyle exposures on sperm aneuploidy. Cytogenet Gen Res. 2005;111:371–7. doi: 10.1159/000086914. [DOI] [PubMed] [Google Scholar]
- Rubes J, Lowe X. Moore D 2nd, Perreault S, Slott V, et al. Smoking cigarettes is associated with increased sperm disomy in teenage men. Fertil Steril. 1998;70:715–23. doi: 10.1016/s0015-0282(98)00261-1. [DOI] [PubMed] [Google Scholar]
- Shi Q, Ko E, Barclay L, Hoang T, Rademaker A, et al. Cigarette smoking and aneuploidy in human sperm. Mol Reprod Dev. 2001;59:417–21. doi: 10.1002/mrd.1048. [DOI] [PubMed] [Google Scholar]
- Tempest HG, Ko E, Chan P, Robaire B, Rademaker A, et al. Sperm aneuploidy frequencies analysed before and after chemotherapy in testicular cancer and Hodgkin's lymphoma patients. Hum Reprod. 2008;23:251–8. doi: 10.1093/humrep/dem389. [DOI] [PubMed] [Google Scholar]
- Verpoest W, Tournaye H. ICSI: hype or hazard. Hum Fertil. 2006;9:81–92. doi: 10.1080/14647270500422158. [DOI] [PubMed] [Google Scholar]
- Tesarik J, Mendoza C. Treatment of severe male infertility by micromanipulation-assisted fertilization: an update. Front Biosci. 2007;12:105–14. doi: 10.2741/2051. [DOI] [PubMed] [Google Scholar]
- Tournaye H. ICSI: a technique too far. Int J Androl. 2003;26:63–9. doi: 10.1046/j.1365-2605.2003.00380.x. [DOI] [PubMed] [Google Scholar]
- Van Steirteghem A, Bonduelle M, Devroey P, Liebaers I. Follow-up of children born after ICSI. Hum Reprod Update. 2002;8:111–6. doi: 10.1093/humupd/8.2.111. [DOI] [PubMed] [Google Scholar]
- Griffin DK, Hyland P, Tempest HG, Homa ST. Safety issues in assisted reproduction technology: Should men undergoing ICSI be screened for chromosome abnormalities in their sperm. Hum Reprod. 2003;18:229–35. doi: 10.1093/humrep/deg044. [DOI] [PubMed] [Google Scholar]
- Carrell DT. The clinical implementation of sperm chromosome aneuploidy testing: pitfalls and promises. J Androl. 2008;29:124–33. doi: 10.2164/jandrol.107.003699. [DOI] [PubMed] [Google Scholar]
- Ferlin A, Garolla A, Foresta C. Chromosome abnormalities in sperm of individuals with constitutional sex chromosomal abnormalities. Cytogenet Gen Res. 2005;111:310–6. doi: 10.1159/000086905. [DOI] [PubMed] [Google Scholar]
- Morel F, Bernicot I, Herry A, Le Bris MJ, Amice V, et al. An increased incidence of autosomal aneuploidies in spermatozoa from a patient with Klinefelter's syndrome. Fertil Steril. 2003;79:1644–6. doi: 10.1016/s0015-0282(03)00343-1. [DOI] [PubMed] [Google Scholar]
- Carrell DT, Emery BR. Use of automated imaging and analysis technology for the detection of aneuploidy in human sperm. Fertil Steril. 2008;90:434–7. doi: 10.1016/j.fertnstert.2007.06.095. [DOI] [PubMed] [Google Scholar]
- Molina O, Sarrante Z, Vidal F, Blanco J. FISH on sperm: spot-counting to stop counting? Not yet. Fertil Steril. 2009;92:1474–80. doi: 10.1016/j.fertnstert.2008.07.1779. [DOI] [PubMed] [Google Scholar]
- Baumgartner A, Schmid TE, Maerz HK, Adler ID, Tarnok A, et al. Automated evaluation of frequencies of aneuploid sperm by laser-scanning cytometry (LSC) Cytometry. 2001;44:156–60. [PubMed] [Google Scholar]
- Perry MJ, Chen X, Lu X. Automated scoring of multiprobe FISH in human spermatozoa. Cytometry A. 2007;71:968–72. doi: 10.1002/cyto.a.20468. [DOI] [PubMed] [Google Scholar]
- Tempest HG, Homa ST, Dalakiouridou M, Christopikou D, Wright D, et al. The association between male infertility and sperm disomy: evidence for variation in disomy levels among individuals and a correlation between particular semen parameters and disomy of specific chromosome pairs. Reprod Biol Endocrinol. 2004;2:82. doi: 10.1186/1477-7827-2-82. [DOI] [PMC free article] [PubMed] [Google Scholar]
- Tempest HG, Homa ST, Zhai XP, Griffin DK. Significant reduction of sperm disomy in six men: effect of traditional Chinese medicine. Asian J Androl. 2005;7:419–25. doi: 10.1111/j.1745-7262.2005.00068.x. [DOI] [PubMed] [Google Scholar]
- Tempest HG, Griffin DK. The relationship between male infertility and increased levels of sperm disomy. Cytogenet Gen Res. 2004;107:83–94. doi: 10.1159/000079575. [DOI] [PubMed] [Google Scholar]