

Abstract
The aim of the present study was to compare assessments of sperm concentration and sperm motility analysed by conventional semen analysis with those obtained by computer-assisted semen analysis (CASA) (Copenhagen Rigshospitalet Image House Sperm Motility Analysis System (CRISMAS) 4.6 software) using semen samples from 166 young Danish men. The CRISMAS software identifies sperm concentration and classifies spermatozoa into three motility categories. To enable comparison of the two methods, the four motility stages obtained by conventional semen analysis were, based on their velocity classifications, divided into three stages, comparable to the three CRISMAS motility categories: rapidly progressive (A), slowly progressive (B) and non-progressive (C+D). Differences between the two methods were large for all investigated parameters (P<0.001). CRISMAS overestimated sperm concentration and the proportion of rapidly progressive spermatozoa and, consequently, underestimated the percentages of slowly progressive and non-progressive spermatozoa, compared to the conventional method. To investigate whether results drifted according to time of semen analysis, results were pooled into quarters according to date of semen analysis. CRISMAS motility results appeared more stable over time compared to the conventional analysis; however, neither method showed any trends. Apparently, CRISMAS CASA results and results from the conventional method were not comparable with respect to sperm concentration and motility analysis. This needs to be accounted for in clinics using this software and in studies of determinants of these semen characteristics.
Keywords: computer-assisted semen analysis, reproduction, semen analysis, sperm concentration, sperm motility
Introduction
In the research field of reproductive epidemiology, sperm concentration and sperm motility are often used as predictors of reproductive capability, since these semen parameters appear to be associated to couple fecundability.1 In epidemiological semen quality studies, it is essential to include as many participants as possible during a short data collection period in order to gain enough power to enable investigation of the specific hypothesis. Hence, a quick and reproducible method of semen analysis is preferable. The method for conventional semen analysis is a somewhat subjective and time-consuming technique, but by following World Health Organization (WHO) recommendations on conventional semen analysis, results may be comparable worldwide.2 Computer-assisted semen analysis (CASA), on the other hand, is a more objective and timesaving counterpart to the conventional method, since it is based on automated recordings of the semen sample. But how well do these two different methods complement each other?
According to a workshop on clinical CASA in 1995, it was reported that CASA generally tends to overestimate total sperm counts and underestimate proportion of motile spermatozoa at very low sperm concentrations. Additionally, CASA appears to generally underestimate total counts at high sperm concentrations (>100×106 cells ml−1) and overestimate the proportion of motile spermatozoa.3 Currently there is a wide range of different CASA software systems available; thus, in order to utilize their useful properties, it is essential to survey the performance of the different systems compared to the conventional semen analysis method.
Aside from a study performed by Larsen et al.,4 indicating that Copenhagen Rigshospitalet Image House Sperm Motility Analysis System (CRISMAS) parameters can be used as predictors for male fertility, no comparisons between conventional semen analysis and CASA using the CRISMAS software have, to our knowledge, been published. The aim of the present study was to compare semen analysis results obtained from 166 men, using the CRISMAS Version 4.6 CASA software with results from the conventional semen analysis.
Materials and methods
Recruitment of participants
In 2008–2009, 176 young men were recruited to a clinical examination that included a semen analysis. Participants were sons of a cohort of 965 pregnant women enrolled in a study in Aarhus, Denmark, in 1988–1989.5 All 468 sons in the cohort were asked to fill out an Internet-based questionnaire regarding health and lifestyle habits in 2007. Additionally, they were asked whether they approved to be contacted at a later point concerning a clinical examination. One hundred and fifteen declined further contact and thus 353 sons were contacted by letter in 2008–2009 with an invitation to participate. A total of 176 participated in the clinical examinations conducted from February 2008 till September 2009. Based on the initial study population, this corresponded to a participation rate of 37.6%. The mean (s.d.) age of the participants was 20.0 (0.4) years.
Data were missing for 10 men for the following reasons: unable to deliver a semen sample (n=2), CRISMAS CASA not performed (n=7) and conventional semen analysis not performed (n=1). Consequently, data from 166 men were available for this study. The study was approved by the ethical committee, and all participants signed an informed consent prior to the clinical examination. Semen samples were collected into plastic containers by masturbation at the sons' residence or in privacy in a room at the hospital. In order to maintain a sample temperature close to body temperature, the sample container was kept close to the body during transport to the hospital. Semen samples were stored in a heating chamber (37 °C) until semen analysis, which was initiated within 1 h of collection for more than 85% of the samples. All analyses were initiated within 2 h of sample collection.
Conventional semen analysis
Semen samples were analysed by conventional semen analysis for sperm concentration, total sperm count and sperm motility by two trained medical laboratory technologists, who participated in the European Society of Human Reproduction and Embryology external quality-control program.6 One medical laboratory technologist analysed semen samples in the first part of the study and the other succeeded in October 2008, with a small overlap between the two. Semen analysis was performed according to the Nordic Association for Andrology Manual on Basic Semen Analysis,7 and WHO 1999 guidelines.8 Sperm concentration was assessed in duplicates using the improved Neubauer counting chamber and a phase-contrast microscope. Sperm motility was assessed in 6 µl semen added to a 37 °C preheated slide and investigated on a stage warmer at a fixed temperature (37 °C). Spermatozoa were classified into four motility categories by counting the proportion of rapidly progressive (>25 µm s−1) (A), slowly progressive (5–25 µm s−1) (B), non-progressive motile (<5 µm s−1) (C) and immotile spermatozoa (D) for 2×100 spermatozoa. This procedure was repeated twice per semen sample and thus, a total of 400 cells were assessed for motility per semen sample.
CASA
Immediately subsequent to the conventional sperm motility analysis, semen samples were analysed by CASA, using CRISMAS clinical software version 4.6 (Image House Medical, IHMedical A/S, Copenhagen, Denmark). Three microlitres of semen sample were transferred to a 37 °C preheated Micro Cell counting chamber (Conception Technologies, San Diego, CA, USA), a field representing the sample was chosen as starting point and three to five recordings of the semen material were performed at different sites of the counting chamber. By tracking spermatozoa on audio video interleave recording as previously described by Larsen et al.4 and Elzanaty et al.,9 this CASA software calculates sperm concentration, total count, and classifies spermatozoa into three motility categories: motile (curvilinear velocity>25 µm s−1), local motile (curvilinear velocity=5–25 µm s−1) and immotile spermatozoa (curvilinear velocity<5 µm s−1), corresponding to conventional A, B and C+D, respectively.
Definition of comparable motility groups
Since the CRISMAS software classifies all spermatozoa with velocities below 5 µm s−1 as ‘immotile', instead of dividing spermatozoa separately into non-progressive motile and immotile spermatozoa, we created three motility groups for method comparison who, based on the manuals for conventional and CRISMAS CASA analysis, are comparable. Motility stages C and D from the conventional semen analysis were pooled and compared to the equivalent immotile spermatozoa from the CRISMAS output (<5 µm s−1). This motility stage is denoted non-progressive spermatozoa. Motility stage B was compared to CRISMAS local motile and denoted slowly progressive spermatozoa (5–25 µm s−1), and motility stage A was compared to CRISMAS motile spermatozoa and labelled rapidly progressive spermatozoa (>25 µm s−1)4 (Poul Gade-Nielsen, Image House Medical A/S, personal communication).
Statistical methods
Visual inspection of quantile–quantile plots indicated that paired differences were fairly normally distributed. Hence, Bland–Altman plots were used to inspect agreements between the conventional and CRISMAS CASA method. Wilcoxon signed-rank test was used to test whether medians obtained by CRISMAS equalled medians obtained by the conventional method. Large one-way ANOVA was performed in order to produce interclass correlation coefficients (ICC) between the two methods for all four parameters. Method differences between medians at each of the seven quarters covering the data collection period were tested by Wilcoxon signed-rank test.
In order to assess possible time drift in the results for each method, linear regression analysis was used to test whether trend lines for the quarter medians were significantly different from zero and overall association was evaluated in order to test whether any quarters were considerably different from the remaining. Since residuals for sperm concentration data did not follow the normal distribution, sperm concentration data were cubic-root transformed. Differences between quarters were evaluated by testing whether the first quarter (reference group) differed from subsequent quarters using linear regression analysis. All statistical analyses were performed using Stata 11.1 software (Stata Corporation, College Station, TX, USA), and a two-tailed probability level of P<0.05 was considered statistically significant.
Results
As shown in Table 1, standard deviations for the four semen parameters (sperm concentration, rapidly progressive, slowly progressive and non-progressive spermatozoa) obtained by the two methods were not markedly different, but medians differed substantially (P<0.001 for all four parameters). The median conventional sperm concentration and rapidly progressive spermatozoon estimates were 14% and 75% lower than the corresponding CRISMAS medians, whereas CRISMAS median estimates for slowly progressive and non-progressive spermatozoa were 51% and 15% lower than the medians obtained from the conventional analysis, respectively. Hence, CRISMAS overestimated sperm concentration and percentage of rapidly progressive spermatozoa compared to the conventional method, and consequently, CRISMAS underestimated the percentage of slowly progressive and non-progressive spermatozoa, compared to the conventional method.
Table 1. Descriptive statistics for semen parameters for 166 young men from the general Danish population assessed by conventional semen analysis and Copenhagen Rigshospitalet Image House Sperm Motility Analysis System (CRISMAS).
| Variable | Median(range) | Median difference (conventional versus CRISMAS) (range) | P value | Mean (s.d.) |
|---|---|---|---|---|
| Sperm concentration (×106 cells ml−1) | ||||
| Conventional | 37 (1–366) | 52 (53) | ||
| CRISMAS | 43 (2–312) | −4 (−71–118) | <0.001 | 56 (50) |
| %Rapidly progressive (>25 µm s−1) | ||||
| Conventional | 12 (0–79) | 18 (16) | ||
| CRISMAS | 48 (0–91) | −26 (−60–22) | <0.001 | 46 (17) |
| %Slowly progressive (5–25 µm s−1) | ||||
| Conventional | 45 (9–77) | 45 (14) | ||
| CRISMAS | 22 (0–54) | 23 (−34–59) | <0.001 | 23 (10) |
| %Non-progressive (<5 µm s−1) | ||||
| Conventional | 34 (12–73) | 37 (14) | ||
| CRISMAS | 29 (1–100) | 7 (−41–34) | <0.001 | 31 (19) |
P values are obtained by Wilcoxon signed-rank test. Differences between the two methods are calculated for all four semen parameters and the median difference for each parameter is displayed in the table along with the range of the differences.
When rapidly progressive and slowly progressive spermatozoa were pooled as ‘motile' for both methods and compared, differences between the methods were still large (P<0.001).
The ICC for sperm concentration assessments was high (0.92), whereas there was no correlation between the methods' assessments of both rapidly progressive and slowly progressive spermatozoa (ICC=0), and low correlation (ICC=0.54) between conventional and CRISMAS non-progressive sperm assessments.
According to the Bland–Altman plots, depicting differences between the methods as a function of means (Figure 1), differences between the two methods increased with increasing sperm concentration, whereas motility differences were evenly scattered between the limits of agreement. The average of the differences (mean difference) between the two methods' assessments of rapidly progressive spermatozoa (conventionally assessed minus CRISMAS) was −28%, corresponding to an overestimation of the proportion of progressive spermatozoa by CRISMAS, whereas for the slowly progressive spermatozoa, the mean difference was 22%, corresponding to an underestimation by CRISMAS compared to the conventional method.
Figure 1.
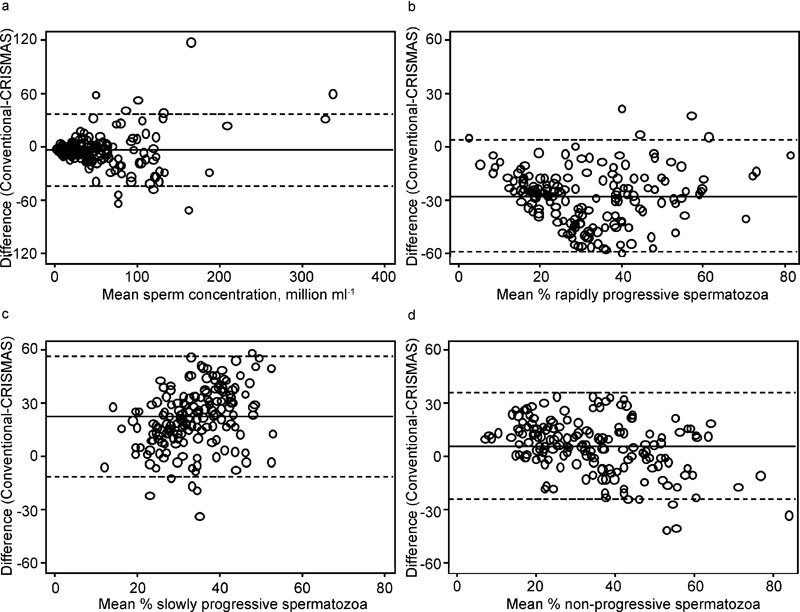
Bland–Altman plots showing method differences (conventional versus CRISMAS) plotted against their mean. (a) Sperm concentration; (b) rapidly progressive spermatozoa; (c) slowly progressive spermatozoa; (d) non-progressive spermatozoa. Solid lines represent mean differences and dotted lines indicate limits of agreement. CRISMAS, Copenhagen Rigshospitalet Image House Sperm Motility Analysis System.
In agreement with Mortimer et al.,3 100% (10/10) CRISMAS total counts exceeded the corresponding conventional analysis results at low conventional sperm concentrations (<5×10⁶ spermatozoa ml−1). For 54% (13/24) of the samples with a sperm concentration above 100×106 ml−1, CRISMAS total counts were lower than the conventional total counts. If rapidly progressive and slowly progressive spermatozoa were pooled as ‘motile', CRISMAS underestimated the proportion of motile cells at low conventional sperm concentration for 90% (9/10) of the samples and for 69% (114/166) of the total amount of semen samples; CRISMAS overestimated the percentage of motile spermatozoa.
In order to test whether semen parameter medians changed substantially according to time of semen analysis, semen sample data were pooled into quarters of the years 2008 and 2009 according to date of semen analysis (Figure 2). Differences between the two methods' sperm concentration assessments were large in the third quarter (P<0.001), whereas for the rapidly progressive and the slowly progressive sperm assessments, medians in quarters 3–7 all differed substantially (quarters 3–6: P<0.001, quarter 7: P=0.012). Non-progressive spermatozoon medians differed in the third (P=0.015), fourth (P<0.001) and seventh (P=0.012) quarters.
Figure 2.
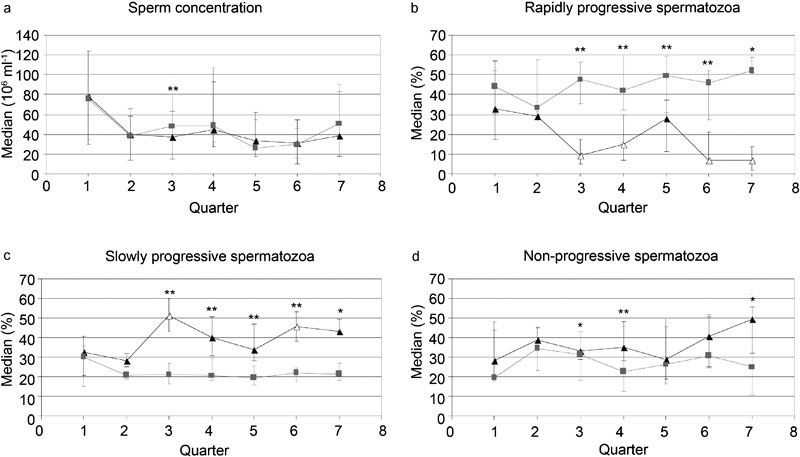
Median sperm concentration (a), rapidly progressive spermatozoa (b), slowly progressive spermatozoa (c) and non-progressive spermatozoa (d) are plotted against quarter of semen analysis. Whiskers represent the 25th and 75th percentiles. Grey curves, cubes and percentiles represent CRISMAS results, and black curves, triangles and percentiles, represent results assessed by the conventional method. *P<0.05, **P<0.001. P values are obtained by Wilcoxon signed-rank test. Unfilled triangles denote P<0.05, compared to reference quarter 1. P values are obtained by linear regression analysis. Quarters 1–4 correspond to the four quarters of 2008 and quarters 5–7 correspond to quarters 1–3 of 2009. CRISMAS, Copenhagen Rigshospitalet Image House Sperm Motility Analysis System.
For the conventionally assessed rapidly progressive and slowly progressive spermatozoa, we found that quarters three (P=0.003), four (P=0.034), six (P=0.005) and seven (P=0.004), and quarters three (P=0.002) and six (P=0.026), respectively, differed substantially from the first quarter of semen analysis. For the remaining parameters there were no indications of time drift and no trends for any of the semen parameters (Figure 2).
A subanalysis restricted to those with sperm concentrations below 40×106 cells ml−1 (n=90) was performed. There was no difference between medians of the non-progressive spermatozoa (P=0.73), nor were there any difference between the two methods if the rapidly and slowly progressive spermatozoa were pooled and compared (P=0.73). Otherwise, results were similar to those of the original analysis performed on the full dataset.
Discussion
The two methods were surprisingly not comparable in any of the four investigated semen parameters. Although estimates of sperm concentration obtained by the conventional method compared with those obtained by CRISMAS produced a high ICC (0.92), medians differed substantially (P<0.001). Similar results were reported in a study comparing Hamilton-Thorn HTM-S 2030 software with the conventional analysis, which concluded that the methods were apparently not comparable.10 In a study by Larsen et al.,4 using CRISMAS version 1.0 along with the conventional method, the median difference between the two methods was less than 5% in all concentration ranges. In the current study, differences between the median sperm concentrations were larger (14%). However, both studies agree that CRISMAS sperm concentration results were generally slightly higher than those obtained by the conventional method.4 Whether differences between these two studies could be due to different use of CRISMAS software versions (1.0 versus 4.6) cannot be excluded. Additionally, differences could of course be due to the subjectivity of the conventional analysis.
According to Table 1, the largest discrepancy between the two methods was observed for assessments of the rapidly progressive spermatozoa, clearly indicating a disagreement in the criteria for assessment of this motility stage. According to a study by Cooper and Yeung,11 it is difficult for even highly experienced technicians to maintain a steady, objective concept of sperm velocity.11 Hence, the observed differences could be attributable to subjective bias caused by misclassification of rapidly progressive spermatozoa as slowly progressive spermatozoa. This would indeed explain the observed difference between medians of slowly progressive spermatozoa. According to Björndahl et al.,12 standardized practical training courses in conventional semen analysis result in substantial improvements in the agreements between participants' values and the reference values, and are therefore central for conventional examination efficiency.12 The medical laboratory technologists did both attend semen analysis training at the European Society of Human Reproduction and Embryology reference laboratory in Stockholm, Sweden, and continuously participated in external semen analysis quality control. Hence, a systematic bias in the conventional assessment of distinguishing rapidly progressive spermatozoa from slowly progressive spermatozoa is improbable, however, not excludable.
The new WHO guidelines on semen analysis stress that estimates of percentage motility obtained by CASA may be unreliable, since debris might be confused with immotile spermatozoa.2 CRISMAS appeared to underestimate the percentage of motile spermatozoa at low sperm concentrations, which according to Mortimer et al.3 could skew motility proportions towards less motile spermatozoa; however, in this study, the proportion of non-progressive spermatozoa was overestimated by the conventional method compared to CRISMAS. Thus, the issue of CASA confusing debris with immotile spermatozoa does not appear to affect the overall motility distributions in this study.3
Furthermore, according to the new WHO guidelines, CASA sperm motility is advised to be assessed only on samples with sperm concentrations between 2×10⁶ and 50×106 cells ml−1, to avoid errors induced by high frequency collisions. This recommendation was not specified in the WHO 1999 guidelines; therefore, the computer-assisted analysis was performed on undiluted samples in the current study.2, 8 Consequently, if CRISMAS does not perform adequately at concentrations below 2×10⁶ cells ml−1 and above 50×106 cells ml−1, this might contribute to the explanation why the methods' motility assessments are almost incomparable.
Only for the conventional method, quarter medians differed substantially from reference quarter one for rapidly and slowly progressive spermatozoon assessments.
The motility assessment variation observed for the conventional method is likely to be partly attributable to the change of medical laboratory technologist we experienced in the fourth quarter of 2008, since CRISMAS results did not appear to be affected by the change. Unfortunately, we were not able to evaluate on intra-observer variability, since the medical laboratory technologists did not re-analyse any of the same samples. Additionally, Figure 2 illustrates that the conventional method probably is more susceptible to drift than the computer-assisted method because of the subjective aspect of the conventional method. The regression analysis results should, however, be considered with caution since most samples were analysed between July 2008 and July 2009 and hence some quarters only included few samples.
There are strengths and limitations to both methods, but the fact that the WHO guidelines, if obeyed and trained properly, enable conventional semen analysis comparisons worldwide, is a major advantage compared to the different CASA softwares, whose algorithms are often not obvious and thus complicated to compare. However, the rapidity and objectivity of the CASA softwares is a non-negligible property, which would be desirable to include in the conventional method. Since both methods may be associated with error, and we do not know the ‘true' value, these results are difficult to interpret. The present data suggest that the main difference between the two methods was their classification of progressive spermatozoa, and that results of sperm concentration and motility obtained by conventional and computer-assisted semen analysis using CRISMAS clinical software version 4.6 are not directly comparable. According to Bonde et al.,1 a sperm concentration below 40×106 cells ml−1 is considered suboptimal. In order to prevent men from being wrongly diagnosed with poor semen quality, it is particularly important to be able to measure the range between 0 and 40×106 cells ml−1 as accurately as possible. We speculated whether the two methods were more exchangeable in this low concentration range. If so, CRISMAS could potentially substitute for the conventional method in the clinic and thus save time and manpower. In the subanalysis, we tested how well the two methods compared in the clinically important range of suboptimal sperm concentrations (0–40×106 cells ml-1). When pooling the rapidly progressive and slowly progressive spermatozoa as ‘motile', it appears that the two methods are interchangeable in making a crude overview of the percentage of motile and non-progressive spermatozoa at sperm concentrations below 40×106 cells ml−1. This should be taken into account in further epidemiological semen quality studies and in clinics using the software for motility analysis.
Author contributions
AV contributed to conception and design of the study, analysis and interpretation of data, and drafted the manuscript. CHR-H contributed to conception and design, analysis and interpretation of data, and has provided critical revision of the manuscript. JPB contributed to analysis and interpretation of data, and critical revision of the manuscript. AMT contributed to conception and design and critical revision of the manuscript. SLK contributed to analysis and interpretation of data, and provided critical revision of the manuscript. GT has contributed to conception and design, analysis and interpretation of data, and provided critical revision of the manuscript. All authors read and approved the final manuscript version.
Acknowledgments
We would like to thank medical laboratory technologists, Karin Fredborg, and Berit Brixen Joergensen, for recruiting study subjects and examining the semen samples, and MSc Poul Gade-Nielsen from Image House A/S for providing technical details of the CRISMAS software. We would also like to thank the Danish Medical Research Council, the Danish Ministry of the Interior and Health, Research Centre for Environmental Health's Fund, the Aarhus University Research Foundation, the Frimodt-Heineke Foundation and the Health Research Fund of Central Denmark Region for funding the study.
None of the authors of this manuscript have any competing financial interests.
References
- Bonde JP, Ernst E, Jensen TK, Hjollund NH, Kolstad H, et al. Relation between semen quality and fertility: a population-based study of 430 first-pregnancy planners. Lancet. 1998;352:1172–7. doi: 10.1016/S0140-6736(97)10514-1. [DOI] [PubMed] [Google Scholar]
- World Health Organization . Geneva; World Health Organization; 2010. WHO Laboratory Manual for the Examination and Processing of Human Semen. 5th ed. [Google Scholar]
- Mortimer D, Aitken RJ, Mortimer ST, Pacey AA. Workshop report: clinical CASA—the quest for consensus. Reprod Fertil Dev. 1995;7:951–9. doi: 10.1071/rd9950951. [DOI] [PubMed] [Google Scholar]
- Larsen L, Scheike T, Jensen TK, Bonde JP, Ernst E, et al. Computer-assisted semen analysis parameters as predictors for fertility of men from the general population. The Danish First Pregnancy Planner Study Team. Hum Reprod. 2000;15:1562–7. doi: 10.1093/humrep/15.7.1562. [DOI] [PubMed] [Google Scholar]
- Olsen SF, Hansen HS, Sandström B, Jensen B. Erythrocyte levels compared with reported dietary intake of marine n-3 fatty acids in pregnant women. Br J Nutr. 1995;73:387–95. doi: 10.1079/bjn19950041. [DOI] [PubMed] [Google Scholar]
- http://www.eshre.eu/ESHRE/English/Specialty-Groups/SIG/Andrology/External-Quality-Control/page.aspx/104
- Kvist U, Björndahl L.Manual on basic semen analysisIn: Heineman MJ, editor. ESHRE Monographs Oxford; Oxford University Press; 2002p24 [Google Scholar]
- World Health Organization . Cambridge; Cambridge University Press; 1999. WHO Laboratory Manual for the Examination of Human Semen and Sperm-Cervical Mucus interaction. 4th ed. [Google Scholar]
- Elzanaty S, Richthoff J, Malm J, Giwercman A. The impact of epididymal and accessory sex gland function on sperm motility. Hum Reprod. 2002;17:2904–11. doi: 10.1093/humrep/17.11.2904. [DOI] [PubMed] [Google Scholar]
- Macleod IC, Irvine DS, Masterton A, Taylor A, Templeton AA. Assessment of the conventional criteria of semen quality by computer-assisted image analysis: evaluation of the Hamilton-Thorn motility analyser in the context of a service andrology laboratory. Hum Reprod. 1994;9:310–9. doi: 10.1093/oxfordjournals.humrep.a138499. [DOI] [PubMed] [Google Scholar]
- Cooper TG, Yeung C. Computer-aided evaluation of assessment of “grade a” spermatozoa by experienced technicians. Fertil Steril. 2006;85:220–4. doi: 10.1016/j.fertnstert.2005.07.1286. [DOI] [PubMed] [Google Scholar]
- Björndahl L, Barrat CL, Fraser LR, Kvist U, Mortimer D. ESHRE basic semen analysis courses 1995–1999: immediate beneficial effects of standardized training. Hum Reprod. 2002;17:1299–305. doi: 10.1093/humrep/17.5.1299. [DOI] [PubMed] [Google Scholar]